Sum of Ticks
- Indikatoren
- Version: 7.4
- Aktualisiert: 24 April 2020
- Aktivierungen: 5

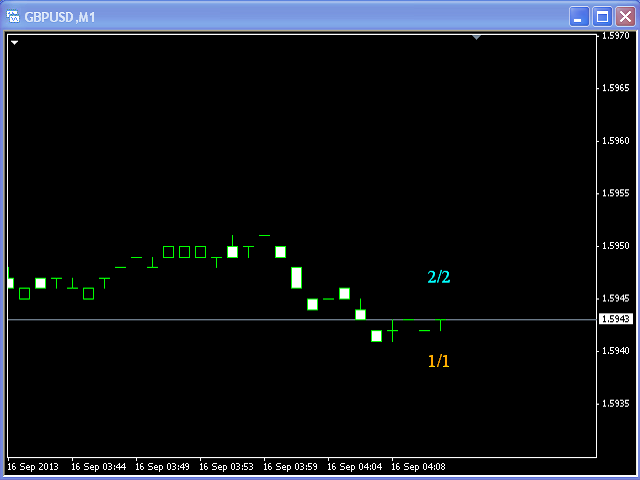
Dieser Indikator ist für den M1-Zeitrahmen erstellt.
Er zeigt an, wie viele Ticks in der aktuellen Minute aufgetreten sind und (nach dem Schrägstrich) die Summe der Punkte Up (aqua Farbe) und Down (orange Farbe).
In Zeiten hoher Handelsaktivität signalisiert eine steigende Anzahl von Ticks nach oben und unten eine große Kursbewegung in naher Zukunft.
In Zeiten hoher Handelsaktivität signalisiert eine steigende Anzahl von Punkten nach oben und nach unten ebenfalls eine große Kursbewegung in naher Zukunft.