Moving Average Bars
- Indikatoren
- Version: 3.52
- Aktualisiert: 20 November 2021
- Aktivierungen: 5

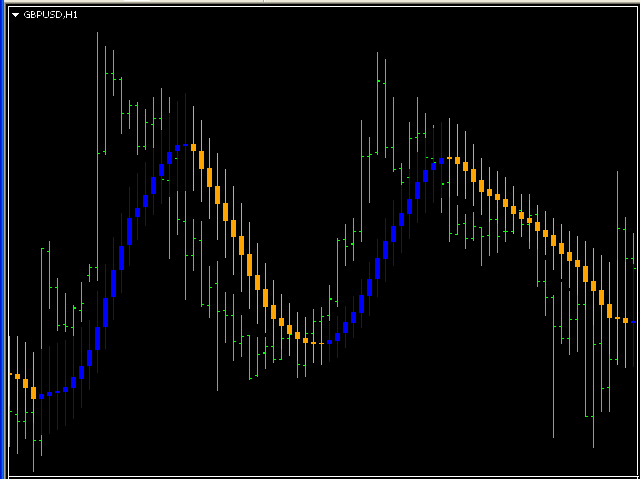
Moving Average Bars ist ein selbsterklärender Indikator mit einem Eingabeparameter: nPeriod.
Wenn der vorherige Schlusskurs über dem vorherigen Indikator-Balken liegt, ist die Wahrscheinlichkeit, dass man Long geht, sehr hoch.
Wenn der vorherige Schlusskurs unter dem vorherigen Indikatorbalken liegt, ist die Wahrscheinlichkeit sehr hoch, short zu gehen.