SFT New Scalper
- Indikatoren
-
Artem Kuzmin
 ALL PRODUCTS ▶️ https://www.mql5.com/ru/users/zombiezorrofx/seller
🔥 Maximum commission discounts:
💠 Binance 35% (trading bypassing sanctions) - Version: 1.0
- Aktivierungen: 5
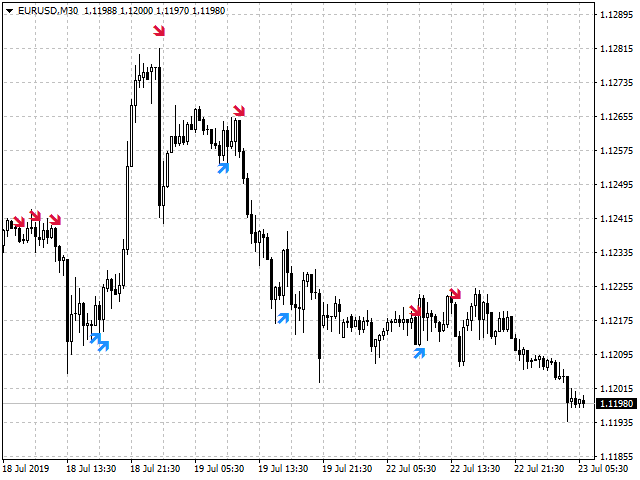
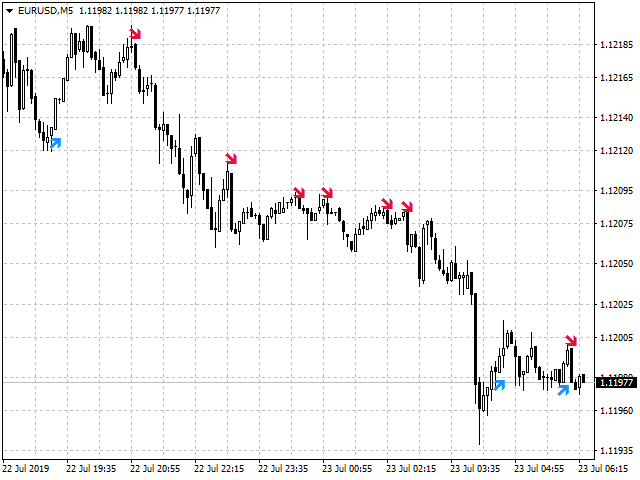
Pfeil-Signalindikator für Scalping
Definiert Preisumkehrungen, Rückschläge und Trendwechsel
Alle Pfeile bleiben an ihrem Platz und verschwinden nicht
Kann Benachrichtigungen an Ihr Telefon oder Ihre E-Mail senden
Funktioniert bei allen Währungspaaren, Metallen und Kryptowährungen
Geeignet für die Arbeit mit binären Optionen
Unverwechselbare Merkmale
- Wird nicht neu gezeichnet;
- Definiert Trendänderungen;
- Sendet Signale an ein Smartphone oder eine E-Mail;
- Erweiterte Einstellungen für die Feinabstimmung;
- Funktioniert auf allen Zeitrahmen und für alle Symbole;
- Geeignet für den Handel mit Währungen, Metallen, Optionen und Kryptowährungen (Bitcoin, Litecoin, Ethereum, etc.)
- Geeignet für den manuellen Handel und für die Entwicklung von Beratern.
Kann sowohl unabhängig als auch in Verbindung mit anderen Indikatoren verwendet werden.
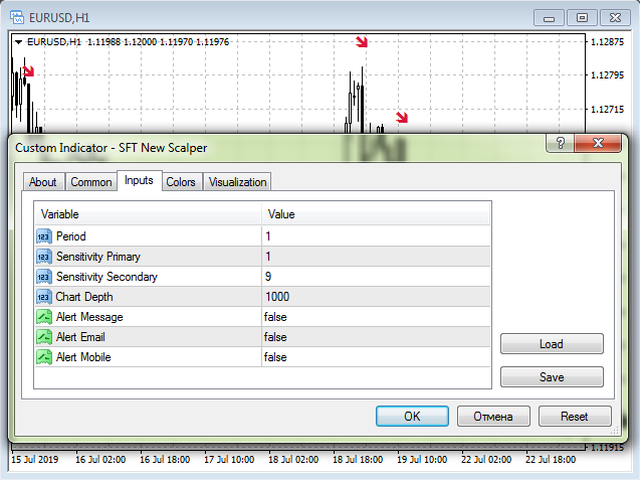
Einstellungen des Indikators
- Zeitraum - Berechnungszeitraum des Indikators;
- Sensitivität Primär - Einstellung der Grundempfindlichkeit;
- Empfindlichkeit sekundär - Einstellung der zusätzlichen Empfindlichkeit;
- Charttiefe - die Tiefe des Indikators auf dem Chart;
- Alert Message - Anzeige von Meldungen auf dem Bildschirm und akustische Bestätigung des Signals;
- Alert Email - sendet Signale an die E-Mail, Anweisungen zum Einrichten des Terminalshier;
- Alert Mobile - sendet an das Telefon, über das installierte mobile Terminal, Anweisungen zur Einrichtunghier;
Handelsempfehlungen
- Wenn der rote Pfeil erscheint, öffnen Sie Sell oder Put (für Optionen)
- Wenn der blaue Pfeil erscheint, öffnen Sie Buy oder Call (für Optionen)
- Die Handelsrichtung sollte mit der Trendrichtung in einem höheren Zeitrahmen übereinstimmen.
- Beenden Sie die Transaktion bei einem umgekehrten Signal oder bei den festgelegten SL und TP.
- Bei der Verwendung von SL und TP ist es ratsam, den SL auf den nächstgelegenen Extremwert zu setzen, TP = 1..2 SL.
- Die Signale funktionieren gut in Kombination mit dem kostenlosen IndikatorSFT Fibo Volatility Channel
Es gibt noch weitere Optionen, im Laufe des Handels können Sie die für Sie am besten geeignete Taktik entwickeln.
Weitere Informationen und einen detaillierten Überblick über die Handelsmethoden finden Sie hier:
Handelsstrategie mit SFT New Scalper
Wir wünschen Ihnen einen stabilen und profitablen Handel.
Vielen Dank, dass Sie unsere Software nutzen.
Wenn es Ihnen gefällt, dann tun Sie eine gute Tat und teilen Sie den Link mit Ihren Freunden.
Um die Veröffentlichung von neuen nützlichen Programmen für den Handel nicht zu verpassen - fügen Sie als Freund hinzu: SURE FOREX TRADING