SFT Trend Tape
- Indikatoren
-
Artem Kuzmin
 ALL PRODUCTS ▶️ https://www.mql5.com/ru/users/zombiezorrofx/seller
🔥 Maximum commission discounts:
💠 Binance 35% (trading bypassing sanctions) - Version: 1.0
- Aktivierungen: 5
Eine der wichtigsten Komponenten eines erfolgreichen Handels ist die korrekte Bestimmung der Marktrichtung.
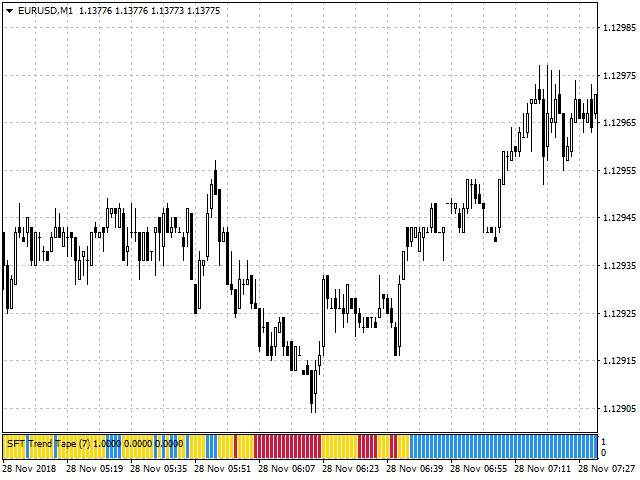
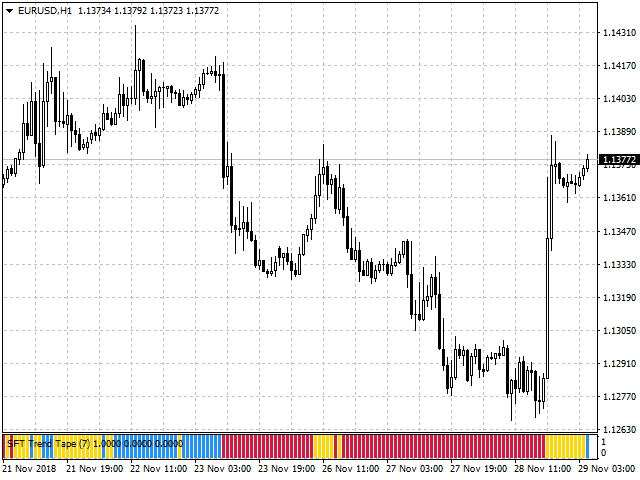
Dieser Indikator zeigt die allgemeine Richtung der Kursbewegung an und wird in der entsprechenden Farbe dargestellt.
Ermöglicht Ihnen den Handel mit Trends und Gegentrends
Funktioniert auf allen Zeitrahmen, für alle Währungspaare, Metalle und Kryptowährungen
Kann bei der Arbeit mit binären Optionen verwendet werden
Unverwechselbare Merkmale
- Wird nicht neu gezeichnet;
- Einfache und klare Einstellungen;
- Funktioniert auf allen Zeitrahmen und Symbolen;
- Geeignet für den Handel mit Währungen, Metallen, Optionen und Kryptowährungen (Bitcoin, Litecoin, Ethereum, etc.);
- Geeignet für den manuellen Handel und die Entwicklung von Expert Advisors;
Für genauere Eingaben und zusätzliche Bestätigung von Signalen kann er in Verbindung mit anderen Indikatoren verwendet werden.
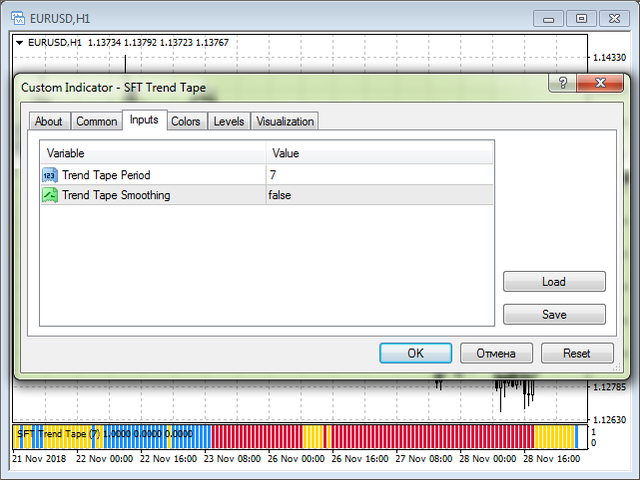
Einrichten des Indikators
- Trend Tape Period - die Periode der Indikatorberechnung, je kleiner die Zahl, desto empfindlicher;
- Trend Tape Smoothing - Glättungsmodus, für konservatives und langfristiges Handeln;
Handelsempfehlungen
- Wenn der Indikator rot dargestellt ist, wird nur eine Verkaufs- oder Verkaufsposition (für Optionen) zur Eröffnung in Betracht gezogen.
- Wenn der Indikator blau eingefärbt ist, werden nur Kauf- oder Call-Positionen (für Optionen) für die Eröffnung in Betracht gezogen.
- Wenn Sie den Indikator gelb färben, sollten Sie keine Positionen eröffnen.
- Die Richtung der Transaktion sollte mit der Trendrichtung auf einem höheren Zeitrahmen übereinstimmen.
- Gut bewährt in Zusammenarbeit mit dem Indikator SFT Fractal Support and Resistance
Es gibt noch weitere Optionen, im Laufe des Handels können Sie die für Sie günstigste Taktik entwickeln.
Weitere Informationen und einen detaillierten Überblick über die Handelsmethoden finden Sie hier:
Handelsstrategie mit dem Indikator SFT Trend Tape
Wir wünschen Ihnen einen stabilen und profitablen Handel.
Vielen Dank, dass Sie unsere Software nutzen.
Wenn Sie es mögen, dann tun Sie eine gute Tat und teilen Sie den Link mit Ihren Freunden.
Um die Veröffentlichung von neuen nützlichen Programmen für den Handel nicht zu verpassen - fügen Sie als Freund hinzu:SURE FOREX TRADING