SFT Full OsMA
- Indikatoren
-
Artem Kuzmin
 ALL PRODUCTS ▶️ https://www.mql5.com/ru/users/zombiezorrofx/seller
🔥 Maximum commission discounts:
💠 Binance 35% (trading bypassing sanctions) - Version: 1.0
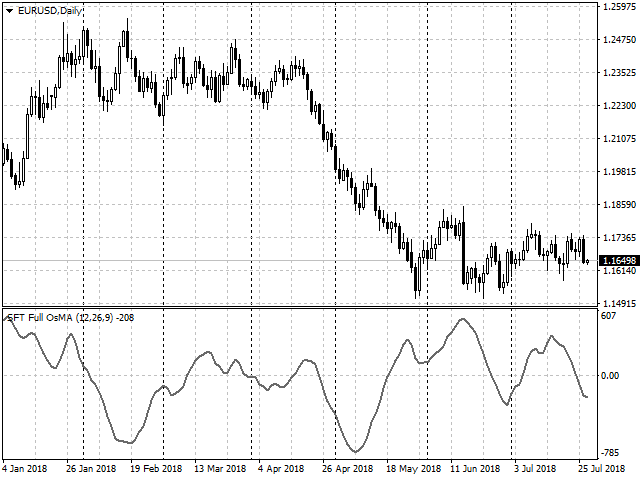
Ein klassischer Indikator mit erweiterten Funktionen für eine genauere Anzeige der Marktsituation.
Alle Einstellungen aller gleitenden Durchschnitte sind verfügbar, wie z.B. der Typ des gleitenden Durchschnitts und der Preis, der für seine Berechnung verwendet wird.
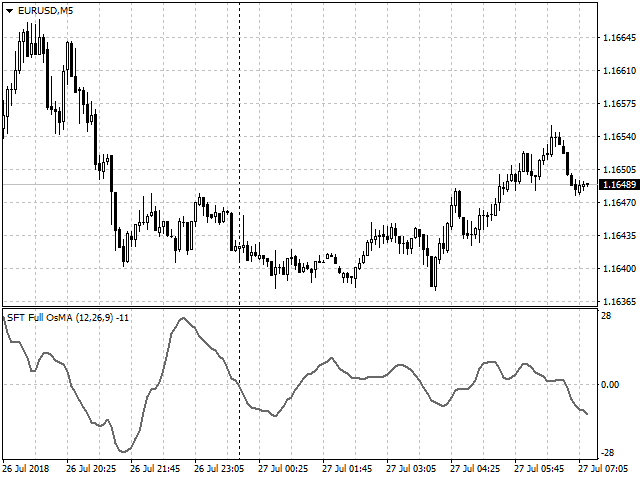
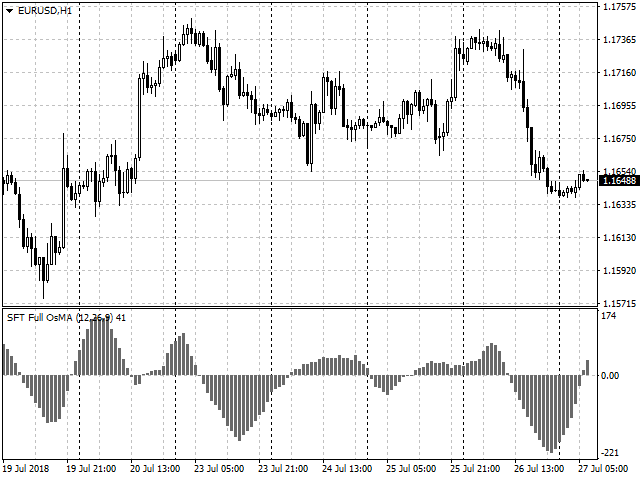
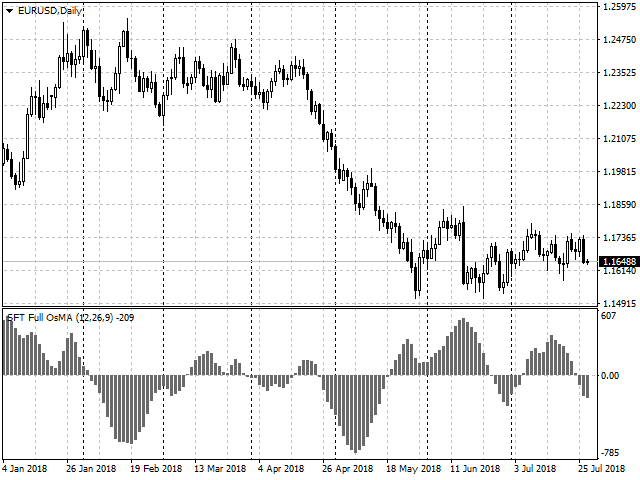
Es ist auch möglich, das Aussehen des Indikators zu ändern - Linie oder Histogramm.
Zusätzliche Parameter bieten die Möglichkeit der Feinabstimmung.
Besondere Merkmale
- Wird nicht neu gezeichnet.
- Zusätzliche Parameter für die Feinabstimmung.
- Anzeige als Linie oder als Histogramm.
- Funktioniert auf allen Zeitrahmen und Symbolen.
- Geeignet für den manuellen Handel und die Entwicklung von Expert Advisors.
Für genauere Eingaben und zusätzliche Bestätigung von Signalen kann er in Verbindung mit anderen Indikatoren verwendet werden.
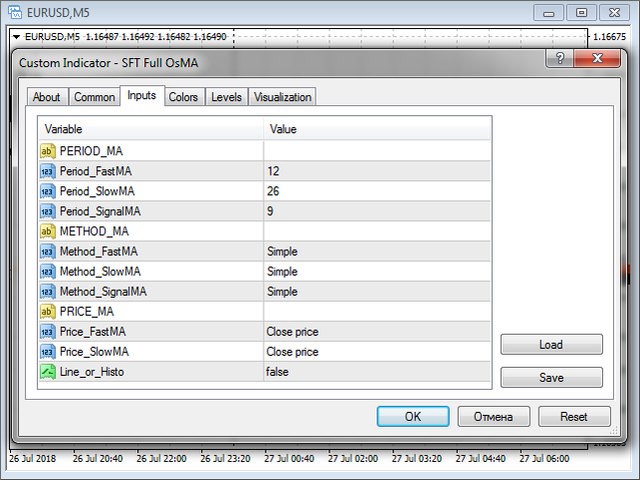
Einstellen des Indikators
- Periode_FastMA - Periode des schnellen gleitenden Durchschnitts.
- Periode_SlowMA - Periode des langsamen gleitenden Durchschnitts
- Periode_SignalMA - Periode des signalisierten gleitenden Durchschnitts.
- Methode_FastMA - Typ des schnellen gleitenden Durchschnitts.
- Methode_SlowMA - Art des langsamen gleitenden Durchschnitts.
- Methode_SignalMA - Typ des gleitenden Mittelwerts für Signale.
- Price_FastMA - Preis für das Plotten des schnellen gleitenden Durchschnitts.
- Price_SlowMA - Preis für die Darstellung des langsamen gleitenden Durchschnitts.
- Line_or_Histo - Anzeige des Indikators als Linie(true) oder als Histogramm(false).
Handelsempfehlungen
- Wenn das Histogramm (Linie) über Null liegt und die Highs steigen, liegt ein aufsteigender Trend im Markt vor.
- Wenn das Histogramm (Linie) unter Null liegt und die Tiefstwerte fallen, liegt ein Abwärtstrend im Markt vor.
- Das Auftreten von lokalen Tiefs und Hochs auf dem Histogramm deutet darauf hin, dass der Kurs sich umkehren oder eine Korrektur einleiten könnte.
- Ein Verkaufssignal entsteht, wenn das Histogramm (Linie) die Nulllinie nach unten kreuzt, und ein Kaufsignal, wenn es nach oben zeigt.
- Die klassischen Signale der Divergenz zwischen dem Indikator und dem Kurschart dienen als zusätzliche Bestätigungssignale.
- Die Handelsrichtung sollte mit der Trendrichtung auf einem höheren Zeitrahmen übereinstimmen.
- Beenden Sie den Handel bei einem Umkehrsignal oder bei den festgelegten SL- und TP-Levels.
- Wenn Sie SL und TP verwenden, setzen Sie SL über das nächstgelegene Extremum hinaus, TP = 1..2 SL.
Andere Handelsoptionen sind ebenfalls möglich, Sie können die für Sie günstigste Taktik im Laufe des Handels entwickeln.
Zusätzliche Informationen und eine detailliertere Übersicht über die Handelsmethoden finden Sie hier:
Wir wünschen Ihnen einen stabilen und profitablen Handel.
Vielen Dank, dass Sie unsere Software nutzen.
Wenn es Ihnen gefällt, teilen Sie einen Link mit Ihren Freunden.
Um die Veröffentlichung von neuen nützlichen Handelsprogrammen nicht zu verpassen, fügen Sie SURE FOREX TRADING zur Freundesliste hinzu


Der Benutzer hat keinen Kommentar hinterlassen