Any chart overbought and oversold
- Indikatoren
-
Artem Kuzmin
 ALL PRODUCTS ▶️ https://www.mql5.com/ru/users/zombiezorrofx/seller
🔥 Maximum commission discounts:
💠 Binance 35% (trading bypassing sanctions) - Version: 1.1
- Aktualisiert: 27 April 2022
- Aktivierungen: 5
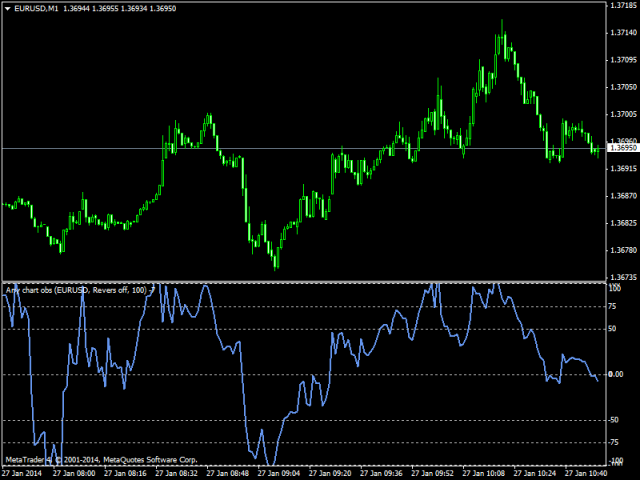
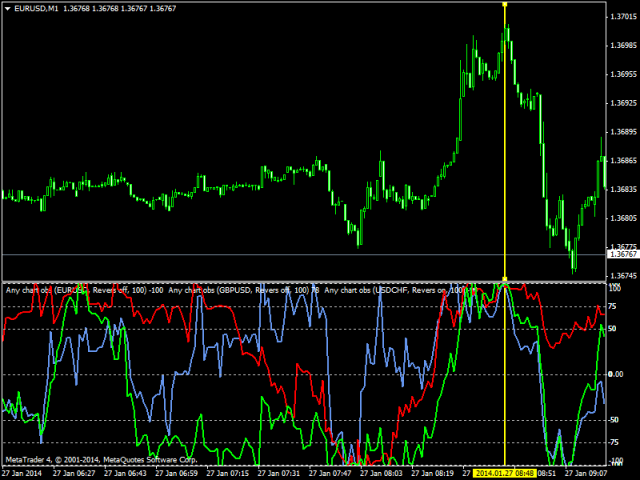
Multiwährungsindikator Jedes Diagramm obs ist ein Preisdiagramm mit einer prozentualen Skala.
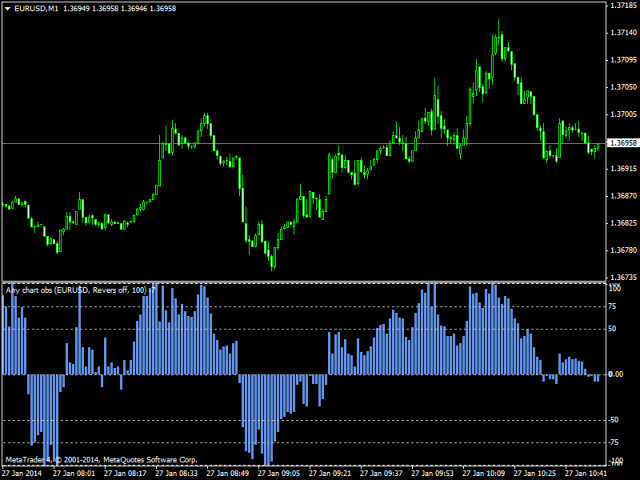
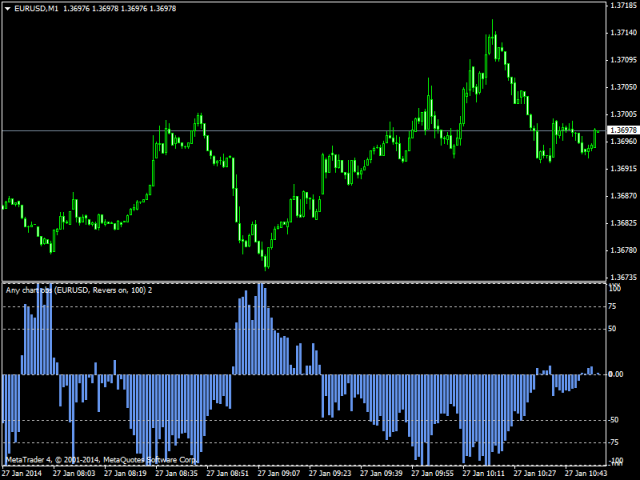
Kann als Linie und als Histogramm angezeigt werden. Es ist auch eine Umkehrfunktion verfügbar, die den Chart spiegelt. Der Name des anzuzeigenden Instruments wird in den Eingabeparametern angegeben, standardmäßig wird das aktuelle Symbol verwendet.
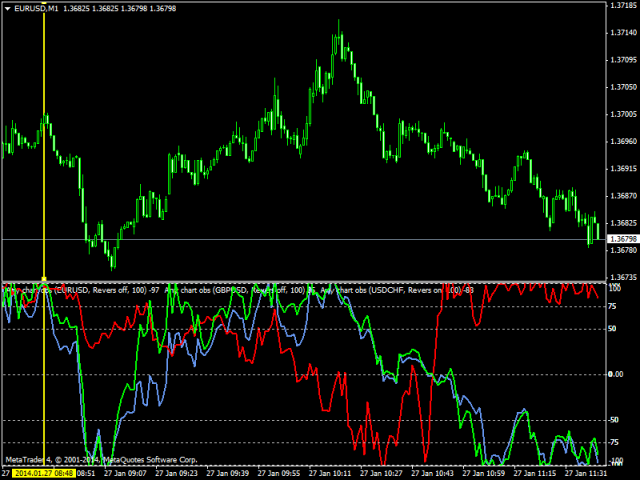
Der Indikator hat keine Lags, da er nicht mit Formeln geglättet wird, sondern an eine prozentuale Skala gebunden ist, was es erlaubt, das Preisgleichgewicht, den überkauften und überverkauften Zustand zu erkennen. Der Indikator kann verwendet werden, um den Beginn und die Richtung eines Trends/eines Flats zu bestimmen. Er ist auch nützlich, um die Bewegung mehrerer Paare gleichzeitig in einem einzigen Fenster zu analysieren, wenn man den gepaarten Handel und andere Methoden verwendet.
Die Charts können je nach der Korrelation der analysierten Instrumente auf den Kopf gestellt werden.
Ein weiteres Merkmal dieses Indikators ist, dass die Linien der Instrumente (bei der Analyse mehrerer Instrumente in einem einzigen Fenster) beim Scrollen des Charts nicht neu gezeichnet werden.