Force overbought and oversold
- Indikatoren
-
Artem Kuzmin
 ALL PRODUCTS ▶️ https://www.mql5.com/ru/users/zombiezorrofx/seller
🔥 Maximum commission discounts:
💠 Binance 35% (trading bypassing sanctions) - Version: 1.1
- Aktualisiert: 3 Mai 2022
- Aktivierungen: 5
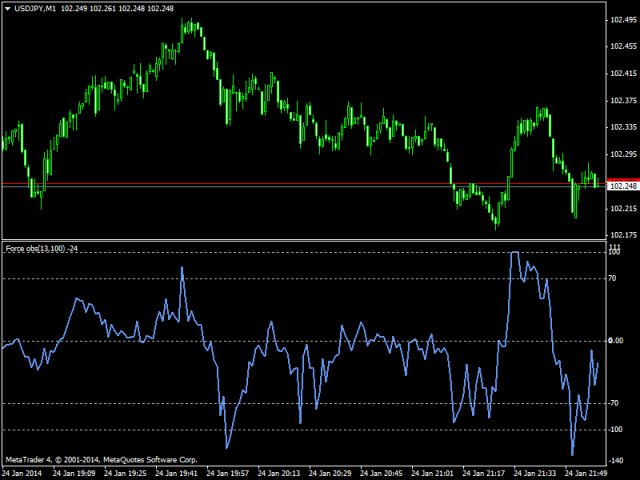
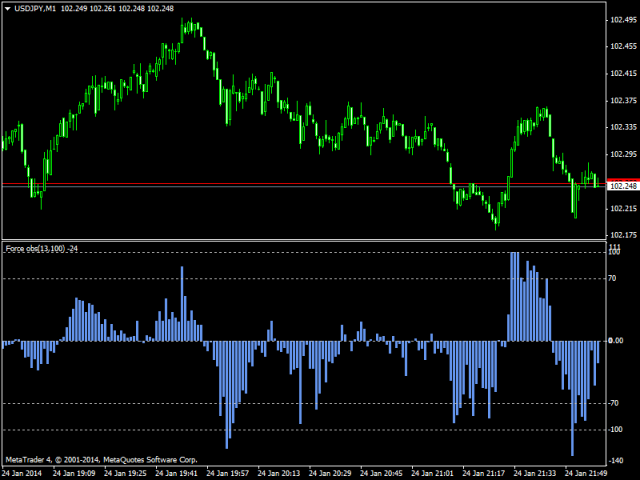
Der Force Index Indikator mit überkauften und überverkauften Zonen.
Zwei Anzeigeoptionen - als Linie und als Histogramm.
Eine Reihe von OBS-Indikatoren (overbought and oversold) - das sind Indikatoren, die mit überkauften und überverkauften Zonen erweitert wurden.
Einstellungen
- OBS-Periode - Berechnungszeitraum für Überkauft/Überverkauft
- Force Period - Zeitraum der Force
- Preis MA - Preise für die MA-Berechnung
- Methode MA - MA-Berechnungsmethode
- Linie oder Histo - Anzeige durch Linie oder Histogramm