PZ Trend Trading
- Indikatoren
- Version: 7.0
- Aktualisiert: 19 Juli 2024
- Aktivierungen: 20

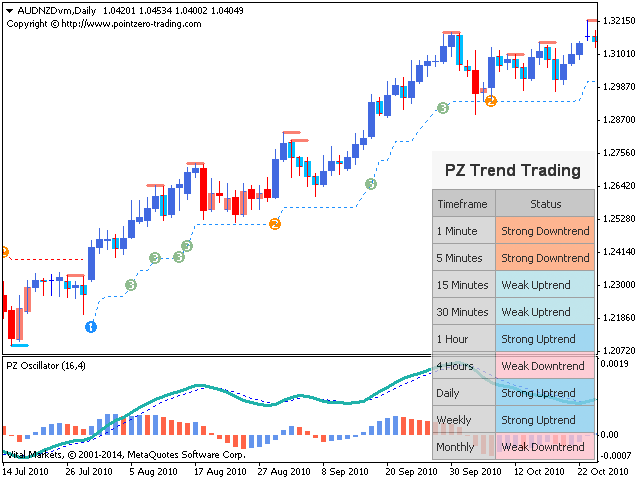
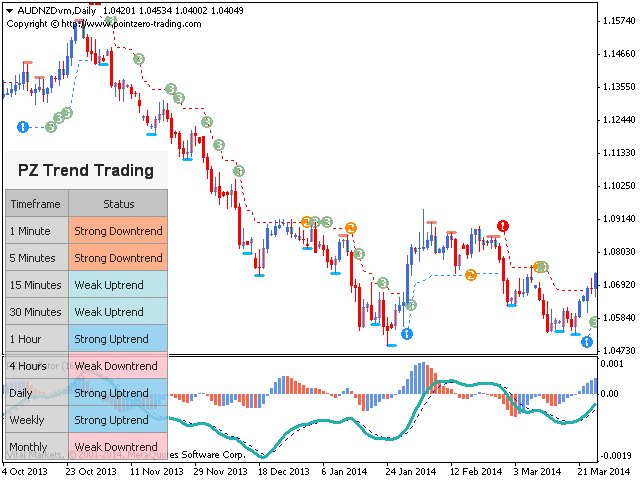
Trend Trading ist ein Indikator, der so weit wie möglich von den Markttrends profitiert, indem er Pullbacks und Breakouts zeitlich festlegt. Sie findet Handelsmöglichkeiten, indem sie analysiert, was der Preis während etablierter Trends tut.
[ Installationsanleitung | Update-Anleitung | Fehlerbehebung | FAQ | Alle Produkte ]
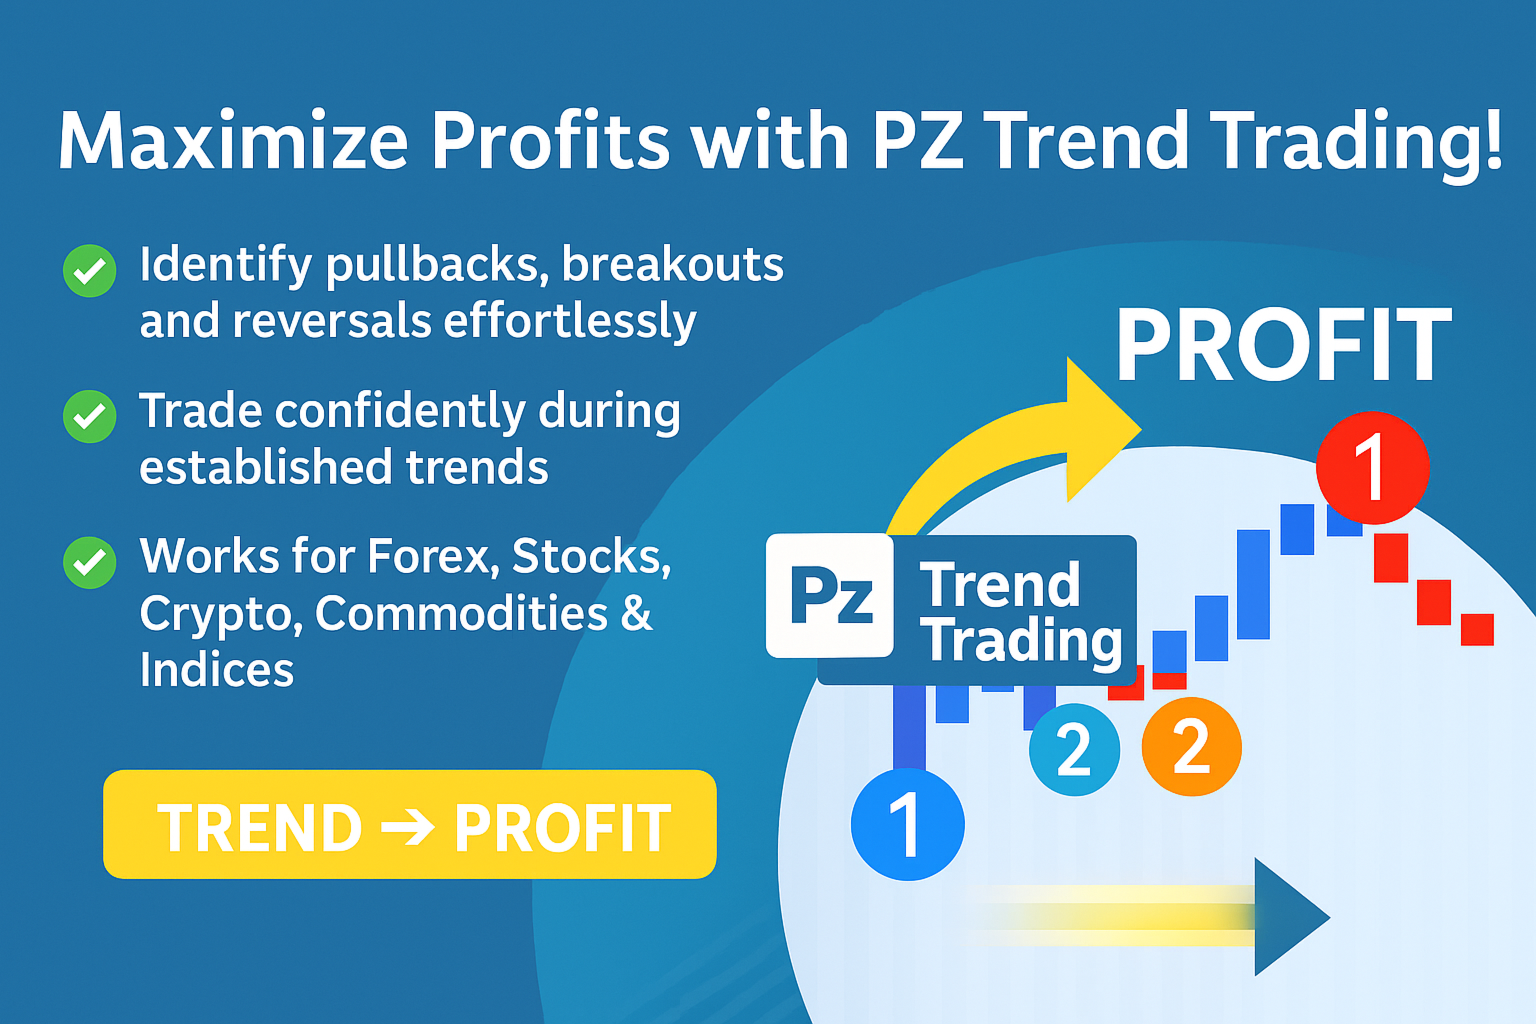
- Handeln Sie mit Zuversicht und Effizienz an den Finanzmärkten
- Profitieren Sie von etablierten Trends, ohne ins Wanken zu geraten
- Profitable Pullbacks, Ausbrüche und vorzeitige Wertaufholungen erkennen
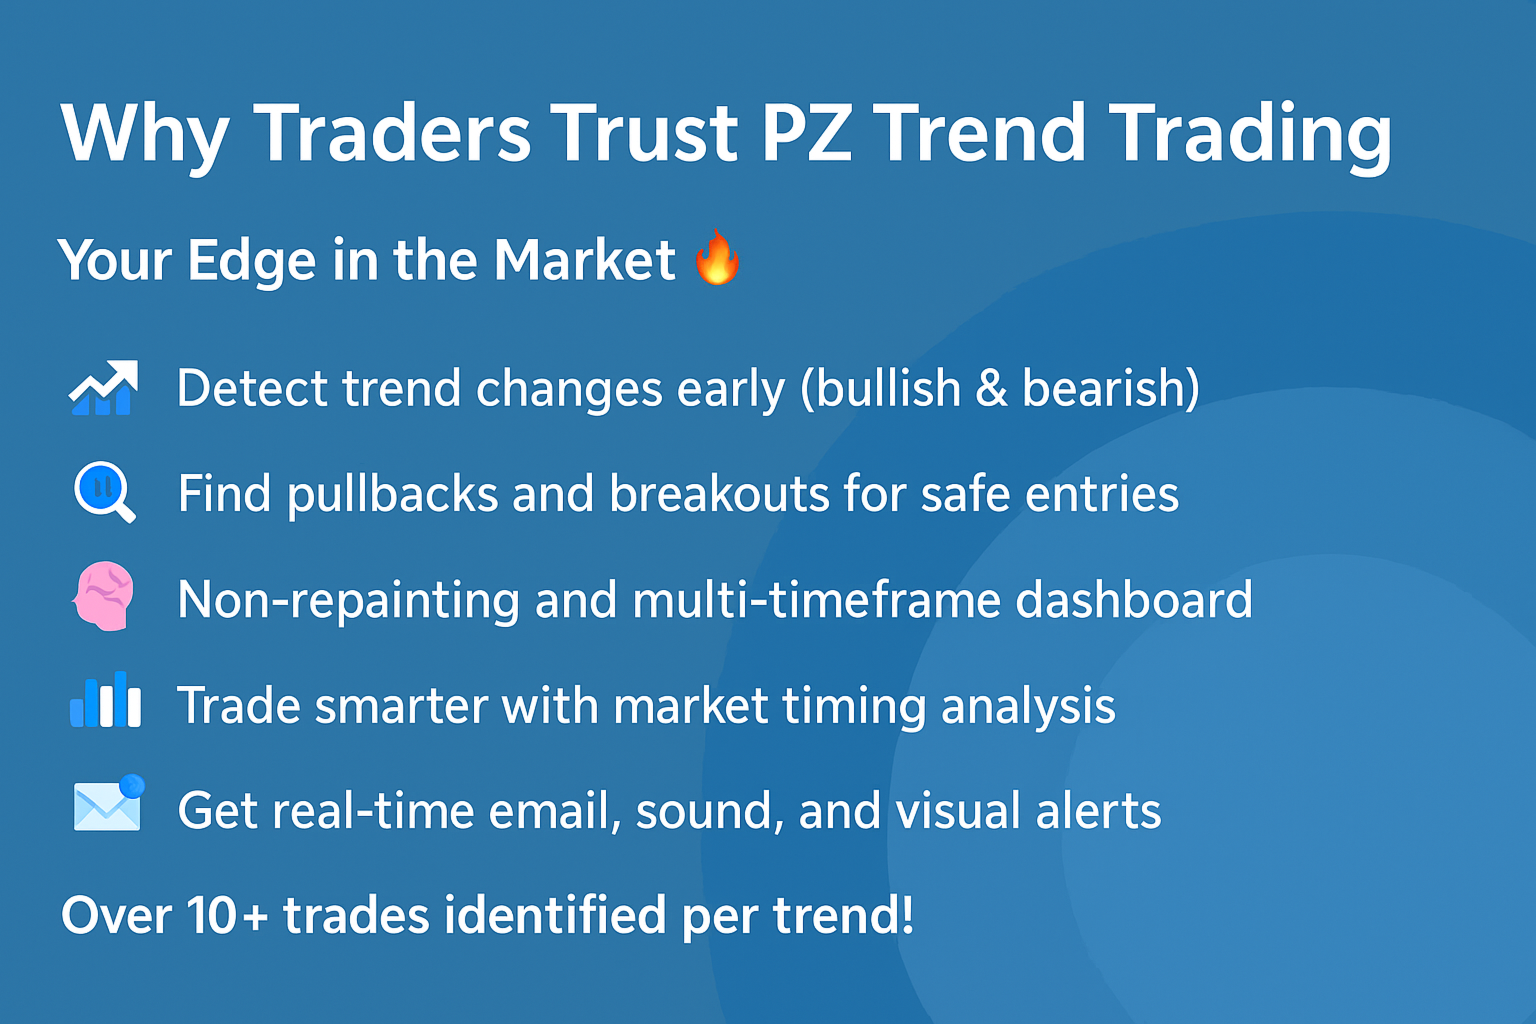
- Der Indikator analysiert seine eigene Qualität und Leistung
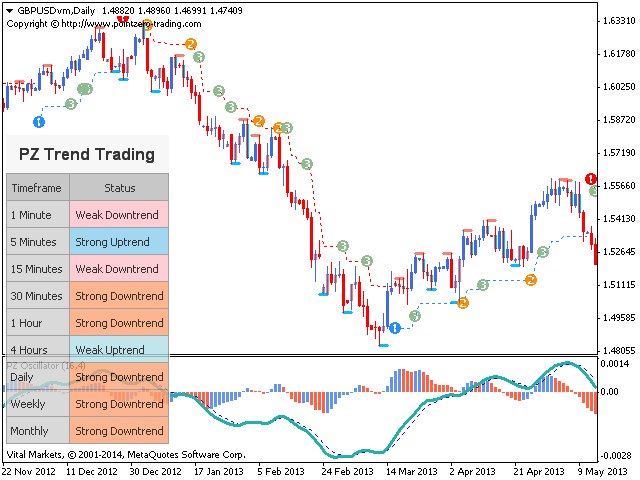
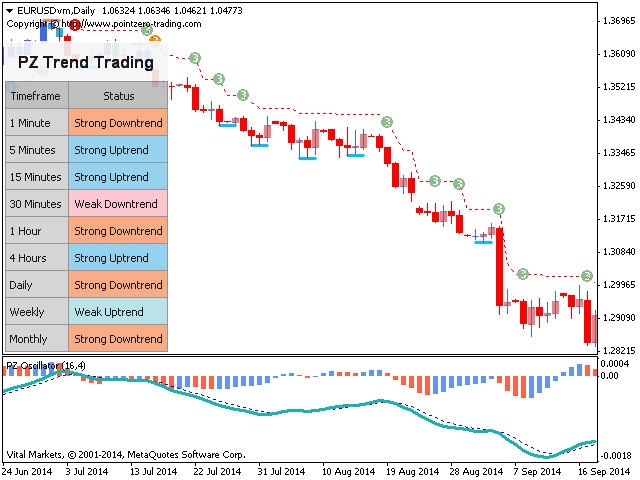
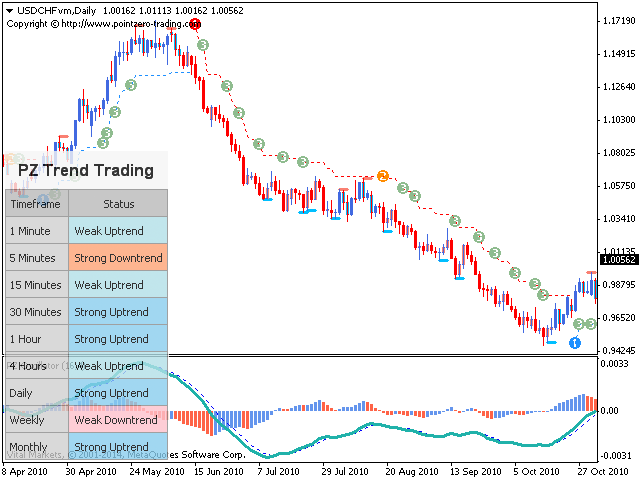
- Es implementiert ein Dashboard mit mehreren Zeitrahmen
- Der Indikator ist nicht neu lackiert
- Es implementiert E-Mail / Sound / visuelle Warnungen
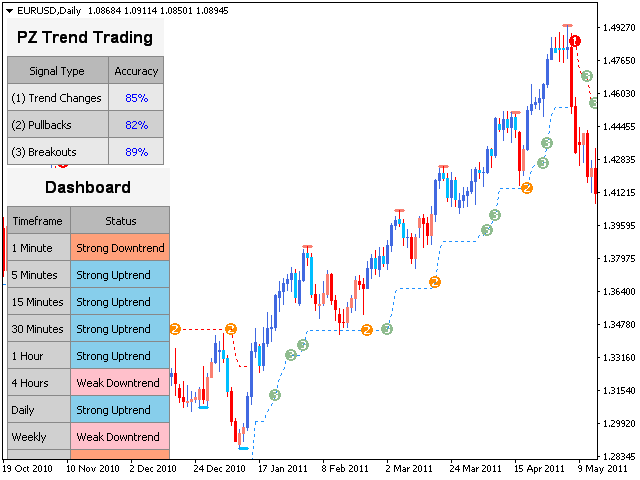
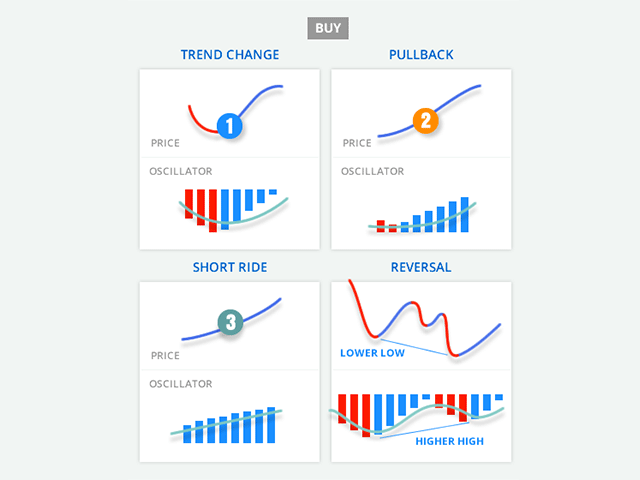
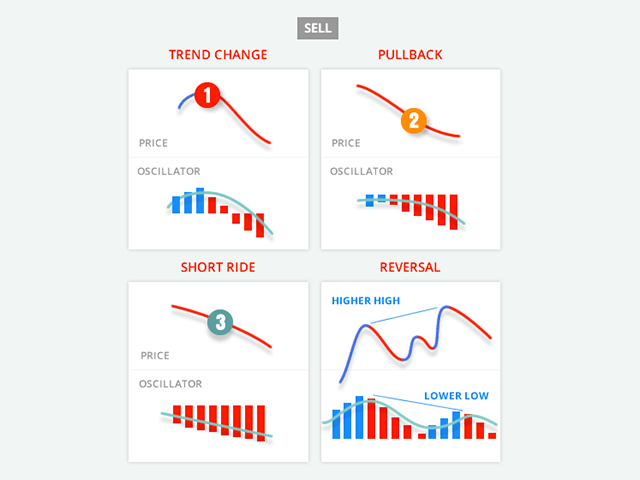
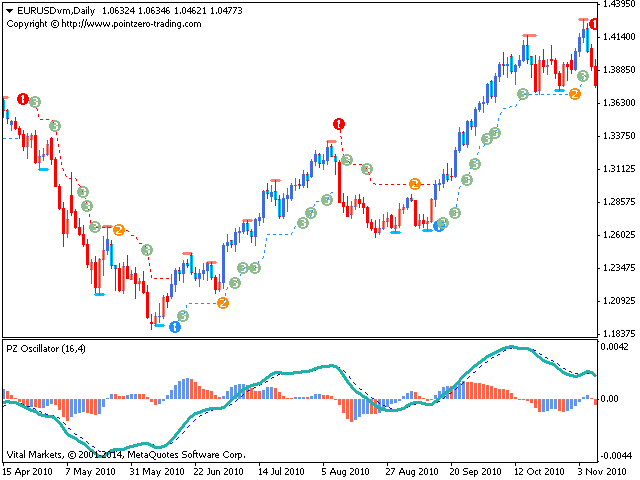
Etablierte Trends bieten Dutzende von Handelsmöglichkeiten, die meisten Trendindikatoren vernachlässigen sie jedoch vollständig. Die Interpretation des Indikators ist ziemlich einfach:
- (1) ist eine Trendänderung
- (2) ist ein Rückzug in Richtung des Trends
- (3) ist ein Ausbruch in Richtung des Trends
- Ein roter Strich ist eine Korrektur während eines Abwärtstrends
- Ein blauer Strich ist eine Korrektur während eines Aufwärtstrends
- Blaue Balken sind ein bullischer Subtrend
- Rote Balken sind ein bärischer Subtrend
Eingabeparameter
- Indikatorperiode: Dieser Parameter steuert die Empfindlichkeit gegenüber Trendänderungen. Eine große Periode wird dazu führen, dass längere Trends erfasst werden. Eine kurze Zeitspanne führt dazu, dass kürzere Trends erfasst werden, aber Trendänderungen schneller erkannt werden.
- Sub-Trend anzeigen: Aktivieren Sie diesen Parameter, um den Sub-Trend in der Farbe der Preisbalken anzuzeigen.
- Pullbacks anzeigen: Aktivieren Sie diesen Parameter, um Pullbacks anzuzeigen, die als (2) Objekte im Diagramm angezeigt werden.
- Ausbrüche anzeigen: Aktivieren Sie diesen Parameter, um Ausbrüche in Richtung des Trends anzuzeigen, die als (3) Objekte angezeigt werden.
- Anzeigekorrekturen: Aktivieren Sie diesen Parameter, um Trendkorrekturen anzuzeigen, die als farbige Striche angezeigt werden.
- Max. Verlaufsbalken: Dieser Parameter steuert, wie viele vergangene Balken beim Laden des Indikators überprüft werden.
- Anzeigen des Dashboards: Aktivieren Sie diesen Parameter, um das Dashboard für mehrere Zeiträume im Diagramm anzuzeigen.
- Statistiken anzeigen: Aktivieren Sie diesen Parameter, um das Statistik-Dashboard im Diagramm anzuzeigen.
- Zeichnungseinstellungen: Wählen Sie die Farbe und Breite der im Diagramm angezeigten Korrekturlinien.
- Warnungen: Aktivieren Sie Anzeige- / E-Mail- / Push- / Sound-Warnungen für alle oben aktivierten Handelskonfigurationen.
Support und Fragen
Nutzen Sie den Helpdesk für Fragen oder zeitnahen Support. Schreiben Sie eine E-Mail an: help@pointzero-trading.com Autor
Arturo López Pérez, privater Investor und Spekulant, Softwareentwickler und Gründer von Point Zero Trading Solutions.


This is a great indicator. I love it.