Good Filtr
- Indikatoren
-
Artem Kuzmin
 ALL PRODUCTS ▶️ https://www.mql5.com/ru/users/zombiezorrofx/seller
🔥 Maximum commission discounts:
💠 Binance 35% (trading bypassing sanctions) - Version: 1.1
- Aktualisiert: 20 April 2022
- Aktivierungen: 5
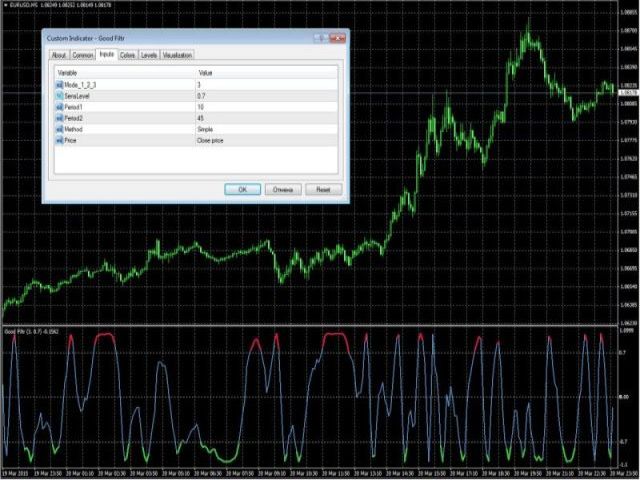
Dies ist ein Indikator für zusätzliche Signalfilterung.
Er kann als zusätzlicher Filter in einem Handelssystem verwendet werden.
Der Indikator zeichnet seine Daten nicht neu und kann sowohl im Forex-Handel als auch mit binären Optionen verwendet werden.
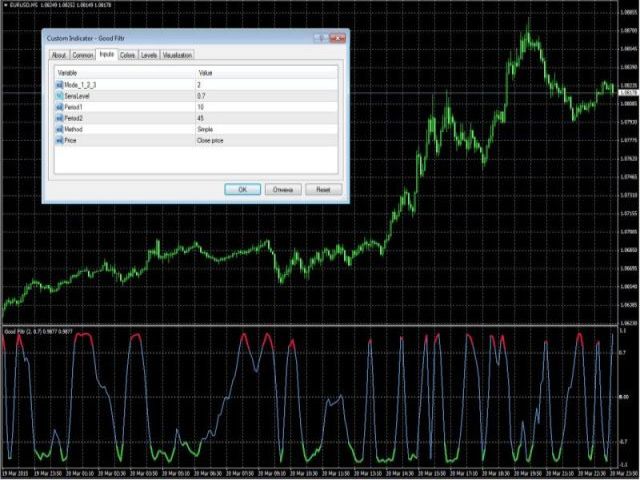
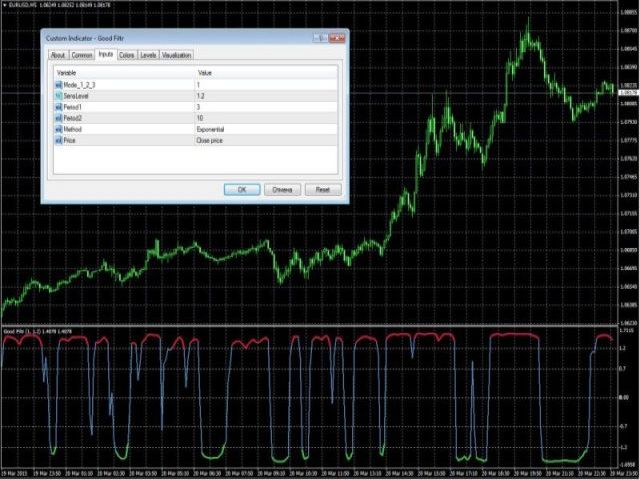
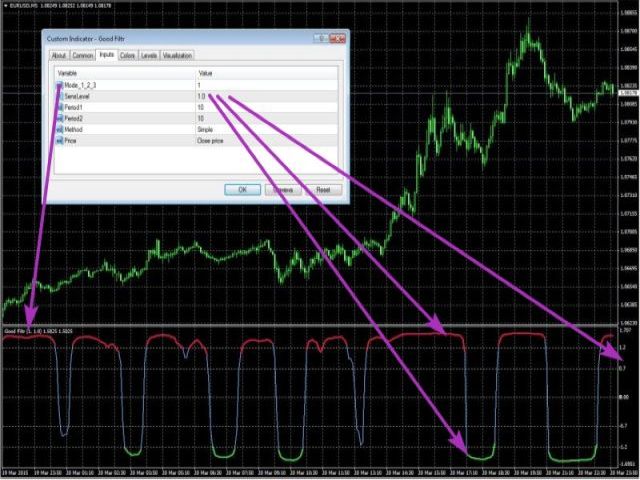
Er verfügt über 3 Betriebsmodi und flexible Empfindlichkeitseinstellungen.
Der Indikator verwendet mehrere Puffer, daher kann er problemlos in verschiedenen Expert Advisors verwendet werden.