SFT Go Trend
- Indikatoren
-
Artem Kuzmin
 ALL PRODUCTS ▶️ https://www.mql5.com/ru/users/zombiezorrofx/seller
🔥 Maximum commission discounts:
💠 Binance 35% (trading bypassing sanctions) - Version: 1.0
- Aktivierungen: 5
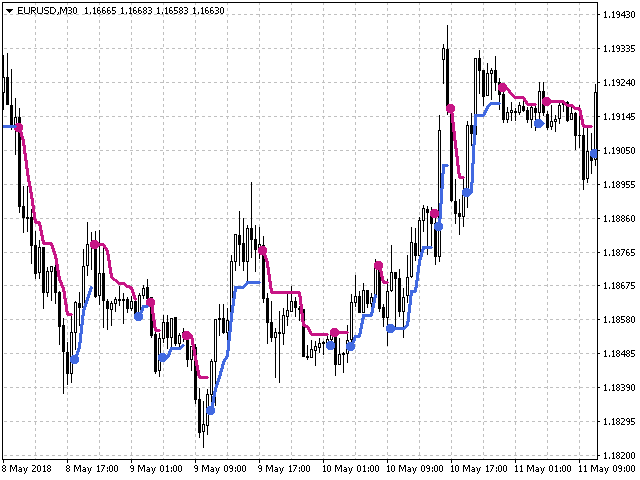
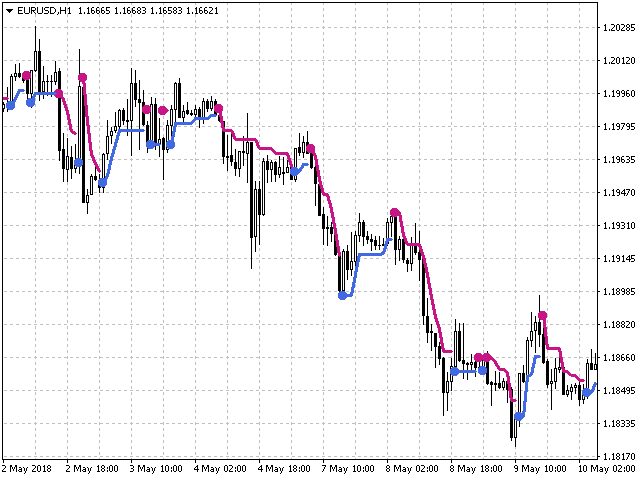
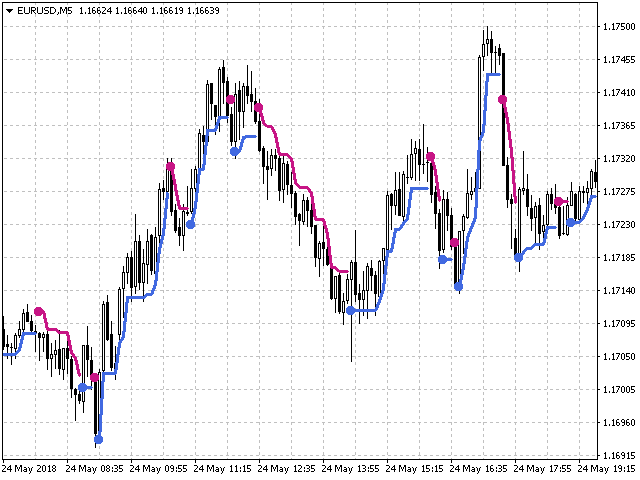
Die Eröffnung von Positionen in Trendrichtung ist eine der gängigsten Handelstaktiken.
Der Grundgedanke ist, dass die Wahrscheinlichkeit einer Trendfortsetzung höher ist als die einer Trendwende.
Dieser Indikator bestimmt die Richtung einer lokalen Bewegung, indem er den Beginn eines Trends mit einem großen Punkt und seine Fortsetzung mit einer Linie in der entsprechenden Farbe kennzeichnet.
Unterscheidungsmerkmale
- Kein Neuanstrich.
- Einfache und genaue Einstellungen.
- Klare und verständliche Signale.
- Funktioniert auf allen Zeitrahmen und Symbolen.
- Geeignet für den manuellen Handel und die Entwicklung von Expert Advisors.
Für genauere Eingaben und zusätzliche Bestätigung von Signalen kann er in Verbindung mit anderen Indikatoren verwendet werden.
Einrichten des Indikators
- Sensitivität - Empfindlichkeit der Trenderkennung;
- DeepBars - die Anzahl der Kerzen (Balken), die der Indikator zur Berechnung seiner Werte benötigt.
Handelsempfehlungen
- Eröffnen Sie Geschäfte, wenn der Signalpunkt nach dem Schließen einer Kerze erscheint.
- Die Richtung des Deals sollte der Richtung des Trends auf den höheren Zeitskalen entsprechen
- Schließen Sie das Geschäft durch ein entgegengesetztes Signal oder durch die festgelegten SL- und TP-Niveaus
- Wenn Sie SL und TP verwenden, setzen Sie SL über das nächstgelegene Extremum hinaus, TP = 1..2 SL
Andere Handelsoptionen sind ebenfalls möglich, Sie können die für Sie günstigste Taktik im Laufe des Handels entwickeln.
Weitere Informationen und eine genauere Übersicht über die Handelsmethoden finden Sie hier:
Wir wünschen Ihnen einen stabilen und profitablen Handel.
Vielen Dank, dass Sie unsere Software nutzen.
Wenn es Ihnen gefällt, teilen Sie einen Link mit Ihren Freunden.
Um die Veröffentlichung neuer nützlicher Handelsprogramme nicht zu verpassen, fügen Sie SURE FOREX TRADING zu Ihrer Freundesliste hinzu.