Pair chart nrp obs
- Indikatoren
-
Artem Kuzmin
 ALL PRODUCTS ▶️ https://www.mql5.com/ru/users/zombiezorrofx/seller
🔥 Maximum commission discounts:
💠 Binance 35% (trading bypassing sanctions) - Version: 1.1
- Aktualisiert: 25 April 2022
- Aktivierungen: 5
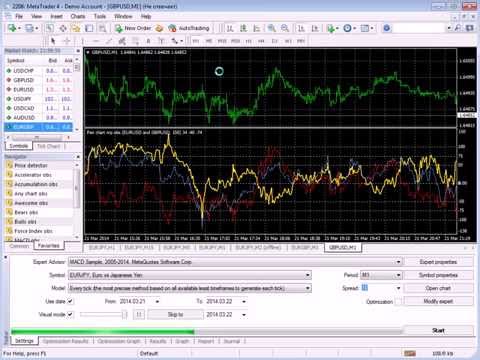
Der Indikator basiert auf Methoden des Paarhandels. Er wird im Gegensatz zu ähnlichen Indikatoren nicht neu gezeichnet.
Zeigt die Korrelation zwischen zwei ausgewählten Instrumenten in Prozent für einen vorher festgelegten Zeitraum und die Positionen der Instrumente im Verhältnis zueinander.
Verfügt über eine Funktion zur umgekehrten Anzeige eines der analysierten Symbole - für Instrumente mit negativer Korrelation.
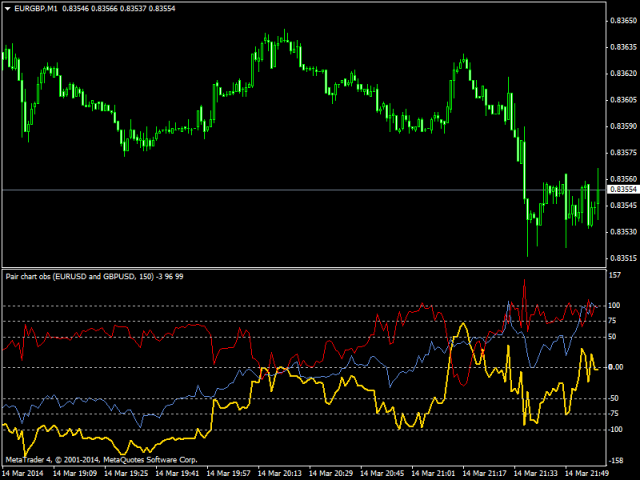
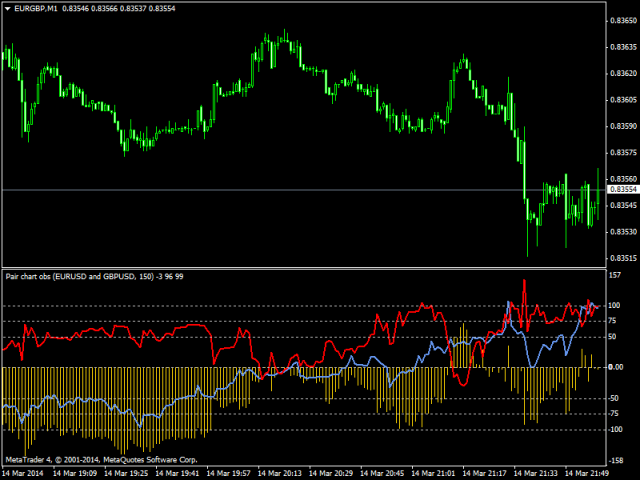
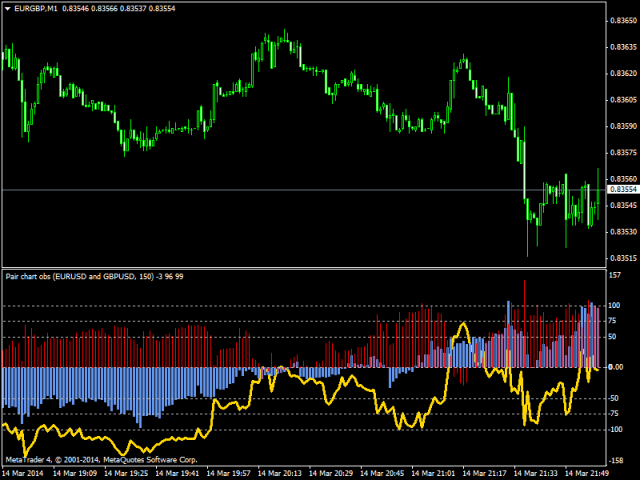
Kann als Linie oder als Histogramm gezeichnet werden.
Einstellungen:
- Symb1 - Name des ersten Symbols.
- Revers1 - umgekehrte Darstellung des ersten Symbols.
- Symb2 - Name des zweiten Symbols.
- Revers2 - Umgekehrte Darstellung des zweiten Symbols.
- ExtPeriod - Berechnungszeitraum in Takten.
- Pair_Line_or_Histo - zeigt das Korrelationsdiagramm als Linie oder als Histogramm an.
- Symb_Line_or_Histo - zeigt Preisdiagramme als Linie oder Histogramm an.