Moving Average fullshift
- Indikatoren
-
Artem Kuzmin
 ALL PRODUCTS ▶️ https://www.mql5.com/ru/users/zombiezorrofx/seller
🔥 Maximum commission discounts:
💠 Binance 35% (trading bypassing sanctions) - Version: 1.1
- Aktualisiert: 12 April 2022
- Aktivierungen: 5
Dies ist ein gleitender Durchschnitt, der sich nicht nur nach rechts/links, sondern auch nach oben/unten bewegen kann.
Sie können auch einen Modus für die Anzeige des Indikators (als Linie oder als Punkte) und alle anderen Einstellungen eines gleitenden Durchschnitts wählen.
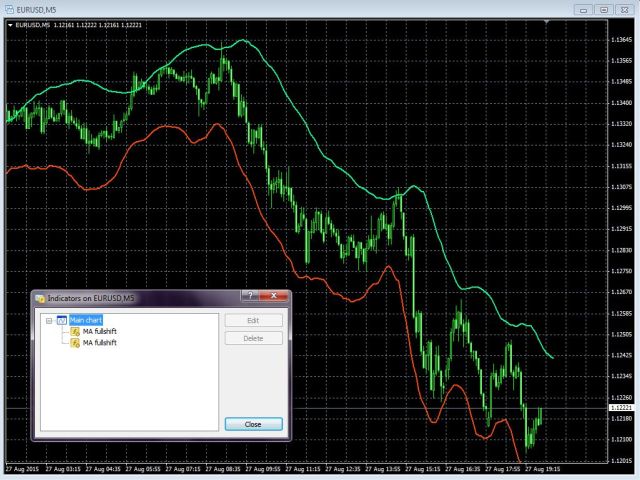
Wenn Sie mehrere Indikatoren in einem Fenster überlagern, können Sie die Preiskanäle deutlicher bestimmen, indem Sie jede Grenze einzeln einstellen.
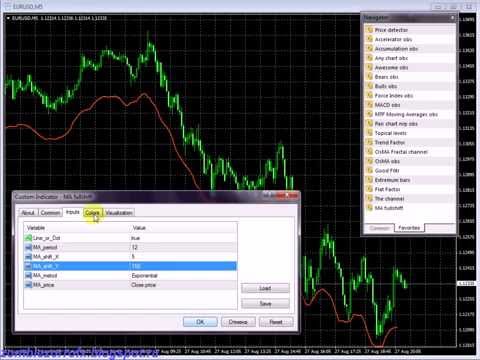
Einstellungen
- Line_or_Dot - Modus der Anzeige des Indikators: true - als Linie, false - als Punkte;
- MA_period - Periode des gleitenden Durchschnitts;
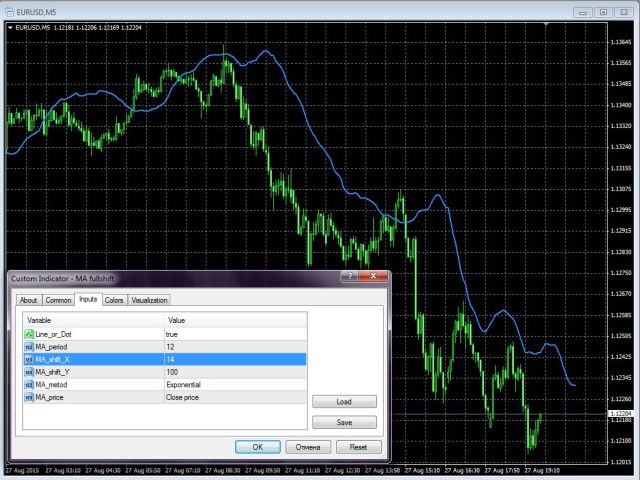
- MA_shift_X - Anzahl der Kerzen, um den Indikator auf der X-Achse zu verschieben (+1,2,3... - rechts, -1,2,3... - links);
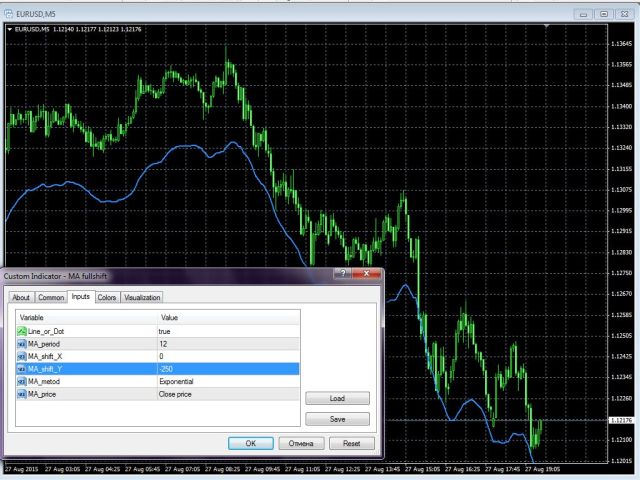
- MA_shift_Y - Anzahl der Punkte, um den Indikator auf der Y-Achse zu verschieben (+1,2,3... - nach oben, -1,2,3... - nach unten);
- MA_metod - Methode zur Berechnung des gleitenden Durchschnitts (alle im MetaTrader integrierten Standardmethoden);
- MA_price - Preise zur Berechnung des gleitenden Durchschnitts (alle im MetaTrader enthaltenen Standardpreise).