SFT Trading Oscillator
- Indikatoren
- Artem Kuzmin
- Version: 1.0
- Aktivierungen: 5
Der Indikator hilft, mögliche Rückschläge und Umkehrungen zu erkennen.
Zeigt die Richtung der Kursbewegung an und wird in der entsprechenden Farbe dargestellt.
Erlaubt Ihnen, Trend- und Gegentrendhandel zu betreiben.
Funktioniert auf allen Zeitskalen, bei allen Währungspaaren, Metallen und Kryptowährungen
Kann bei der Arbeit mit binären Optionen verwendet werden
Unverwechselbare Merkmale
- Wird nicht neu gezeichnet;
- Einfache und klare Einstellungen;
- Funktioniert auf allen Zeitfenstern und mit allen Symbolen;
- Geeignet für den Handel mit Währungen, Metallen, Optionen und Kryptowährungen (Bitcoin, Litecoin, Ethereum, etc.);
- Geeignet für den manuellen Handel und für die Entwicklung von Beratern;
Für genauere Eingaben und zusätzliche Bestätigungssignale kann er in Verbindung mit anderen Indikatoren verwendet werden.
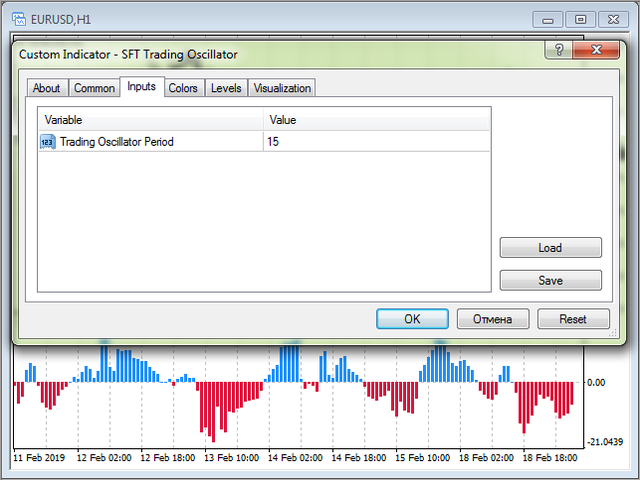
Einstellungen des Indikators
- Trading Oscillator Period - Berechnungszeitraum des Indikators;
Handelsempfehlungen
- Wenn die Nulllinie überschritten wird und der Indikator rot gefärbt ist, wird nur eine Verkaufs- oder Verkaufsposition zur Eröffnung in Betracht gezogen (für Optionen)
- Wenn die Nulllinie überschritten wird und der Indikator blau gefärbt ist, kann nur eine Kauf- oder Call-Position eröffnet werden (für Optionen).
- Die Handelsrichtung sollte mit der Trendrichtung in einem höheren Zeitrahmen übereinstimmen.
- Gut bewährt im Zusammenspiel mit demSFT Buy Sell Pendulum Indikator
Es gibt noch weitere Optionen, im Laufe des Handels können Sie die für Sie günstigste Taktik entwickeln.
Weitere Informationen und einen detaillierten Überblick über die Handelsmethoden finden Sie hier:
Handelsstrategie mit SFT Trading Oszillator
Wir wünschen Ihnen einen stabilen und profitablen Handel.
Vielen Dank, dass Sie unsere Software nutzen.
Wenn Sie es mögen, dann tun Sie eine gute Tat und teilen Sie den Link mit Ihren Freunden.
Um die Veröffentlichung von neuen nützlichen Programmen für den Handel nicht zu verpassen - fügen Sie als Freund hinzu:SURE FOREX TRADING


Der Benutzer hat keinen Kommentar hinterlassen