Time And Sales Layout
- Indikatoren
-
Stanislav Korotky
 Trading is just my hobby. I'm working in IT industry. So developement of experts, indicators, and script is not a problem at all to me. Wide range of technologies are used: MQL4, MQL5, system and applied programming, web-services, neural networks and more.
New: - Version: 1.2
- Aktualisiert: 18 April 2020
- Aktivierungen: 5
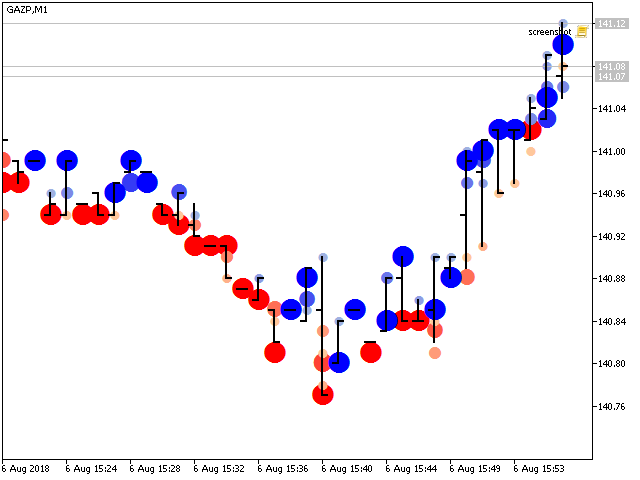
Der Indikator Time And Sales Layout zeigt das gehandelte Kauf- und Verkaufsvolumen direkt im Diagramm an. Er bietet eine grafische Darstellung der wichtigsten Ereignisse in der Zeit- und Umsatztabelle.
Der Indikator lädt eine Historie echter Handels-Ticks herunter und verarbeitet sie. Je nach gewählter Tiefe der Historie kann dieser Prozess einige Zeit in Anspruch nehmen. Während der Verarbeitung der Historie zeigt der Indikator einen Kommentar mit dem Fortschritt in Prozent an.
Wenn die Historie verarbeitet ist, beginnt der Indikator mit der Analyse der Ticks in Echtzeit. Die Daten des letzten Balkens werden aktualisiert.
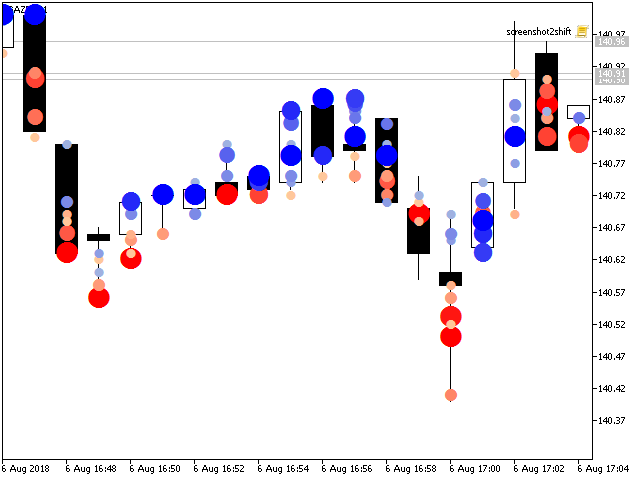
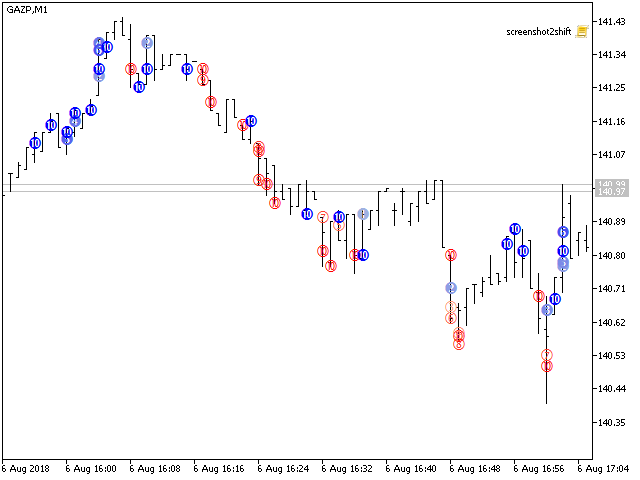
Der Indikator zeigt farbige Markierungen an, wo die größten Volumina gehandelt wurden, und zwar für Käufe und Verkäufe getrennt.
Der Indikator ist in erster Linie für den Intraday-Einsatz gedacht, empfohlen werden Zeitrahmen im Minutenbereich.
Parameter
- ShowHistoryFrom - ein Datum zum Starten der Tick-History-Analyse, standardmäßig - 0, was den letzten Tag bedeutet; bitte beachten Sie, dass 0 für den Datentyp Datetime im MetaTrader UI als 1970.01.01 00:00:00 angezeigt wird;
- Threshold - minimales Volumen eines einzelnen Trades, das berücksichtigt werden soll; verwenden Sie diesen Parameter, um kleine Trades herauszufiltern und nur große anzuzeigen;
- CharCode - ein Zeichencode für die Anzeige der Indikatormarken; er kann ein beliebiges Symbol aus der Wingdings-Schriftart oder -1 sein; standardmäßig -1, was bedeutet, dass numerische Aufzählungszeichen mit Werten von 1 bis 10 angezeigt werden, die die relative Größe des Volumens angeben;
- CharSize - definiert die Größe der Markierungen ("Breite" der Indikatorpuffer); standardmäßig -1 (was bedeutet, dass die Größen proportional zum Volumen variieren), kann ein Wert von 1 bis 5 sein;
- ColorPositive, ColorPositiveSmall - Farbverlauf für Kaufvolumen;
- ColorNegative, ColorNegativeSmall - Farbverlauf für Verkaufsvolumina;