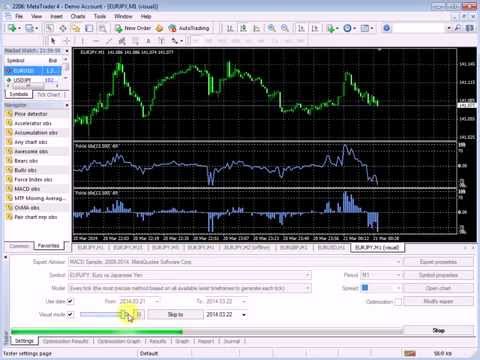
Force overbought and oversold

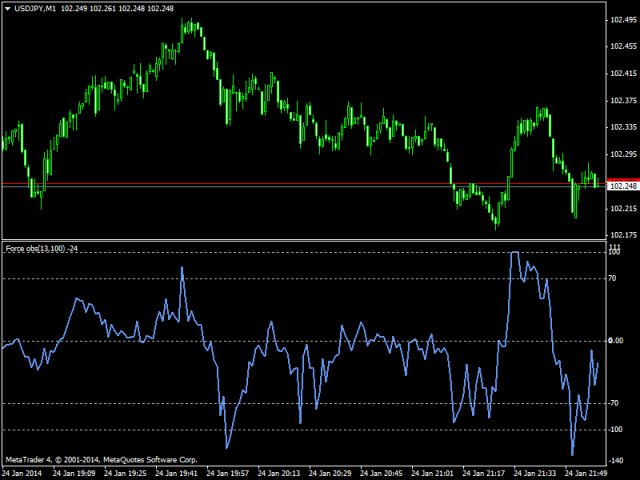
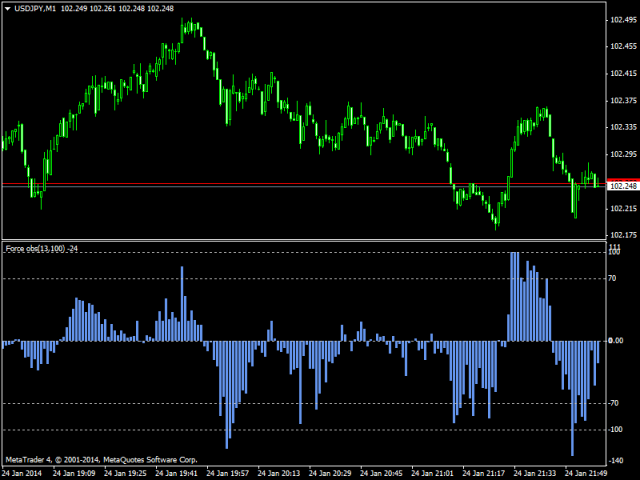
The Force Index indicator with overbought and oversold zones.

Two display options - as a line and as a histogram. 

A series of OBS indicators (overbought and oversold) - these are indicators enhanced with overbought and oversold zones.

Settings

  • OBS Period - overbought/oversold calculation period
  • Force Period - period of Force
  • Price MA - prices for MA calculation
  • Method MA - MA calculation method
  • Line or Histo - display by line or histogram
Prodotti consigliati
GeoWprPro
Georgij Komarov
WPR by Profile, or WPR for Professionals Geo_WprPro is one of the well-known currency profile indicators. It simultaneously displays two WPR indicators with different parameters in the matrix form on all timeframes of multiple currency pairs forming the currency profile . As follows from the description, " WPR is a leading indicator that often goes ahead of the price chart. The oscillator frequently reaches extreme values before the price reversal as if anticipating that event: it almost always
Blahtech Market Profile
Blahtech Limited
4.53 (15)
Was: $249  Now: $99   Market Profile defines a number of day types that can help the trader to determine market behaviour. A key feature is the Value Area, representing the range of price action where 70% of trading took place. Understanding the Value Area can give traders valuable insight into market direction and establish the higher odds trade. It is an excellent addition to any system you may be using. Blahtech Limited presents their Market Profile indicator for the MetaTrader community. Ins
Daily Candle Predictor è un indicatore che prevede il prezzo di chiusura di una candela. L'indicatore è destinato principalmente all'uso sui grafici D1. Questo indicatore è adatto sia per il trading forex tradizionale che per il trading di opzioni binarie. L'indicatore può essere utilizzato come sistema di trading autonomo o può fungere da aggiunta al sistema di trading esistente. Questo indicatore analizza la candela corrente, calcolando alcuni fattori di forza all'interno del corpo della cande
EARLY REMINDER: The Starting price is 65 price will rise soon up to 365$ and then 750$ after first 10 copies of sales. Grab this offer now! Introduction Hello, traders! Welcome to the demonstration of the Forex Beast Indicator , a comprehensive tool designed to assist aspiring traders in navigating the complexities of the forex market. This indicator incorporates seven essential components to provide a well-rounded trading experience: Moving Averages Colored Zones Support and Resistance Levels
Gold Trend 4
Sergei Linskii
Gold Trend   - è un buon indicatore tecnico azionario. L'algoritmo dell'indicatore analizza il movimento del prezzo di un asset e riflette la volatilità e le potenziali zone di ingresso. I migliori segnali dell'indicatore: - Per VENDERE = istogramma rosso + puntatore SHORT rosso + freccia di segnale gialla nella stessa direzione + freccia rossa di direzione del trend. - Per l'ACQUISTO = istogramma blu + puntatore LONG blu + freccia di segnale acquatica nella stessa direzione + freccia blu di
EZZ Zig Zag MT4
Paulo Rocha
5 (1)
EZZ Elite Zig Zag is an indicator for the MetaTrader 4 terminal. This indicator traces the peak of the trend based on the market reversal, thus showing various opportunities in the financial market. EZZ Elite Zig Zag is a visual tool, intuitive, and easy to understand and use.  Test it Yourself by Downloading it for Free. Author Paulo Rocha all rights reserved
Forex Gump Trend is a universal indicator for highly effective determination of the trend direction. If you identify the trend correctly, this is 95% of trading success, because you will be able to open trades in the direction of the price movement and benefit from it. The Forex Gump Trend indicator helps traders with a high degree of efficiency to determine the current trend direction, as well as trend reversal points. The direction of the trend is shown by colored lines on the chart, and the
Price Magnet — Price Density and Attraction Levels Indicator Price Magnet is a professional analytical tool designed to identify key support and resistance levels based on statistical Price Density. The indicator analyzes a specified historical period and detects price levels where the market spent the most time. These zones act as “magnets,” attracting price action or forming a structural base for potential reversals. Unlike traditional Volume Profile tools, Price Magnet focuses on price-time d
PZ Mean Reversion MT4
PZ TRADING SLU
3 (4)
Indicatore unico che implementa un approccio professionale e quantitativo al trading di reversione. Sfrutta il fatto che il prezzo devia e ritorna alla media in modo prevedibile e misurabile, il che consente regole di entrata e uscita chiare che superano di gran lunga le strategie di trading non quantitative. [ Installation Guide | Update Guide | Troubleshooting | FAQ | All Products ] Segnali di trading chiari Incredibilmente facile da scambiare Colori e dimensioni personalizzabili Implementa l
L'indicatore SMC Venom Model BPR è uno strumento professionale per i trader che operano nell'ambito del concetto di Smart Money (SMC). Identifica automaticamente due modelli chiave sul grafico dei prezzi: FVG   (Fair Value Gap) è una combinazione di tre candele, in cui c'è un gap tra la prima e la terza candela. Forma una zona tra livelli in cui non c'è supporto di volume, il che spesso porta a una correzione dei prezzi. BPR   (Balanced Price Range) è una combinazione di due modelli FVG che for
Quantum Falcon Signal Free is a smart visual trading indicator for MetaTrader 4 designed for Forex and Gold traders. The indicator combines: • Trend analysis • RSI momentum confirmation • MACD momentum filtering • ATR volatility filtering • Higher timeframe confirmation • Smart exit signal detection Main Features: • Smart Buy and Sell signals • Exit Buy / Exit Sell alerts • Real-time dashboard on chart • Professional candle arrows • Multi-timeframe trend confirmation • ATR market volatility filt
FREE
Buy and sell zones
Evgeniy Zhdan
5 (2)
Indicator for determining flat and trend. If the price is below any of the two histograms and two lines (red and blue), this is a sell zone. When purchasing this version of the indicator, MT5 version for one real and one demo account - as a gift (to receive, write me a private message)! If the price is above any of the two histograms and two lines (red and blue), this is a buy zone. MT5 version:  https://www.mql5.com/en/market/product/70409 If the price is between two lines or in the zone of
Binary Options Support Resistance Indicator This indicator is designed for binary options trading and effectively shows retracements from support and resistance levels. Signals appear on the current candle. A red arrow pointing downwards indicates a potential selling opportunity, while a blue arrow pointing upwards suggests buying opportunities. All that needs adjustment is the color of the signal arrows. It is recommended to use it on the M1-M5 timeframes as signals are frequent on these timef
This indicator is another variant of the famous powerful indicator Fibonacci-SS https://www.mql5.com/en/market/product/10136 but has different behaviour in placing Pending Order and TP Line. Automatically places Fibonacci retracement lines from the last highest and lowest visible bars on the chart with: An auto Pending Order (Buy/Sell). Taking Profit 1, Taking Profit 2 is pivot point and Taking Profit 3 for extended reward opportunity. The best risk and reward ratio. Simple and powerful indicat
Trade History Drawer
David Leander Tschacher
Trade History Drawer is an indicator for MetaTrader 4. It shows trades on the chart and draws them in customized colors. Furthermore, the indicator shows a trade summary and saves a CSV history file for either one selected pair or all pairs. Inputs General Settings Number Trades : Number of trades to be drawn on the chart, if -1 then all trades Magic Number : Only trades with this magic number, if -1 then ignore Line Style : Line Style Line Thickness : Line Thickness Arrow Size : Arrow Size
MR Volume Profile 4
Sergey Khramchenkov
The "MR Volume Profile 4" indicator is a charting tool that displays trading volume at different price levels rather than time intervals. A key concept in volume profile is the point of control (POC)—the price level with the highest volume traded during the session or time range. While tools like VWAP or OBV provide volume trends, the "MR Volume Profile 4" indicator offers granular detail about where the most market activity occurs at specific price levels. This makes it a more precise tool for
HTF Candles is a practical technical analysis indicator that plots candles from a selected higher timeframe directly on your chart. It displays both the candle body and wicks, allowing you to see the full price structure of the chosen timeframe without switching chart intervals. The indicator allows you to: • observe higher timeframe context without leaving your current chart • quickly determine bias (trend tendency — whether buyers or sellers currently have the advantage) and the range of the h
VR Cub
Vladimir Pastushak
VR Cub è un indicatore per ottenere punti di ingresso di alta qualità. L'indicatore è stato sviluppato per facilitare i calcoli matematici e semplificare la ricerca dei punti di ingresso in una posizione. La strategia di trading per la quale è stato scritto l'indicatore ha dimostrato la sua efficacia per molti anni. La semplicità della strategia di trading è il suo grande vantaggio, che consente anche ai trader alle prime armi di commerciare con successo con essa. VR Cub calcola i punti di apert
Volume Profile Sniper v11. 1 è uno strumento completo per l'analisi di mercato Un approccio professionale al trading Volume Profile Sniper v11.1 integra più di 15 filtri chiave in un unico indicatore, fornendo segnali chiari basati su una valutazione completa della situazione del mercato. Caratteristiche principali Analisi dello squilibrio di volume-l'algoritmo calcola la percentuale di acquirenti e venditori in ciascuna candela, segnalando la predominanza di una delle parti (soglia configurab
Zig Zag Robot: A Comprehensive Reversal Trading System The Zig Zag Robot is a powerful tool designed to accurately identify key market reversals and filter out market "noise." It goes beyond a simple Zig Zag indicator by combining multiple tools and built-in logic to provide you with ready-to-use trading signals and help you make more informed decisions. How It Works The indicator uses a multi-level approach to market analysis, which allows it to find high-probability entry points: Signal Filter
BoxChart MT4
Evgeny Shevtsov
4.4 (5)
The market is unfair if only because 10% of participants manage 90% of funds. An ordinary trader has slim changes to stand against these "vultures". This problem can be solved. You just need to be among these 10%, learn to predict their intentions and move with them. Volume is the only preemptive factor that faultlessly works on any timeframe and symbol. First, the volume appears and is accumulated, and only then the price moves. The price moves from one volume to another. Areas of volume accumu
Indicador Taurus All4
Fabio Oliveira Magalhaes
Taurus All4 Taurus All4 is a high-performance indicator, it will tell you the strength of the trend, and you will be able to observe the strength of the candle. Our indicator has more than 4 trend confirmations. It is very simple and easy to use. Confirmation Modes Candle Trend Confirmations: When the candle switches to light green the trend is high. When the candle switches to light red the trend is reverting down. When the candle changes to dark red the trend is low. Trendline Trend Confirm
Auto Fibo Pro m
DMITRII GRIDASOV
Indicatore "Auto FIBO Pro" Crypto_Forex: è un ottimo strumento ausiliario nel trading! - L'indicatore calcola e posiziona automaticamente sul grafico i livelli di Fibo e le linee di tendenza locali (colore rosso). - I livelli di Fibonacci indicano le aree chiave in cui il prezzo può invertirsi. - I livelli più importanti sono 23,6%, 38,2%, 50% e 61,8%. - Puoi usarlo per lo scalping di inversione o per il trading di zone grid. - Ci sono molte opportunità per migliorare il tuo sistema attuale usa
Night ghost
Dmitriy Kashevich
Night Ghost - Indicatore a freccia per opzioni binarie. Questo è un assistente affidabile per te in futuro! - Nessun ridisegno sul grafico -Funziona alla grande su tutte le coppie di valute! -Precisione dell'indicatore fino al 90% (soprattutto di notte) -Non c'è bisogno di impostare per molto tempo (impostato perfettamente per le opzioni binarie) - Segnali non in ritardo - La comparsa di un segnale sulla candela corrente -Perfetto per il periodo M1 (non più!) - Colore della candela ad
Trader Indicator
Matshelo Innocent Beesnaar
The TraderProfit7TopDown is a sophisticated multi-confirmation technical indicator for MetaTrader 4, designed to generate high-probability trading signals by synthesizing data from price action, momentum, and market volume. Its core philosophy is to filter out market noise and false breakouts by requiring a confluence of four distinct analytical factors before presenting a signal, making it a robust tool for trend-following strategies. The indicator's logic is built upon a layered approach. F
MACDivergence MTF
Pavel Zamoshnikov
4.29 (7)
Advanced ideas of the popular MACD indicator: It detects and displays classic and reverse divergences (three methods of detecting divergences). It uses different color to highlight an uptrend and a downtrend. Two methods of determining a trend: а) MACD crosses the 0 level (classic signal); б) MACD crosses its own average (early signal). This is a multi-timeframe indicator: it can display MACD data from other timeframes. Two methods of drawing: classic histogram and line. It generates sound and v
Cosmic Diviner X Planet
Olena Kondratenko
4 (2)
This unique multi-currency strategy simultaneously determines the strength of trends and market entry points, visualizing this using histograms on the chart. The indicator is optimally adapted for trading on the timeframes М5, М15, М30, Н1. For the convenience of users, the indicator renders the entry point (in the form of an arrow), recommended take profit levels (TP1, TP2 with text labels) and the recommended Stop Loss level. The take profit levels (TP1, TP2) are automatically calculated for
CCI Mtf
Dmitriy Susloparov
This is a fully multi-timeframe version of the Commodity Channel Index standard indicator, which works for any combination of timeframes. The indicator preserves the correct time scale for all charts at any intervals. When switching to a higher or lower timeframe, the time scale is not distorted. For example, one value of М15 will occupy 15 bars on М1 and 3 bars on М5 . The indicator allows you to see the real dynamics and the overall ratio for all selected periods, as well as accurately evaluat
Indicatore di gestione del rischio e monitoraggio dei limiti per trader professionisti e account di valutazione (Prop) Questo strumento visualizza esclusivamente sul grafico informazioni precise su gestione del rischio e limiti, per aiutarti a decidere con maggiore concentrazione. L’indicatore non apre/chiude/modifica operazioni e non interferisce con gli Expert Advisor. Caratteristiche Monitoraggio del drawdown giornaliero e totale Calcola e mostra il drawdown giornaliero e totale in base a Ba
If you are using volume spread analysis, whether your are a beginner or an expert, this system will give you a lot of features and help in your analysis. Please watch the video to see all the features. Features With one click you will find all the VSA patterns on your chart . Bars without opening price. Easy to read volume indicator. Bar reader (Bar type - Close type - Volume type - Spread type). Daily and weekly levels (Pivot - Camarilla - Fibo). Very light on the trading platform and moving b
Gli utenti di questo prodotto hanno anche acquistato
Neuro Poseidon MT4
Daria Rezueva
4.94 (18)
Neuro Poseidon is a new indicator by Daria Rezueva. It combines precise trading signals with adaptive TP/SL levels - creating best possible trades as a result! Message me and get  Neuro Poseidon Assistant  as a gift to automize your trading process! What makes it stand out? 1. Proven profitability on all assets and timeframes 2. Only confirmed BUY and SELL signals present on the chart 3. Adaptive TP & SL levels generated by the software for each trade 4. Easy to understand - suitable for all
Scalper Inside PRO
Alexey Minkov
4.74 (68)
Scalper Inside PRO Scalper Inside PRO is an intraday trend and scalping indicator for MetaTrader 4 that uses an exclusive algorithm to quickly detect market direction and key target levels. It automatically calculates entry, exit and multiple profit targets, and shows detailed performance statistics so you can see how different instruments and strategies performed. This helps you choose the most suitable trading instruments for the current market conditions. Additionally, you can easily integrat
M1 Sniper
Oleg Rodin
5 (23)
M1 SNIPER è un sistema di indicatori di trading facile da usare. Si tratta di un indicatore a freccia progettato per l'intervallo temporale M1. L'indicatore può essere utilizzato come sistema autonomo per lo scalping sull'intervallo temporale M1 e come parte del tuo sistema di trading esistente. Sebbene questo sistema di trading sia stato progettato specificamente per il trading sull'intervallo temporale M1, può comunque essere utilizzato anche con altri intervalli temporali. Inizialmente ho pro
Gann Made Easy
Oleg Rodin
4.84 (164)
Gann Made Easy è un sistema di trading Forex professionale e facile da usare che si basa sui migliori principi del trading utilizzando la teoria di mr. WD Gann. L'indicatore fornisce segnali ACQUISTA e VENDI accurati, inclusi i livelli di Stop Loss e Take Profit. Puoi fare trading anche in movimento utilizzando le notifiche PUSH. CONTATTAMI DOPO L'ACQUISTO PER RICEVERE GRATUITAMENTE LE ISTRUZIONI DI TRADING E OTTIMI INDICATORI EXTRA! Probabilmente hai già sentito parlare molte volte dei metodi d
PRO Renko System
Oleg Rodin
5 (30)
PRO Renko System è un sistema di trading altamente accurato appositamente progettato per il trading di grafici RENKO. Questo è un sistema universale che può essere applicato a vari strumenti di trading. Il sistema neutralizza efficacemente il cosiddetto rumore di mercato che consente di accedere a segnali di inversione accurati. L'indicatore è molto facile da usare e ha un solo parametro responsabile della generazione del segnale. Puoi facilmente adattare lo strumento a qualsiasi strumento di
Trend Catcher ind
Ramil Minniakhmetov
INDICATORE TREND CATCHER L'indicatore Trend Catcher analizza i movimenti dei prezzi di mercato, utilizzando una combinazione di indicatori di analisi del trend proprietari dell'autore e personalizzati. Identifica la vera direzione del mercato filtrando il rumore a breve termine e concentrandosi sulla forza del momentum sottostante, sull'espansione della volatilità e sul comportamento della struttura dei prezzi. Utilizza inoltre una combinazione di indicatori personalizzati di smoothing e filtr
Trend Lines PRO
Roman Podpora
5 (1)
LINEE DI TENDENZA PRO       Aiuta a capire dove il mercato sta realmente cambiando direzione. L'indicatore mostra reali inversioni di tendenza e punti in cui i principali attori rientrano. Vedi  Linee BOS   Cambiamenti di tendenza e livelli chiave su timeframe più ampi, senza impostazioni complesse o rumore inutile. I segnali non vengono ridisegnati e rimangono sul grafico dopo la chiusura della barra. VERSIONE MT 5     -      Svela il suo massimo potenziale se abbinato all'indicatore   RFI LEVE
Enigmera
Ivan Stefanov
5 (8)
ENIGMERA: Il cuore del mercato Importante: La demo di MQL5.com funziona nel Strategy Tester e potrebbe non riflettere completamente le funzionalità di Enigmera. Consulta la descrizione, gli screenshot e il video per maggiori dettagli. Non esitare a inviarmi un messaggio se hai domande! Il codice dell'indicatore è stato completamente riscritto. La versione 3.0 aggiunge nuove funzionalità e corregge i bug accumulati dall'inizio dell'indicatore. Introduzione Questo indicatore e sistema di trading
Dynamic Forex28 Navigator
Bernhard Schweigert
4.43 (7)
Dynamic Forex28 Navigator - Lo strumento di trading Forex di nuova generazione. ATTUALMENTE SCONTATO DEL 49%. Dynamic Forex28 Navigator è l'evoluzione dei nostri indicatori popolari di lunga data, che combinano la potenza di tre in uno: Advanced Currency Strength28 Indicator (695 recensioni) + Advanced Currency IMPULSE con ALERT (520 recensioni) + CS28 Combo Signals (Bonus). Dettagli sull'indicatore https://www.mql5.com/en/blogs/post/758844 Cosa offre l'indicatore di forza di nuova generazione?
Genesis Matrix Pro is a professional multi-timeframe trend detection indicator designed to help traders identify high-quality market alignment with clarity and structure. It combines 12 different technical indicators into one visual alignment matrix, allowing traders to quickly see when market conditions are bullish, bearish, or neutral. A signal is generated only when the selected strategies are aligned, helping reduce noise and improve decision-making. PLEASE CONTACT ME AFTER PURCHASE TO GET
Questo indicatore è un indicatore per l'analisi automatica delle onde perfetto per il trading pratico! Caso... Nota:   non sono abituato a usare nomi occidentali per la classificazione delle onde a causa dell'influenza della convenzione di denominazione di Tang Lun (Tang Zhong Shuo Zen), ho chiamato l'onda base come   penna   e la banda dell'onda secondaria come   segmento   At allo stesso tempo, il segmento ha la direzione del trend. La denominazione   è principalmente segmento di trend   (que
RFI levels PRO
Roman Podpora
5 (1)
L'indicatore mostra accuratamente i punti di inversione e le zone di ritorno dei prezzi in cui il       Principali attori   . Vedi dove si formano le nuove tendenze e prendi decisioni con la massima precisione, mantenendo il controllo su ogni operazione. VERSION MT5     -     Rivela il suo massimo potenziale se combinato con l'indicatore   TREND LINES PRO Cosa mostra l'indicatore: Strutture di inversione e livelli di inversione con attivazione all'inizio di un nuovo trend. Visualizzazione dei l
Questo prodotto è stato aggiornato per il mercato 2026 e ottimizzato per le ultime build di MT5. AVVISO DI AGGIORNAMENTO PREZZO: Smart Trend Trading System è attualmente disponibile a $99 . Il prezzo aumenterà a $199 dopo i prossimi 30 acquisti . OFFERTA SPECIALE: Dopo aver acquistato Smart Trend Trading System, inviami un messaggio privato per ricevere Smart Universal EA GRATIS e trasformare i tuoi segnali Smart Trend in operazioni automatiche. Smart Trend Trading System è un sistema di tradin
MTF Supply Demand Zones
Georgios Kalomoiropoulos
4.82 (22)
Nuova generazione di zone di domanda e offerta automatizzate. Algoritmo nuovo e innovativo che funziona su qualsiasi grafico. Tutte le zone vengono create dinamicamente in base all'azione dei prezzi del mercato. DUE TIPI DI AVVISI --> 1) QUANDO IL PREZZO RAGGIUNGE UNA ZONA 2) QUANDO SI FORMA UNA NUOVA ZONA Non ottieni un altro indicatore inutile. Ottieni una strategia di trading completa con risultati comprovati.     Nuove caratteristiche:     Avvisi quando il prezzo raggiunge la zona di
Step into the world of Forex trading with confidence, clarity, and precision using   Gold Indicator   a next-generation tool engineered to take your trading performance to the next level. Whether you’re a seasoned professional or just beginning your journey in the currency markets, Gold Indicator equips you with powerful insights and help you trade smarter, not harder. Built on the proven synergy of three advanced indicators, Gold Indicator focuses exclusively on medium and long-term trends eli
Entry Points Pro
Yury Orlov
4.59 (174)
Indicatore top per MT5 che fornisce segnali accurati per entrare in un trade senza riverniciare! Può essere applicato a qualsiasi attività finanziaria: forex, criptovalute, metalli, azioni, indici.  La versione MT5 è qui Fornirà segnali di trading piuttosto precisi e ti dirà quando è meglio aprire un trade e chiuderlo. Guarda il video (6:22) con un esempio di elaborazione di un solo segnale che ha ripagato l'indicatore! La maggior parte dei trader migliora i propri risultati di trading dura
MetaBands M4
Vahidreza Heidar Gholami
3.5 (6)
MetaBands uses powerful and unique algorithms to draw channels and detect trends so that it can provide traders with potential points for entering and exiting trades. It’s a channel indicator plus a powerful trend indicator. It includes different types of channels which can be merged to create new channels simply by using the input parameters. MetaBands uses all types of alerts to notify users about market events. Features Supports most of the channel algorithms Powerful trend detection algorith
Versione Swing M30/H1/H4 disponibile Vuoi catturare i grandi movimenti? Gold Signal Swing Pro (M30/H1/H4). Obiettivo: $20-$80+ per trade. https://www.mql5.com/en/market/product/177643 KURAMA GOLD SIGNAL PRO (MT4) — Sistema di Trading XAUUSD Completo con Filtro a 7 Strati, TP/SL Automatico e Punteggio di Qualità NESSUN REPAINT. NESSUN RIDISEGNO. NESSUN RITARDO. Ogni segnale è permanente. Ciò che vedi è ciò che ottieni. BONUS: Acquista la licenza a vit
Current event:  https://c.mql5.com/1/326/A2SR2025_NoMusic.gif R. Cos'è l'A2SR ?   * È un indicatore tecnico leader (nessuna riverniciatura, nessun ritardo). -- Guida : -- su https://www.mql5.com/en/blogs/post/734748/page4#comment_16532516 -- e https://www.mql5.com/en/users/yohana/blog A2SR ha una tecnica speciale per determinare i livelli di supporto (domanda) e resistenza (offerta). A differenza del modo ordinario che abbiamo visto in rete, A2SR ha un concetto originale nel determinare i li
Market Structure Patterns MT4
Samuel Manoel De Souza
5 (18)
Market Structure Patterns   è un indicatore basato sui   Smart Money Concepts   che mostra gli   elementi SMC/ICT   che possono portare le tue decisioni di trading a un livello superiore. Approfitta di   alert ,   notifiche push   e   email   per essere avvisato quando si forma un elemento sul grafico, il prezzo supera un livello e/o entra in una zona. Gli sviluppatori possono accedere ai valori degli elementi dell’indicatore utilizzando le   variabili globali , consentendo l’automazione delle d
BTMM State Engine Pro is a MetaTrader 4 indicator for traders who use the Beat The Market Maker approach: Asian session context, kill zone timing, level progression, peak formation detection, and a multi-pair scanner from a single chart. It combines cycle state logic with a built-in scanner dashboard so you do not need the same tool on many charts at once. What it does Draws the Asian session range; session times can follow broker server offset or be set in inputs. Tracks level progression (L
Quant Direction
Georgios Kalomoiropoulos
Quant Direction è uno strumento di analisi di mercato 3D. Offre un'analisi di mercato perfettamente oggettiva, basata su algoritmi, calcolando con precisione le deviazioni percentuali su diversi parametri. Sviluppato utilizzando strumenti di modellazione avanzati basati sull'intelligenza artificiale e rigorosamente testato, questo algoritmo analizza il mercato con una precisione senza pari. È possibile analizzare qualsiasi coppia di valute o strumento finanziario sulla piattaforma. Che si pratic
FX Power MT4 NG
Daniel Stein
4.95 (21)
FX Power: Analizza la Forza delle Valute per Decisioni di Trading Più Intelligenti Panoramica FX Power è lo strumento essenziale per comprendere la reale forza delle principali valute e dell'oro in qualsiasi condizione di mercato. Identificando le valute forti da comprare e quelle deboli da vendere, FX Power semplifica le decisioni di trading e rivela opportunità ad alta probabilità. Che tu segua le tendenze o anticipi inversioni utilizzando valori estremi di Delta, questo strumento si adatta
NAM Order Blocks
NAM TECH GROUP, CORP.
3.67 (3)
MT4 Multi-timeframe Order Blocks detection indicator. Features - Fully customizable on chart control panel, provides complete interaction. - Hide and show control panel wherever you want. - Detect OBs on multiple timeframes. - Select OBs quantity to display. - Different OBs user interface. - Different filters on OBs. - OB proximity alert. - ADR High and Low lines. - Notification service (Screen alerts | Push notifications). Summary Order block is a market behavior that indicates order collection
Auto Optimized Parabolic RSI: Motore di Momentum 3D Avanzato La maggior parte degli indicatori per trader privati fallisce perché si affida a parametri statici che smettono di funzionare nel momento in cui la volatilità del mercato cambia. Auto Optimized Parabolic RSI risolve il problema dell'"obsolescenza dell'indicatore" ricalcolando continuamente il proprio vantaggio matematico, portando un adattamento quantitativo di livello istituzionale direttamente sul tuo terminale MT5. Il Vantaggio Prin
Volume Master – Real-Time Market Power Indicator See who’s in control of the market: buyers or sellers in real time. Volume Master is a powerful trading tool designed to give you a clear edge by visualizing bull vs bear activity across multiple symbols, while helping you confirm high-probability entries directly on your chart. WHAT MAKES VOLUME MASTER DIFFERENT? Unlike traditional volume indicators, Volume Master doesn’t just show volume — it shows market dominance. Real-Time Bull vs Bear Activi
Segnale GoldRush Trend Arrow L'indicatore GoldRush Trend Arrow Signal fornisce un'analisi precisa e in tempo reale dei trend, pensata appositamente per gli scalper ad alta velocità e a breve termine nel mercato XAU/USD. Progettato specificamente per il timeframe di 1 minuto, questo strumento mostra frecce direzionali che indicano chiari punti di ingresso, consentendo agli scalper di navigare con sicurezza nelle condizioni di mercato volatili. L'indicatore è composto da frecce di avviso PRIMA
PZ 123 Pattern
PZ TRADING SLU
1 (1)
Unlock powerful breakout opportunities The 123 Pattern is one of the most popular, powerful and flexible chart patterns. The pattern is made up of three price points: a bottom, a peak or valley, and a Fibonacci retracement between 38.2% and 71.8%. A pattern is considered valid when the price breaks beyond the last peak or valley, moment at which the indicator plots an arrow, rises an alert, and the trade can be placed. [ Installation Guide | Update Guide | Troubleshooting | FAQ | All Products  ]
Bull versus Bear
Mohamed Hassan
4.5 (18)
Send us a message after your purchase to receive more information on how to get your  BONUS  for FREE  that works in great combination with Bull vs Bear ! Bull versus Bear is an easy-to-use Forex indicator that gives traders clear and accurate signals based on clear trend retests . Forget about lagging indicators or staring at charts for hours because  Bull vs Bear provides real-time entries with no lag and no repaint, so you can trade with confidence. Bull vs Bear  helps you enter trades during
The Propfolio Master Suite is the ultimate all-in-one analytical workstation for professional traders. Combining the power of the Beat The Market Maker (BTMM) methodology, Smart Money Concepts (SND/Liquidity), and Advanced Volume Profile, this suite replaces multiple different indicators with one optimized engine. Monitor up to 14 pairs simultaneously from a single chart, instantly identify market cycles, and seamlessly map institutional footprints with the click of a button. The Command Center
Altri dall’autore
A new interpretation of the classical indicator in the form of an oscillator for a more accurate representation of the situation on the market. Less lagging than the standard Alligator. All settings are fully accessible, such as the type and prices for which it is built. Thanks to the additional parameters, it became possible to fine tune. Distinctive features Does not redraw. Additional parameters for fine tuning. Works on all timeframes and symbols. Suitable for manual trading and developmen
FREE
SFT Full OsMA
Artem Kuzmin
4 (1)
A classic indicator with advanced features for more accurate display of the market situation. All settings of all moving averages are available, such as the moving average type and the priced used in its calculation. It is also possible to change the appearance of the indicator - line or histogram. Additional parameters provide the ability of fine tuning. Distinctive features Does not redraw. Additional parameters for fine tuning. Displayed as a line or as a histogram. Works on all timeframes a
FREE
The support and resistance levels are among the main components of the entire technical analysis. They are used both by professional traders and by beginners. Prices usually move within the price channels. The upper boundary of such a channel is called resistance, and the lower one is support. This indicator plots fractal support and resistance lines at the highest and lowest local price values (fractals). Distinctive features Does not redraw. Clear and understandable signals. It is possible to
Opening positions in the direction of the trend is one of the most common trading tactics. The main idea is that the probability of the trend continuation is higher than that of its change. This indicator determines the direction of a local movement, marking the beginning of a trend with a large dot and its continuation with a line of the corresponding color. Distinctive features No Repaint. Simple and accurate settings. Clear and understandable signals. Works on all timeframes and symbols. Sui
This highly informative indicator applies overbought/oversold levels for more accurate representation of the market situation. It is also possible to change the appearance of the indicator - line or histogram. Additional parameters enable more fine-tuning, while trading can be inside the channel and along a trend. Distinctive features Oversold/overbought levels; Does not redraw. Displayed as a line or a histogram; Works on all timeframes and symbols. Suitable for manual trading and development
MACD indicator with overbought and oversold zones. Two display options - classic lines and a histogram. Can be used to detect a possible reversal or pullback in price, as well as for channel strategies All settings are simple and straightforward - all like a standard indicator, but with additional support and resistance levels Can be used both separately and together with other indicators
Awesome oscillator with overbought and oversold zones. A series of OBS indicators (overbought and oversold) - these are indicators enhanced with overbought and oversold zones. This makes it possible to determine when the instrument is trending, as well as when it is flat. Works on all timeframes, all currency pairs, metals and cryptocurrencies. Can be used with binary options. Settings OBS Period - period of overbought and oversold calculation
Accelerator indicator with overbought and oversold zones. A series of OBS indicators (overbought and oversold) - these are indicators enhanced with overbought and oversold zones. This is the standard indicator, but it provides additional possibilities for the analysis of any market. Thanks to a special algorithm, this indicator has overbought zones =70 and =100, as well as oversold zones -70 and -100, which allows you to use it to determine the possible reversal or pullback of the price, as well
The Bears indicator with overbought and oversold zones. Two display options - as a line and as a histogram.  A series of OBS indicators (overbought and oversold) - these are indicators enhanced with overbought and oversold zones. This is the standard indicator, but it provides additional possibilities for the analysis of any market. Thanks to a special algorithm, this indicator has overbought zones =70 and =100, as well as oversold zones -70 and -100, which allows you to use it to determine the
Bulls indicator with overbought and oversold zones. Two display options - as a line and as a histogram. OBS (overbought and oversold) indicator series - are indicators that have been provided with overbought and oversold zones. This is the standard indicator, but it provides additional possibilities for the analysis of any market. Thanks to a special algorithm, this indicator has overbought zones =70 and =100, as well as oversold zones -70 and -100, which allows you to use it to determine the p
Multicurrency indicator Any chart obs is a price chart with a percentage scale. Can be displayed as a line and as a histogram. There is also a reverse function available, it mirrors the chart. The name of an instrument to be displayed is specified in the input parameters, the current symbol is used on default. The indicator doesn't have lags as it is not smoothed with any formulas, but bound to a percentage scale, what allows detecting the price equilibrium, the overbought and oversold state. Th
The Accumulation indicator with overbought and oversold zones. Two display options - as a line and as a histogram.  A series of OBS indicators (overbought and oversold) - these are indicators enhanced with overbought and oversold zones.  Simple and straightforward settings that are easy to match to the right tool In the indicator, you can adjust: Display depth of the indicator Color of indicator levels
MTF Moving Averages indicator with overbought and oversold zones. Two display options - as a line and as a histogram. A series of OBS (overbought and oversold) indicators - these are indicators that have been enhanced with overbought and oversold zones. Another feature of this indicator is that the lines of the  indicator s (when analyzing several  indicator s in a single window) are not redrawn relative to each other when scrolling the chart. Settings OBS Period - period of overbought/oversold
The indicator gives signals on trend reversal or the possible direction of price movement when leaving the flat movement. Features and settings: Sensitivity = 3 - sensitivity from 1 to 5; the higher the value, the more signals (example displayed in the screenshot below). DeepBars = 3000 - indicator display depth. ZeroBarCalc = false - use a zero bar in the calculations; if yes, the signal will appear earlier, but it may disappear before the current candlestick is closed. UseAlert = false - enab
The indicator calculates critical price levels. If the level is red, the price has passed it downwards; if the level is blue, the price has passed it upwards. If the price is approaching the blue level from below, that level will most probably be broken through. If the price is approaching it from above, there will most probably be a rollback. Similarly, if the price is approaching the red level from above, the level will most probably be broken through. If the price is approaching it from below
The indicator is based on pair trading methods. It is not redrawn unlike similar indicators. Shows correlation between two selected instruments in percent for a predetermined period, and the positions of the instruments relative to each other. Has a function for reverse display of any of the analyzed symbols - for instruments with negative correlation. Can be drawn as a line or as a histogram. Settings: Symb1 - first symbol name. Revers1 - reverse display of the first symbol. Symb2 - second symb
An indicator for entering with trend and timely exiting. It has sensitivity setting, by adjusting which it can be applied to both long-term and short-term speculation.  The highest sensitivity = 1, with this setup, you can even scalp on M1. No lag, does not withdraw after candlestick closure.  One of the use options: enter after a candlestick closes, if the vertical line consists of squares of the same color; exit if the color of two or more squares changes. Before using it, be sure to analyze t
The indicator builds fractals on extrema of the OsMA indicator Appears on the chart as a fractal or a fractal channel. It has a flexible setting and, in contrast to the standard fractals, lags only by 1 bar. Settings: DeepBars - the indicator's depth of display; Sensitivity_1_or_2 - 1 - for small periods of OsMA, 2 - for large periods; Arrow_or_channel - display on the chart fractals or channel; FastMA - period of the fast moving average;  SlowMA - period of slow moving average;  SignalSMA - per
This is an indicator for additional signal filtering. It can be used as an additional filter in a trading system. The indicator does not redraw its data and can be used both in forex trading and with binary options. It has 3 operation modes and flexible sensitivity settings. The indicator uses multiple buffers, therefore it can be easily used in various Expert Advisors.
Flat Factor
Artem Kuzmin
5 (1)
The indicator is designed for visual determining market directions. It allows to determine the distance from a price and helps in drawing correct conclusions. Perfectly defines flat zones, horizontal intraday trends and trend movements, and an additional setting allows to use the indicator on any instrument. Does not redraw its readings. You get professional trading indicator for a reasonable price. Settings: Period_FF = 7 - indicator period Sensitivity_FF = 5 - sensitivity in % Wish you all su
The indicator colors bars displaying prices of overbought and oversold areas on the chart. It will help you to estimate moments when market climate changes and the price has its local extreme values. It can be used both independently and as a good supplement to any channel trading system. And this indicator is easy-to-use in expert advisors due to usage of indicator buffers instead of graphical objects. Settings ExtPeriod = 100 — indicator period; Sensitivity = 80 — indicator sensitivity.
This is a moving average which can move not only to the right/left, but also up/down. You can also select a mode of displaying the indicator (as a line or as dots) and all other settings of a standard moving average. If you overlay several indicators in one window, you can clearlier determine price channels setting each border individually. Settings Line_or_Dot - mode of displaying the indicator: true - as a line, false - as dots; MA_period - moving average period; MA_shift_X - number of candle
Alarm arrow indicator of increased sensitivity After closing the candle the arrows do not disappear Allows you to enter the transaction on time at the lowest price movements Can be used on any currency pairs, metals and cryptocurrency Suitable for working with binary options Distinctive features Does not redraw; Determines the price correction; Advanced settings for fine tuning; Works on all timeframes and on all symbols; Suitable for trading currencies, metals, options and cryptocurrency (Bitco
A classic indicator with advanced features for more accurate display of the market situation. All settings of all moving averages are available, such as the moving average type and the priced used in its calculation. It is also possible to change the appearance of the indicator - line or histogram. Additional parameters provide the ability of fine tuning. Distinctive features Does not redraw. Additional parameters for fine tuning. Displayed as a line or as a histogram. Works on all timeframes a
This highly informative indicator applies overbought/oversold levels for more accurate representation of the market situation. All moving average settings are available, including average type and price it is based on. It is also possible to change the appearance of the indicator - line or histogram. Additional parameters enable more fine-tuning, while trading can be inside the channel and along a trend. Distinctive features Oversold/overbought levels; Does not redraw. Additional parameters for
Arrow indicator, to determine adjustments and local trends The arrow appears on the current bar and after closing the bar will not disappear. Allows you to enter the transaction at the very beginning of the movement Thanks to the flexible settings you can use on any currency pairs, metals and cryptocurrency Can be used when working with binary options Distinctive features Does not redraw. Additional parameters for fine tuning. Works on all timeframes and symbols. Suitable for trading curren
Opening positions in the direction of the trend is one of the most common trading tactics. This indicator determines the direction of the local movement and colors the candles on the chart in the appropriate color. Allows you to enter the transaction at the very beginning of the movement Thanks to the flexible settings you can use on any currency pairs, metals and cryptocurrency Can be used when working with binary options Distinctive features Does not redraw. Additional parameters for fine
One of the main components of successful trading is the correct determination of the direction of the market. This indicator shows the general directionality of the price movement and is painted in the corresponding color. Allows you to conduct trend and counter trend trading It works on all timeframes, on any currency pairs, metals and cryptocurrency Can be used when working with binary options Distinctive features Does not redraw; Simple and clear settings; Works on all timeframes and symbols
Arrow indicator, for determining price reversals Arrow appears on the closed bar Allows you to enter the transaction at the very beginning of the turn Can be used on any currency pairs, metals and cryptocurrency Suitable for working with binary options Distinctive features Determines the price correction; Advanced settings for fine tuning; It works on all timeframes and on all symbols; Suitable for trading currencies, metals, options and cryptocurrency (Bitcoin, Litecoin, Ethereum, etc.) Suitab
Filtro:
Nessuna recensione
Rispondi alla recensione