Volatility level
- Indikatoren
- Version: 1.0
- Aktivierungen: 5
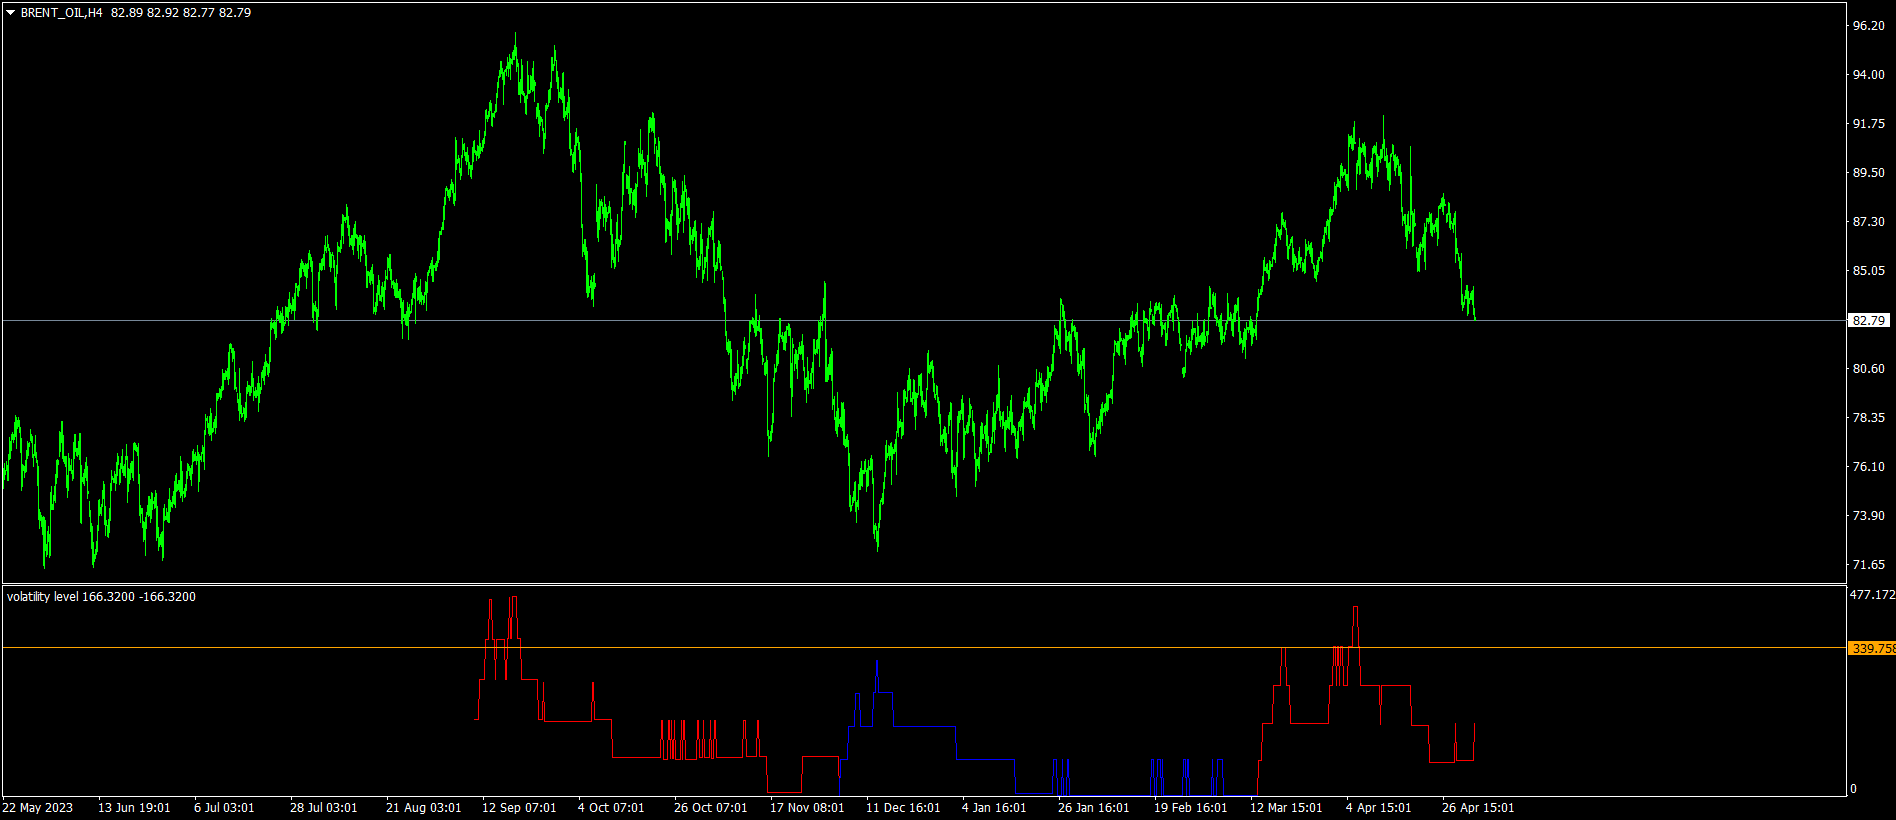
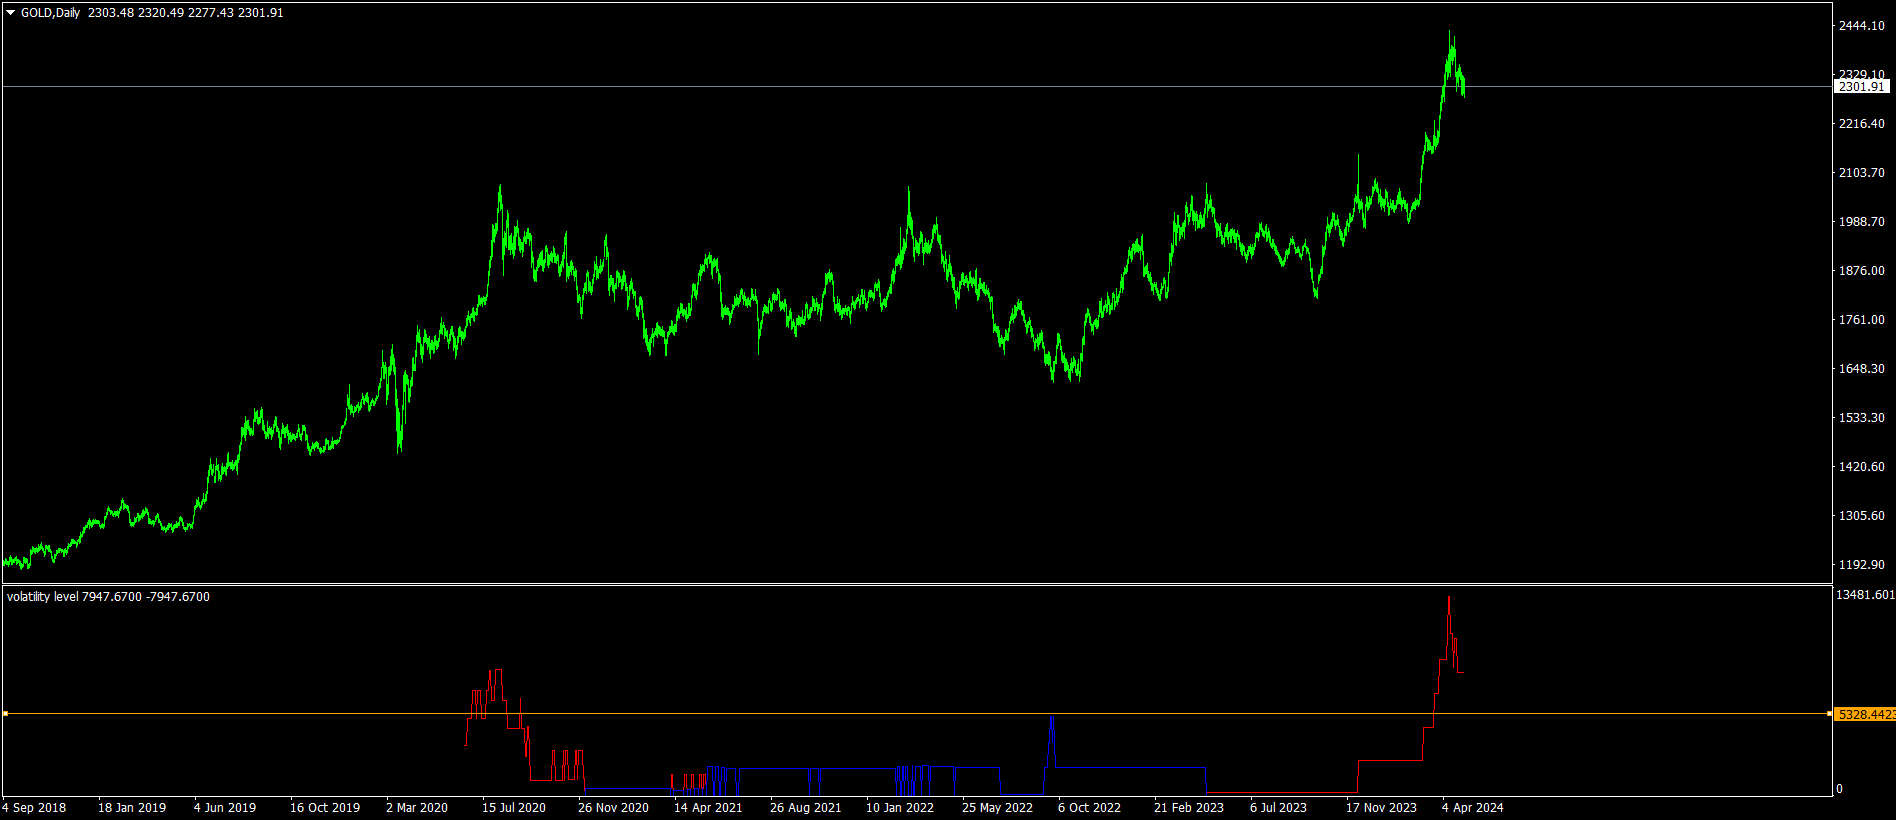
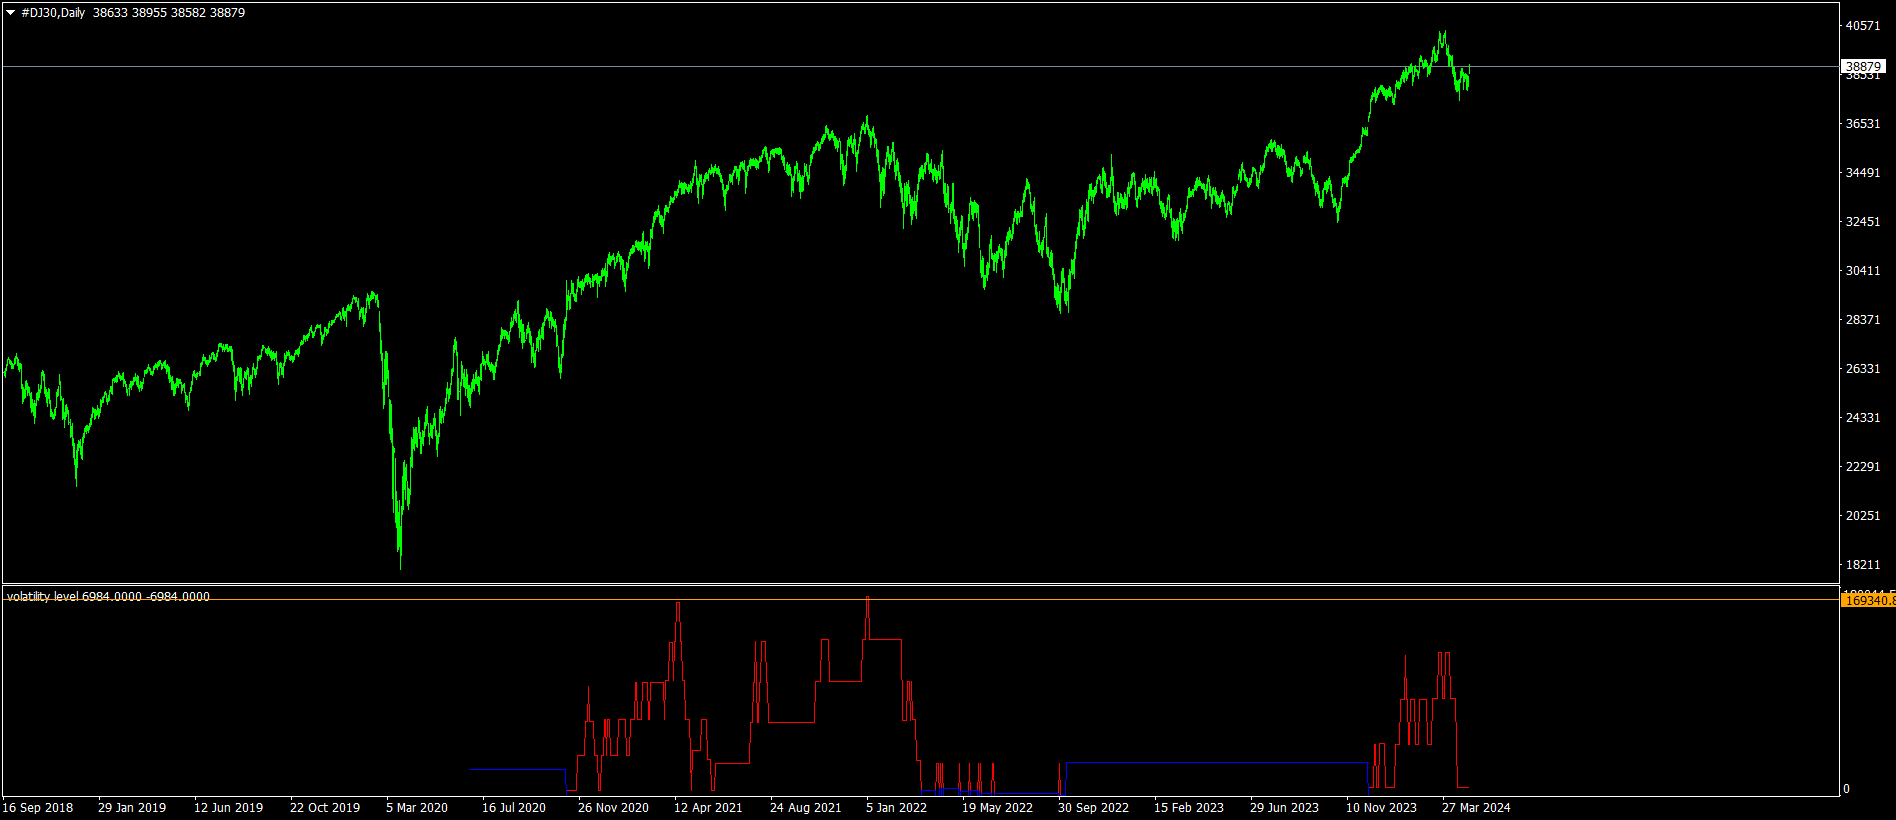
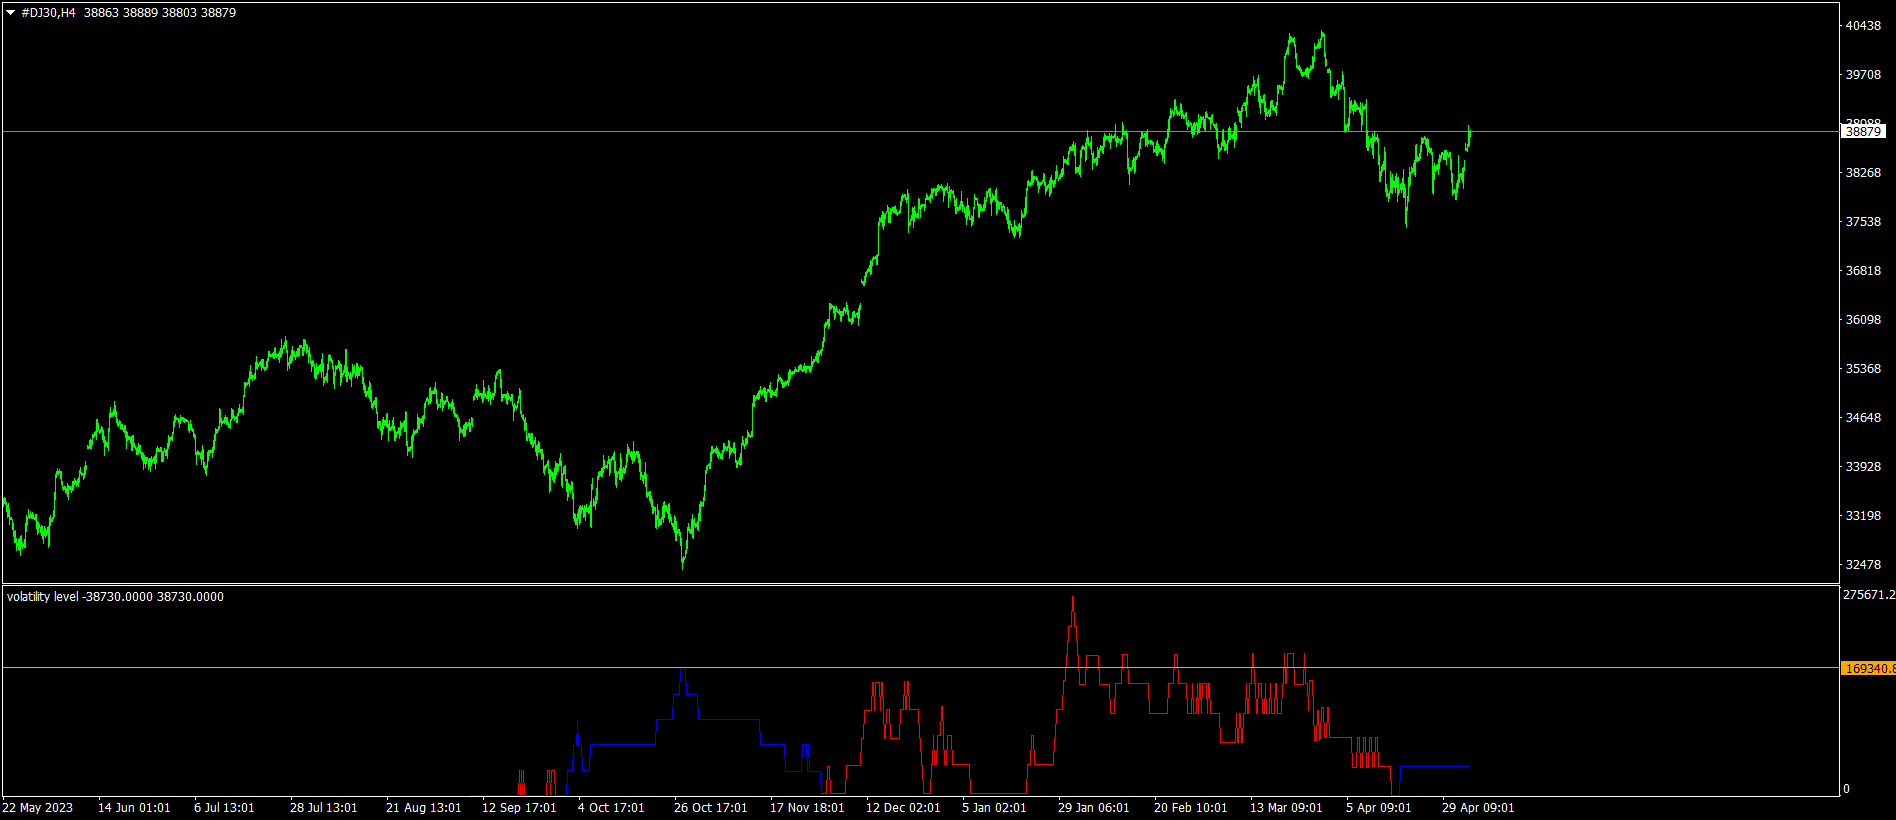
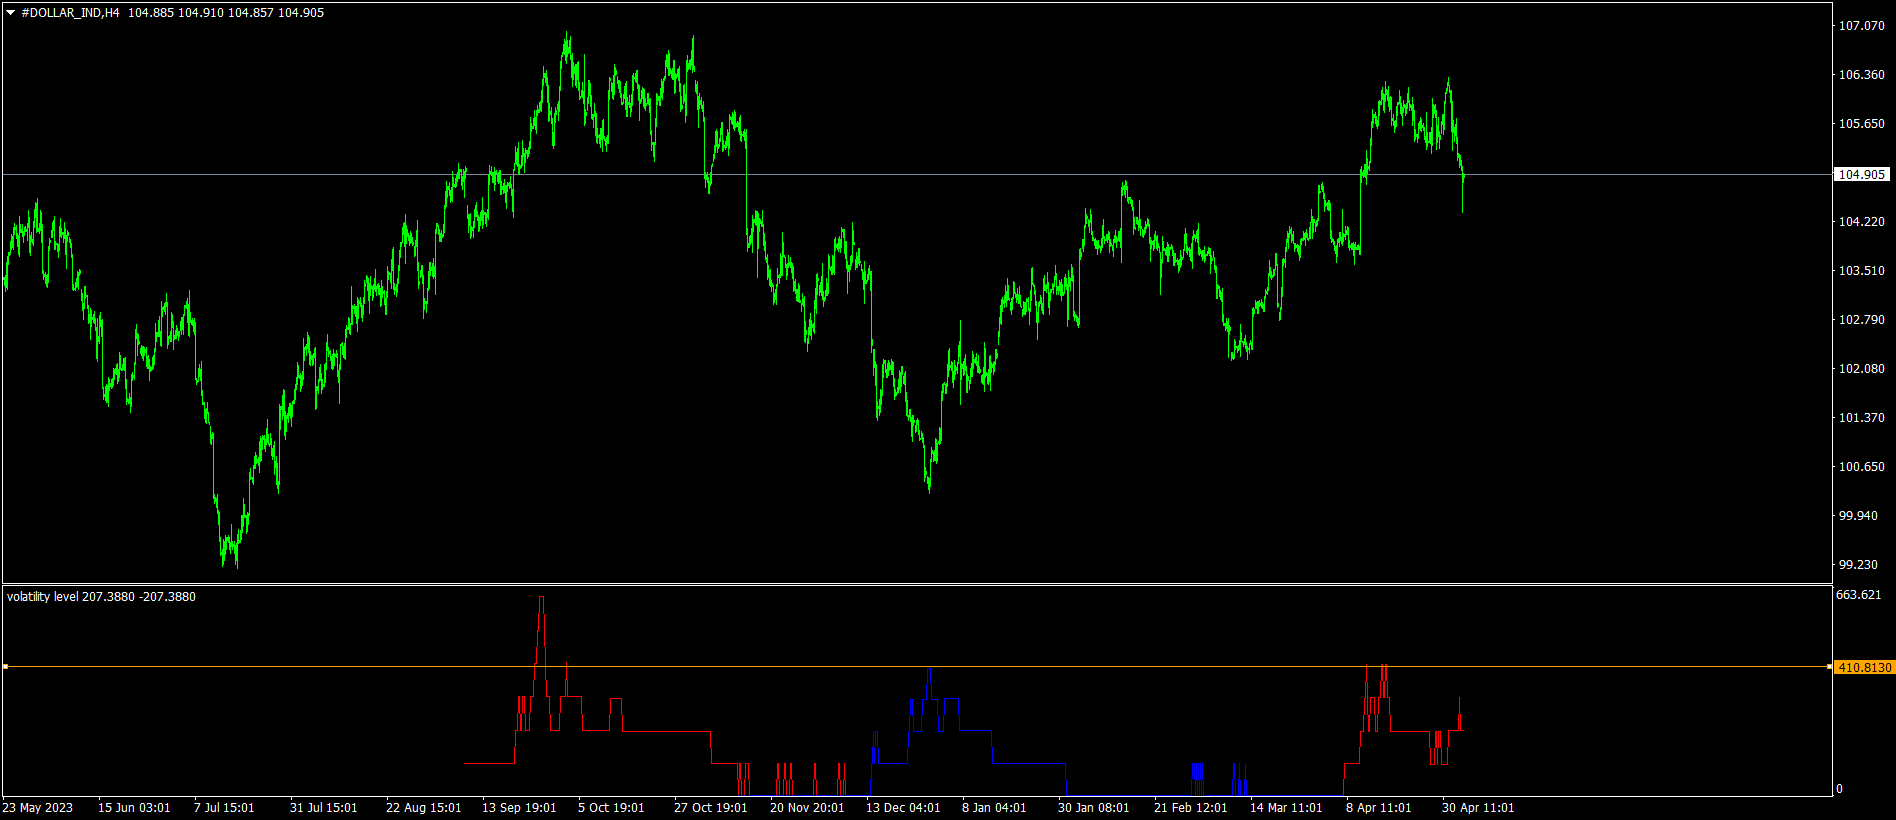
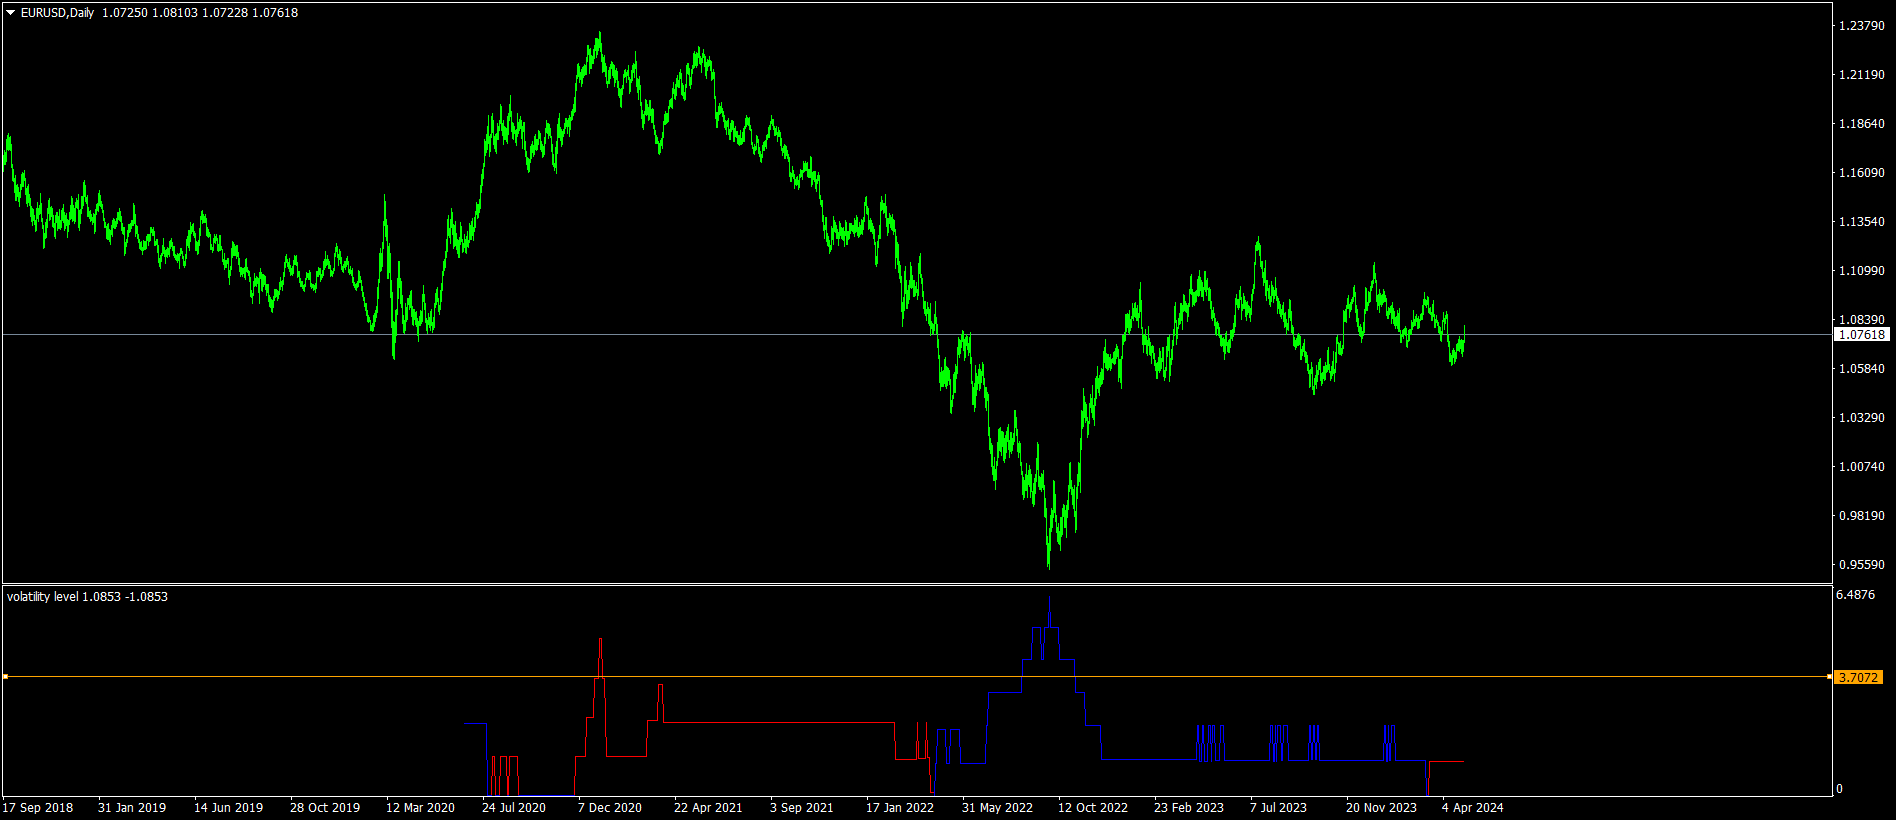
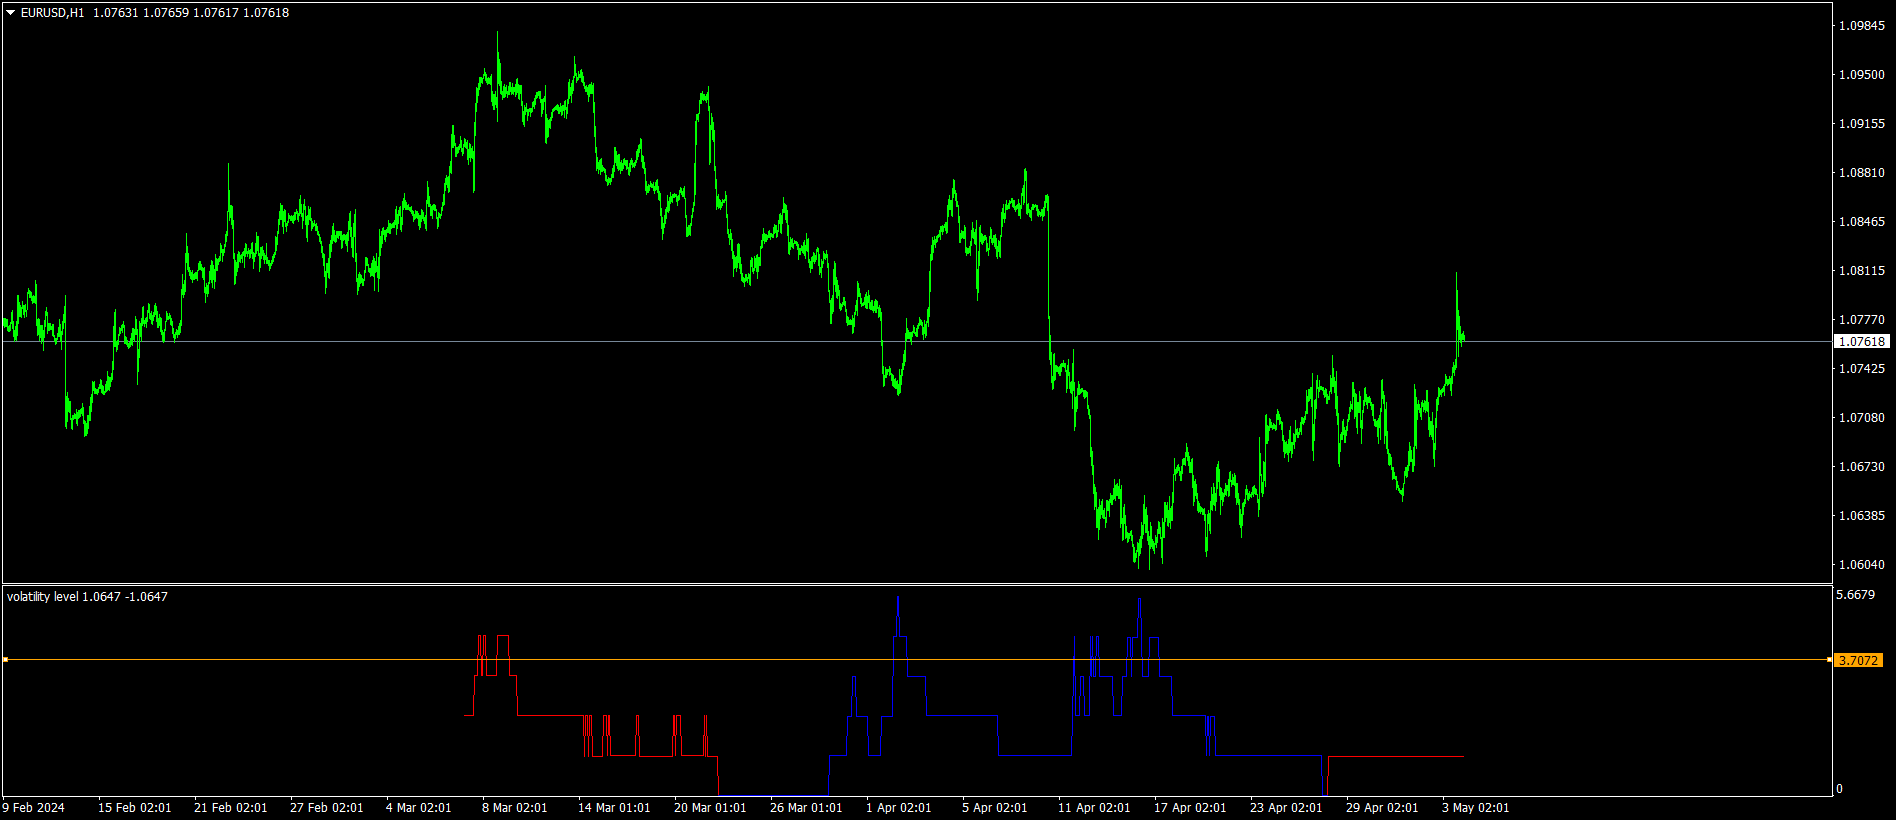
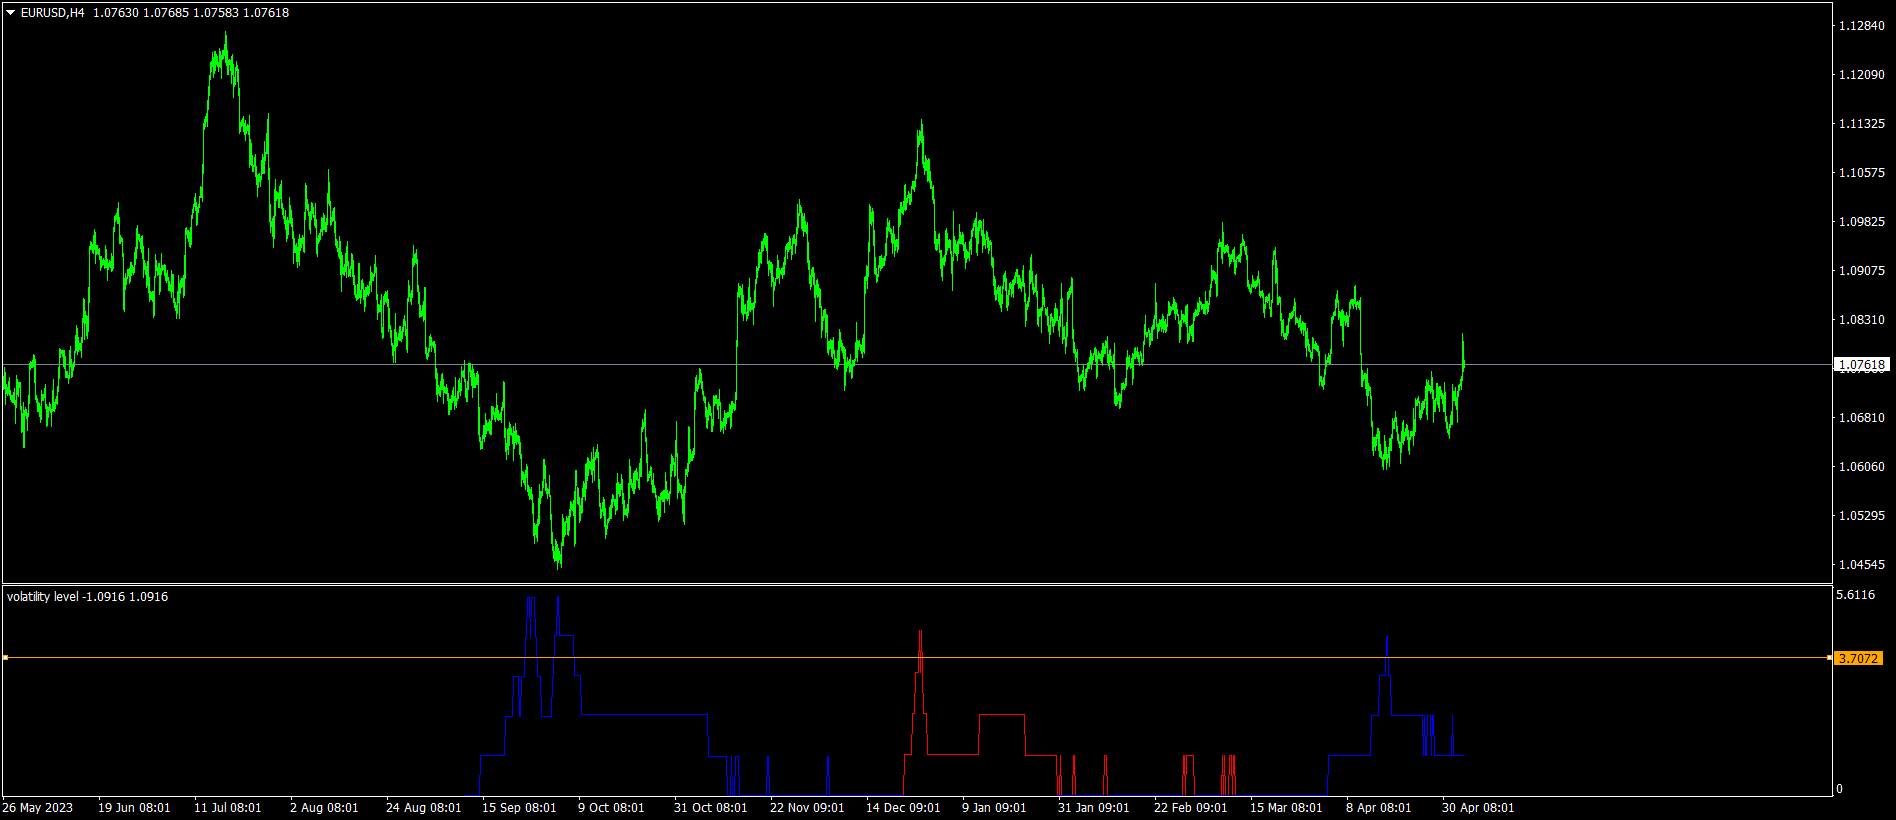
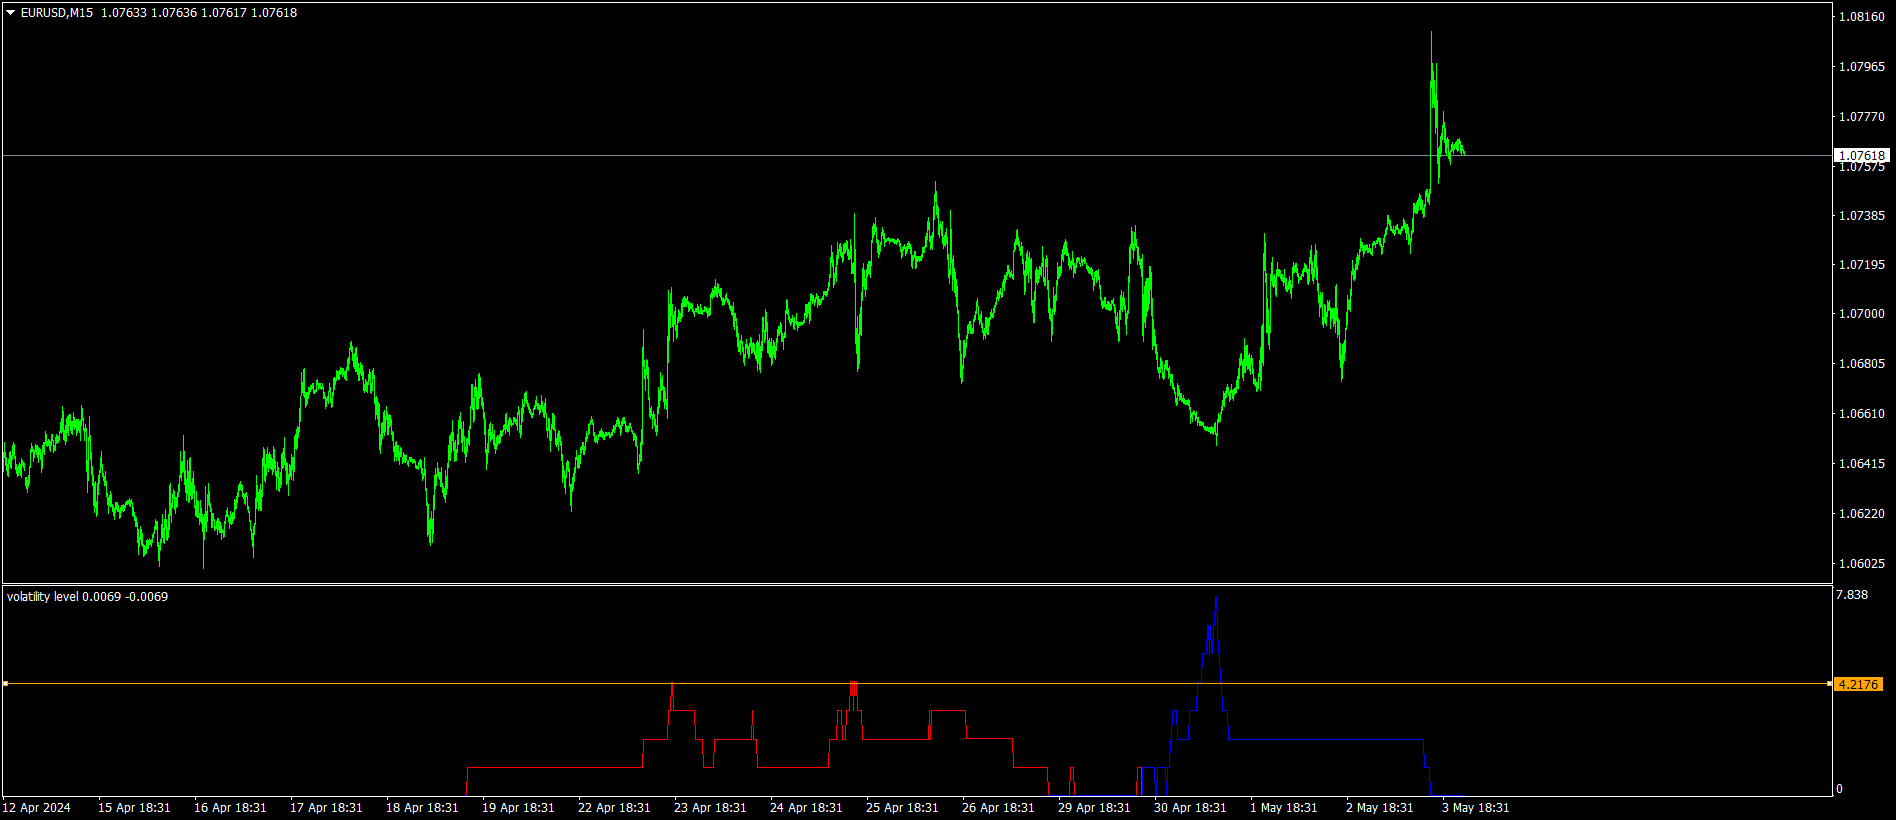
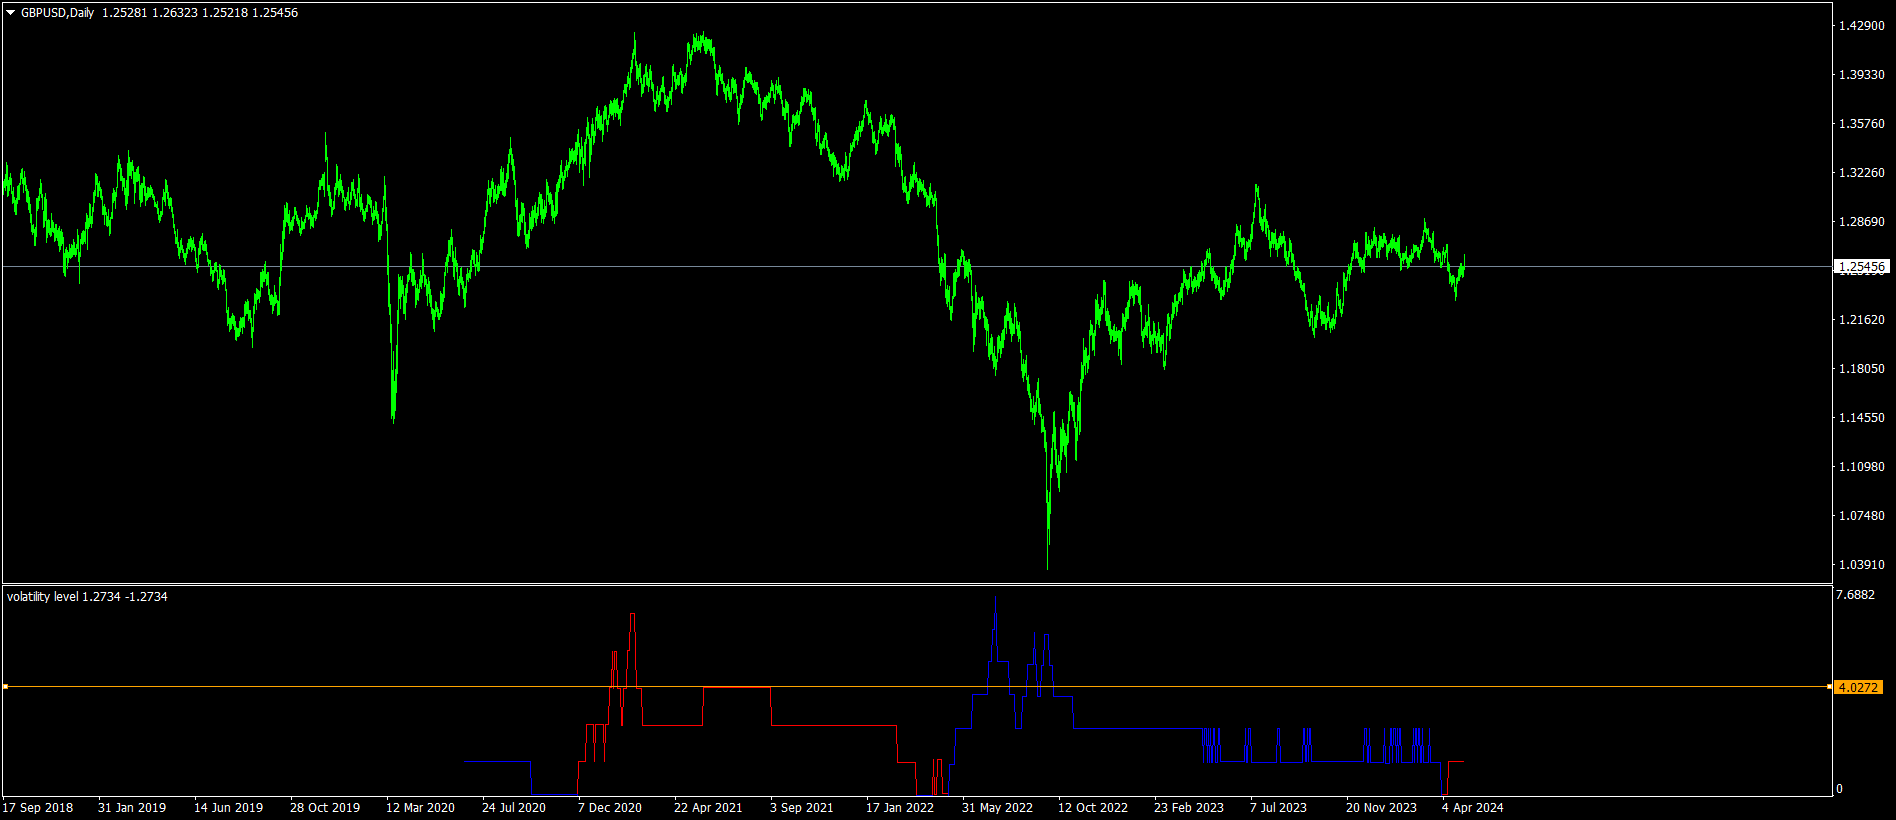
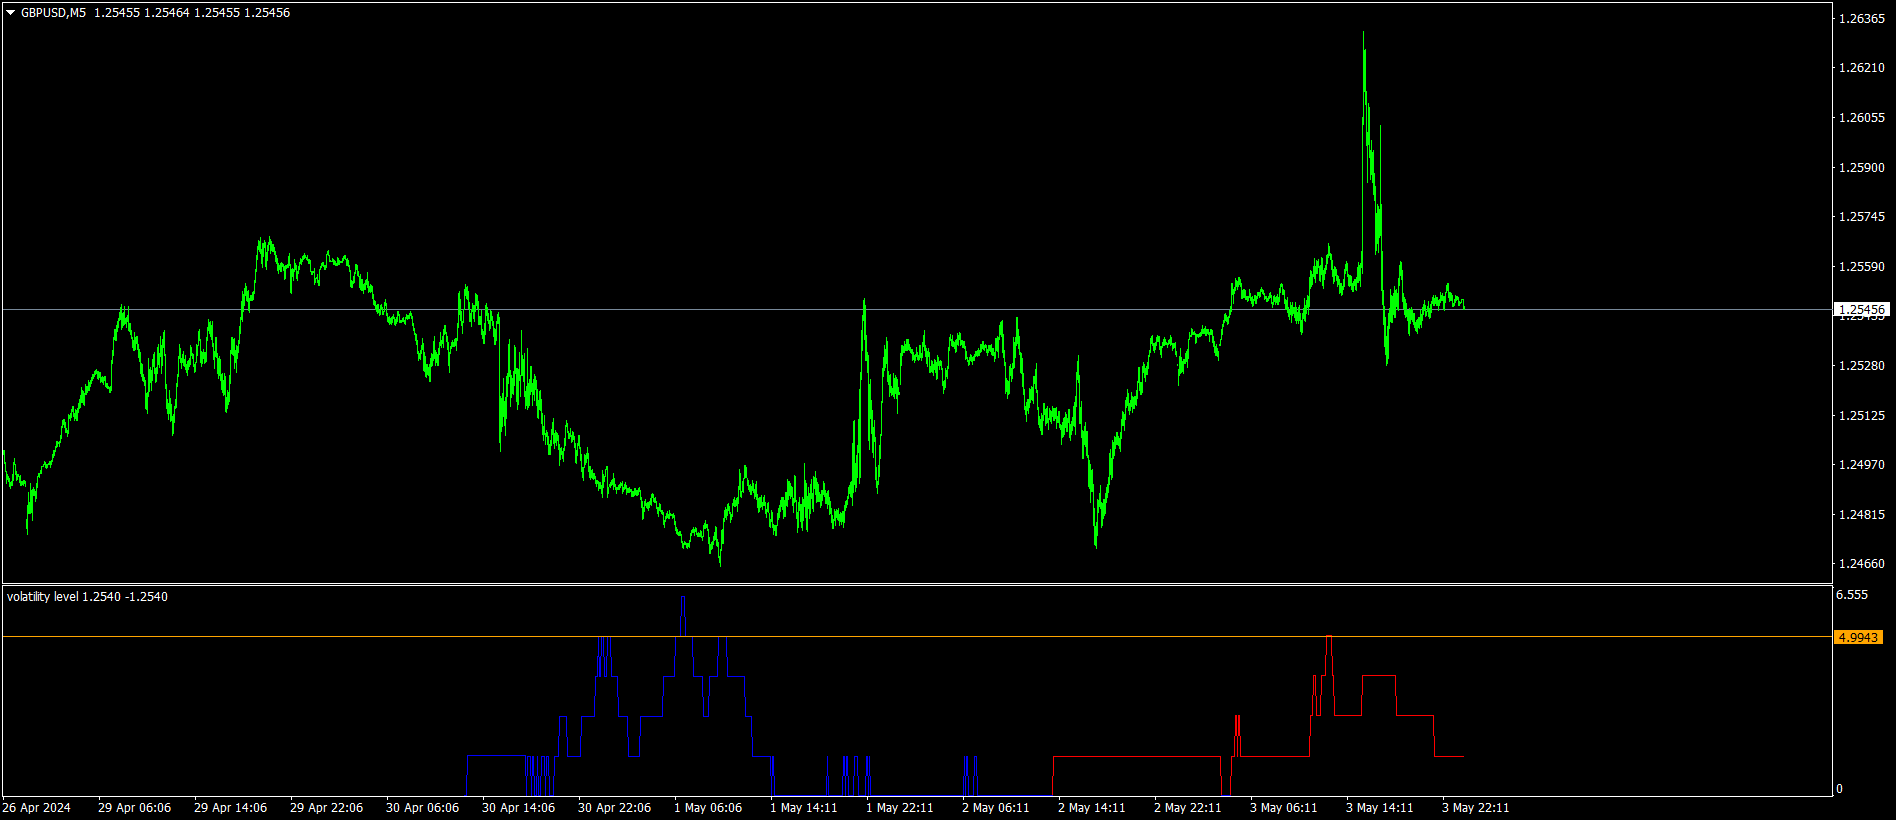
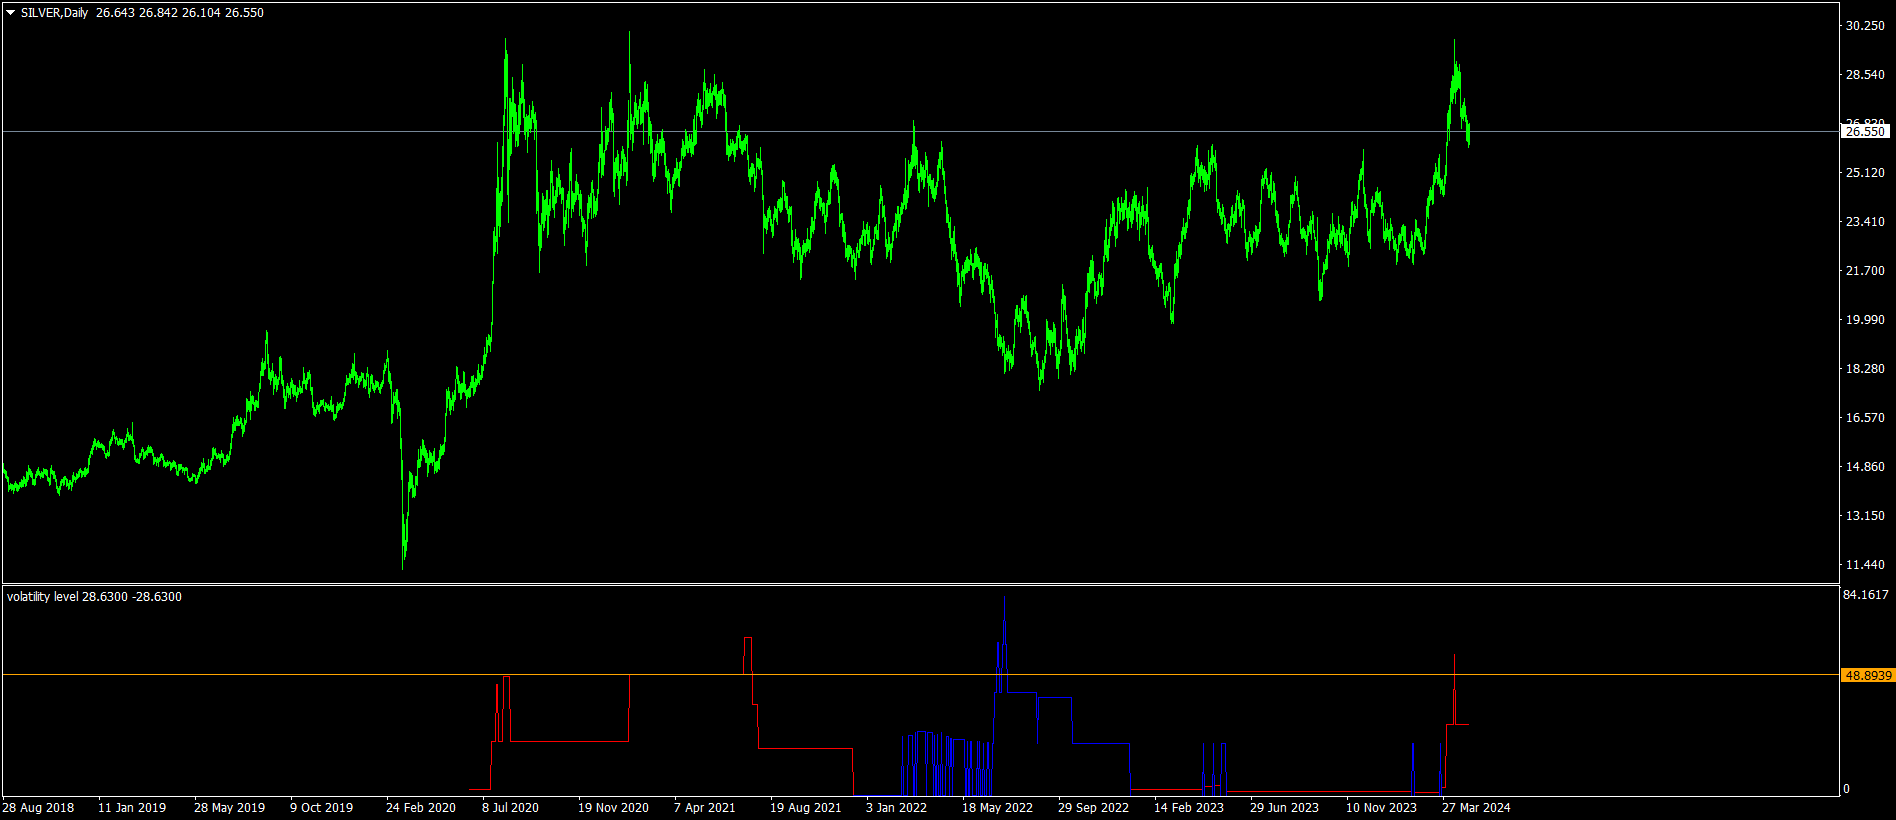
Der Volatilitätslevel-Indikator ist ein Volatilitätsoszillator, der Trendumkehrpunkte anzeigt.
Preis Trends hat reverese, wenn die Volatilität inreased.
dieser Indikator zeigt Trendumkehrpunkte Volatilität.
meist gleiches Niveau nach oben und unten Volatilität ist Umkehrpunkte.
rote Farbe zeigt Punkte der Volatilität nach oben. und wahrscheinlich Trend wird nach unten.
blaue Farbe Oszillator zeigt tiefen Punkt des Preises, wenn erhöhte volatiliyty.
Auf den Bildern sind die horizontalen Linien des Oszillators von Hand gezeichnet, um das vorherige Niveau zu sehen und jetzt zu vergleichen.

This indicator really changed my mindset for a long time, after being discouraged by so many trend-based indicators. Actually, no market players knows where the price will move. Moreover, an indicator. So basically, all trend indicators will always be misleading to follow. But the activities of impulsive market players can show concrete signs that the price will move in a certain direction. And this indicator is quite capable of providing predictions of the oddities of the activity, which is reflected in its volatility. I use this as a primary guide, along with other price action indicators.