Conheça o Mercado MQL5 no YouTube, assista aos vídeos tutoriais
Como comprar um robô de negociação ou indicador?
Execute seu EA na
hospedagem virtual
hospedagem virtual
Teste indicadores/robôs de negociação antes de comprá-los
Quer ganhar dinheiro no Mercado?
Como apresentar um produto para o consumidor final?
Indicadores Técnicos para MetaTrader 4 - 13

US30 Revolt a Technical indicator that is 100% non-repaint and appears on the current candlestick works on all timeframes (recommended M15,M30,H1) The indicator is made for US30 but it can be used on other pairs as well When a blue arrow appears look for buying opportunities When a orange arrow appears look for selling opportunities Please watch the YouTube video on how to properly set up and use the indicator
FREE

Unlock Smarter Trading with Trend-Sensing Pro Are you tired of confusing charts and late signals? Trend-Sensing Pro is a powerful yet simple indicator designed to help you see market trends with crystal clarity. It combines the smoothness of an EMA (Exponential Moving Average) with a unique candle visualization, giving you a clean, noise-free view of the market's direction. Why You'll Love Trend-Sensing Pro See the True Trend : Trend-Sensing Pro cuts through market noise, making it easy to ident
FREE
Highly configurable Stochastic indicator.
Features: Highly customizable alert functions (at levels, crosses, direction changes via email, push, sound, popup) Multi timeframe ability Color customization (at levels, crosses, direction changes) Linear interpolation and histogram mode options Works on strategy tester in multi timeframe mode (at weekend without ticks also) Adjustable Levels Parameters:
Stochastic Timeframe: You can set the lower/higher timeframes for Stochastic. Stochastic Bar Sh
FREE

How To Use
Check out this post for detailed description on All Indicator extras and template: https://www.mql5.com/en/blogs/post/758259
The Best Heiken Ashi System is a simple trading system for trading based only two indicators for generate signals: Heiken ashi smoothed and Vqzz indicator multi-timeframe. The system was created for scalping and day trading but can also be configured for higher time frames. As mentioned, the trading system is simple, you get into position when the two indica
FREE

Este é um produto gratuito que pode utilizar de acordo com as suas necessidades!
Também aprecio muito os seus feedbacks positivos! Muito obrigado!
Clique aqui para ver robôs e indicadores de negociação de alta qualidade!
Forex Indicator Spread Display para MT4, ótima ferramenta auxiliar de negociação.
- O indicador Spread Display mostra o spread atual do par forex onde está anexado. - É possível localizar o valor de visualização do Spread em qualquer canto do gráfico: 0 - para o canto super
FREE
This indicator is the mql version of the Linear Regression Candles indicator. Find out more here: https://www.mql5.com/en/users/rashedsamir/seller There are many linear regression indicators out there, most of them draw lines or channels, but this one actually draws a chart.This script includes features such as linear regression for open, high, low, and close prices, signal smoothing with simple or exponential moving averages. I welcome your suggestion for improving the indicator.
To incre
FREE

FX Correlation Matrix is a powerful multi-timeframe dashboard that helps traders analyze real-time currency correlations of up to 28 symbols at a glance. With customizable settings, sleek design, and manual symbol selection option, it enhances trade accuracy, reduces risk, and identifies profitable correlation-based opportunities. Setup & Guide: Download MT5 Version here. Exclusively for you: It's your chance to stay ahead of the market. Follow our MQL5 channel for daily market insights, char

** All Symbols x All Timeframes scan just by pressing scanner button ** *** Contact me to send you instruction and add you in "Wolfe Wave Scanner group" for sharing or seeing experiences with other users. Introduction: A Wolfe Wave is created with five-wave patterns in price. It shows supply and demand and a fight towards a balance price. T hese waves of price actions can help traders identify the boundaries of the trend . Also It helps forecast how the price will move in the near future
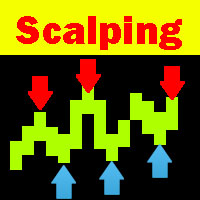
O Scalping Explorer é um sistema de negociação completo. Nossos traders testaram e otimizaram seu trabalho para o máximo efeito. Negociar com o Scalping Explorer é fácil. Abra nas janelas do Metatrader4 com pares de moedas: EURUSD, GBPJPY, GBPUSD, AUDUSD, USDCHF. Nós incluímos o timeframe D1 em todos os pares de moedas. Adicione o indicador Scalping Explorer a cada janela com um par de moedas. Nas configurações do indicador, encontramos o parâmetro "Signal" e definimos como TRUE. Agora, assim q
ALL MOVING AVERAGES: O Indicador Personalizado Definitivo para Diversas Estratégias O indicador personalizado ALL MOVING AVERAGES é a sua ferramenta essencial para uma análise técnica aprofundada, apresentando uma impressionante coleção de mais de 31 das médias móveis mais populares . Projetado para traders experientes e iniciantes, este indicador oferece flexibilidade incomparável, permitindo que você adapte perfeitamente suas médias móveis a uma ampla gama de estratégias de negociação. Com uma
FREE

Two Period RSI compares long-term and short-term RSI lines, and plots a fill between them for improved visualization. Fill is colored differently according to an uptrend (short period RSI above long period RSI) or a downtrend (short period RSI below long period RSI). Short-term RSI crossing long-term RSI adds a more robust trend confirmation signal than using single period RSI alone. This is a small tool to help visualize and confirm RSI trends. We hope you enjoy! Looking for RSI alerts? You can
FREE
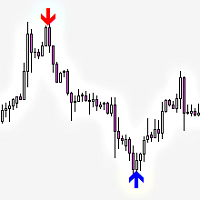
Railway Tracks Pattern — Reversal Pattern Indicator Railway Tracks Pattern is an indicator that automatically detects a powerful two-candle reversal pattern on the chart. It looks for two candles with opposite directions (bullish and bearish), similar in size, and with minimal wicks — a clear sign of momentum shift. How it works: The first candle is strong and directional. The second candle moves in the opposite direction and is of similar size. Both candles have small shadows (wicks). The
FREE

MACD divergence Simple edition 原始MACD计算方式,升级为双线MACD,使判断更加直观更加贴合大宗交易平台的研究习惯,同时还会自动用实线标出背离,不用再从0开始苦学钻研。
同时,我还提供了提醒服务,在你忙于家务无暇顾及的时候只需要打开音响,一旦达成背离,第一时间就会让你知晓。
这是一款简单版的看背离指标,MACD的九天均线被称为“信号线”,然后绘制在MACD线的顶部,它可以作为买入和卖出信号的触发器。当MACD越过信号线时,交易员可以买入操作,当MACD穿过信号线以下时,交易者可以卖出或做空操作。移动平均收敛-发散(MACD)指标可以用几种方法解释,但更常见的方法是交叉、散度和快速上升/下降。
FREE

Ou (BD%), que é um índice de volatilidade que mede a volatilidade em porcentagem ao invés de pontos. A ideia do BD% é fazer um índice dependendo do Desvio Padrão Clássico (CSD) que se move entre 0 e 100 por cento.
Você pode usar BD% para comparar a volatilidade do mesmo título em diferentes períodos de tempo ou intervalos de tempo diferentes. Além disso, você pode usar BD% para comparar a volatilidade entre diferentes títulos em diferentes mercados em termos de porcentagem, em vez de pontos.

Dashboard uses Ichimoku Strategy to find best trades.
Get extra Indicators/Template: And read more about detailed Product Description and usage here: https://www.mql5.com/en/blogs/post/747457
Read more about Scanner Common features in detail here: https://www.mql5.com/en/blogs/post/747456
Features:
Price Kumo Breakout Tenkan-Kijun Cross Chikou/CLoud and Chikou/Price Support/Resistance (SR-SS or SR-NRTR) Stochastic OB/OS and back Awesome Oscillator Higher Timeframe Ichimoku Trend Align

Este indicador detecta entradas com base na teoria do padrão Bystra e fornece valores de entrada para colocar ordens limitadas com níveis de alvo e stop. Isso permite que você calcule o seu percentual de risco. Notas: Este indicador possui buffers que permitem seu uso em Consultores Especialistas (EAs). É importante praticar uma boa gestão do dinheiro ao trabalhar com este produto. Quando você altera o seu período de tempo, O indicador salvará o modelo usado na sua última sessão. Se você precisa
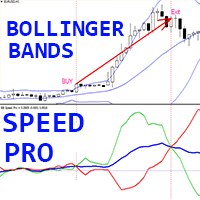
Indicador exclusivo de tendência Crypto_Forex "Bollinger Bands Speed Pro" para MT4, sem repintura.
- O cálculo deste indicador é baseado em equações da física. - A velocidade é a primeira derivada das Bandas de Bollinger padrão. - O indicador Bollinger Bands Speed Pro mostra a velocidade com que as linhas médias e as bordas do BB mudam de direção. - Por padrão: A linha azul é a velocidade da linha média do BB, a linha vermelha é a velocidade da borda inferior e a verde é a velocidade da bo

Esta é uma estratégia simples baseada nos níveis BREAKOUT e FIBONACCI.
Depois de uma fuga,
ou, o mercado continua a mover-se diretamente para os níveis 161, 261 e 423
ou, retorna ao nível de 50% (também chamado de correção) e depois disso provavelmente continua o movimento na direção inicial para os níveis 161, 261 e 423.
A chave do sistema é a detecção da barra de ruptura indicada com um objeto retângulo verde (TENDÊNCIA DE CIMA) ou vermelho (TENDÊNCIA DE BAIXO).
No momento do rompimento,

This indicator Super Channel Pro Pluss indicator.Indicator displays trend movement. Indicator calculates automatically line. Features
FiltPer - displays indicator channel period. deviation - displays indicator channel deviation. deviation2 - displays indicator channel deviation. deviation3 - displays indicator channel deviation. How to understand the status: If the arrow is up and line color Teal ;trend is up. If the arrow is down and line color Red; trend is down. If the arrow is Yellow close

Universal author's strategy, allows to determine the entry points for Buy and Sell both in the direction of the trend, on the reversals of trends and in the flat market. The indicator is equipped with a unique scanner which each tick analyzes the price chart, calculates optimal levels and patterns for finding entry points by one of the 3 strategies. Each of the strategies combines author formulas and algorithms, for optimal trading we recommend using 3 strategies simultaneously as they are compl

This indicator provides the ability to recognize the SMC pattern, essentially a condensed version of the Wyckoff model. Once the pattern is confirmed by RTO, it represents a significant investment opportunity. There are numerous indicators related to SMC beyond the market, but this is the first indicator to leverage patterns to identify specific actions of BigBoy to navigate the market. Upgrade 2024-03-08: Add TP by RR feature. The SMC (Smart Money Concept) pattern is a market analysis m

Descubra o Futuro da Negociação com o Golden Arrow Scalper ! Desenvolvido pelo renomado Felipe FX, o Golden Arrow Scalper é a próxima geração de indicadores de trading, projetado para proporcionar uma experiência de negociação intuitiva e eficiente. Com funcionalidades avançadas e uma interface amigável, este indicador é a ferramenta perfeita para traders de todos os níveis. Principais Funcionalidades: Sinal de Entrada Fácil: Identifique pontos de entrada ideais com base em cruzamentos d

Título do produto Smart RSI (MT4) – parte da série SmartView Descrição breve Indicador RSI com experiência de usuário única na plataforma MetaTrader. Oferece capacidades avançadas não disponíveis anteriormente, como abrir configurações com duplo clique, ocultar e mostrar indicadores sem excluí-los, e exibir a janela do indicador em tamanho completo do gráfico. Projetado para funcionar perfeitamente com o restante da série SmartView Indicators. Visão geral A série SmartView oferece uma experiênci
FREE

Necessary for traders: tools and indicators Waves automatically calculate indicators, channel trend trading Perfect trend-wave automatic calculation channel calculation , MT4 Perfect trend-wave automatic calculation channel calculation , MT5 Local Trading copying Easy And Fast Copy , MT4 Easy And Fast Copy , MT5 Local Trading copying For DEMO Easy And Fast Copy , MT4 DEMO Easy And Fast Copy , MT5 DEMO Bandas de Bollinger Avançadas:
1. O trilho Bollinger mudará de cor com a direção "
2. A expa
FREE

Heikin Ashi is Japanese for "average bar", and may make it easier for you to identify trends. Our version of this popular indicator adjusts the size of the candles based on the zoom level of your chart, making it appear more naturally just like the traditional candlesticks. The colors are selected based on the color scheme you use on your charts, but can be customized anyway you would like. You may also choose whether to display only the Heikin Ashi candles, or show the other selected chart as w
FREE

MP Candle Countdown indicator with a progress bar is a tool used in technical analysis that displays the time remaining until the current candlestick on a chart closes, along with a progress bar that shows visually the amount of time that has elapsed since the candlestick opened. This indicator can be helpful for traders who use candlestick charting to make trading decisions, as it provides both a visual representation of the time left until a candlestick closes and an indication of how much ti
FREE
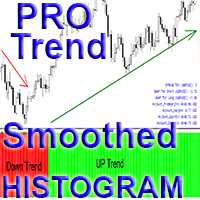
Indicador Crypto_Forex "Histograma de Tendência Suavizado Profissional" para MT4, sem necessidade de repintura.
- O indicador Histograma de Tendência Suavizado Profissional é muito mais eficiente do que qualquer cruzamento de Médias Móveis padrão. - É especialmente focado na detecção de grandes tendências. - O indicador possui 2 cores: Vermelho para tendência de baixa e Verde para tendência de alta (as cores podem ser alteradas nas configurações). - Com alertas para dispositivos móveis e PC. -

O indicador " ZigZag on Trend " ajuda a determinar a direção do movimento do preço, além de contar com um contador de barras e pips. É constituído por um indicador de tendência, uma linha de tendência representada em ziguezague que acompanha a direção do preço e um contador que calcula o número de barras percorridas na direção da tendência e o número de pips na escala vertical (os cálculos baseiam-se na abertura da barra). O indicador não repinta. Para maior comodidade, é apresentado como barras

Alan Hull's moving average, more sensitive to the current price activity than the normal MA. Reacts to the trend changes faster, displays the price movement more clearly. Color version of the indicator. Improvement of the original version of the indicator by Sergey <wizardserg@mail.ru>. Suitable for all timeframes.
Parameters Period - smoothing period, recommended values are from 9 to 64. The greater the period, the smoother the indicator. Method - smoothing method, suitable values are 0, 1, 2
FREE

The TrueChannel indicator shows us the true price movement channels. This indicator resembles Donchian Channel in its appearance, but is built on the basis of completely different principles and gives (in comparison with Donchian Channel , which is better just to use to assess volatility) more adequate trading signals. As shown in the article , the price actually moves in channels parallel to the time axis and jumps abruptly from the previous channels to the subsequ
FREE

Desenhe automaticamente os níveis de apoio e resistência MAIS espaços de velas de propulsão no seu gráfico, para que possa ver para onde é provável que o preço se dirija a seguir e/ou potencialmente inverta.
Este indicador foi concebido para ser utilizado como parte da metodologia de negociação de posições ensinada no meu website (The Market Structure Trader) e exibe informação chave para a segmentação e potenciais entradas.
Existem 2 características CORE no indicador e 4 características adic

Título do produto Smart ZigZag (MT4) – parte da série SmartView Descrição breve Indicador ZigZag com experiência de usuário única na plataforma MetaTrader. Oferece capacidades avançadas não disponíveis anteriormente, como abrir configurações com duplo clique, ocultar e mostrar indicadores sem excluí-los, e exibir a janela do indicador em tamanho completo do gráfico. Projetado para funcionar perfeitamente com o restante da série SmartView Indicators. Visão geral A série SmartView oferece uma expe
FREE

Apresentamos-lhe um indicador que não só melhora o aspeto visual do gráfico, como também lhe confere um carácter vivo e dinâmico. O nosso indicador é uma combinação de um ou mais indicadores de média móvel (MA), que mudam constantemente de cor, criando um aspeto interessante e colorido.
Este produto é uma solução gráfica, por isso é difícil descrever o que faz em texto, é mais fácil de ver descarregando-o, além de que o produto é gratuito. Este indicador é adequado para bloggers que queiram cr
FREE

as the name suggest Trend Maker Master is a trend scalping indicator that give long and short trading opportunity based on price action and ma style trend filter, the indicator Trend Period and Trend Extra Filter will change arrows signals quality and frequency, this leave a space for trader to come out with good combos for each pair. How to trade : Buy : when white buy arrow prints, set sl below recent swing low, and set tp to 1-1 Risk to reward ratio. Sell : when white Sell arrow prints, set
FREE

TRADING FLOW USING AUTO FIBO MUSANG + ALERT SIGNAL 1. Wait for Breakout Alert (Auto Signal) The Auto Fibo Musang system will automatically trigger an alert when a potential breakout is detected from previous price structure.
This serves as the early signal that the market may be ready to move. 2. Identify the Entry Zone (Auto Fibo Levels) The entry zones are auto-plotted based on Fibonacci Musang levels :
Buy Zone (blue levels), Sell Zone (red levels).
No need to draw manu
FREE

Was: $249 Now: $99 Market Profile defines a number of day types that can help the trader to determine market behaviour. A key feature is the Value Area, representing the range of price action where 70% of trading took place. Understanding the Value Area can give traders valuable insight into market direction and establish the higher odds trade. It is an excellent addition to any system you may be using. Blahtech Limited presents their Market Profile indicator for the MetaTrader community. Ins
As every ZigZag Indicator this Indicator Repaints . So use this only combining with other indicators or strategy.
CyberZingFx ZigZag Arrow MT4 Indicator, is one of the best tool for traders looking to identify trend reversals in the markets. This powerful indicator uses the ZigZag method to help you identify key support and resistance levels, making it easier to spot significant changes in price and filter out short-term fluctuations. With CyberZingFx ZigZag Arrow, you can quickly and easily
FREE

Heikin Ashi Binary – Indicador de suporte visual de tendência com exibição binária Visão geral Heikin Ashi Binary é um indicador para MetaTrader que exibe informações de tendência de Heikin Ashi em formato binário (blocos de duas cores) em uma subjanela.
Em vez de velas tradicionais, o indicador mostra períodos de alta (tendência de subida) e baixa (tendência de descida) como blocos coloridos simples.
Isso permite identificar rapidamente a continuidade ou a reversão de tendências. É útil para tr
FREE
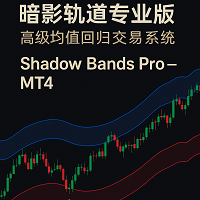
Shadow Bands Pro – MT4 说明(中英文) English Description (MT4) Shadow Bands Pro – Advanced Reversion System for MT4 Shadow Bands Pro is a non-repainting (on candle close) trend-reversal and mean-reversion indicator designed for traders who need clear, rule-based entries and exits.
By combining a dynamic volatility band, entity-break logic, and a built-in statistics panel, it helps you quickly see where price is stretched and where high-probability reversals may occur. Key Features Non-repainting on
FREE

Indicator designed for both beginners and professionals. RECOMMEHDATION Trade with this indicator for 2-3 weeks and you will feel significant progress in your trading. This indicator is developed based on the use of HMA, Laguerre, CCI . The indicator is clear and does not require any setting. Does not redraw and works by opening bar. It works on timeframes M1-D1. I use timeframe M5 to enter the market.
FREE

This is a Sharkfin Arrows Indicator. Detailed explanation and TDI extras: https://www.mql5.com/en/blogs/post/759138
This indicator will show only Arrows. It does not have TDI symbols on chart. Please get the extras from links above for TDI indicators.
Sharkfin Scanner (paid): https://www.mql5.com/en/market/product/123566
TDI Scanner Dash (paid): https://www.mql5.com/en/market/product/41826
About: This Indicator finds the Shark Fin Pattern. It will show an arrow in the current bar if RSI sha
FREE

A classical MACD indicator where both the MACD line and the Signal line are displayed as lines. The difference between MACD and Signal line is displayed as a histogram. A user can change the color and thickness of histogram lines. So, histogram lines can be grouped into four different groups: positive ascending, positive descending, negative descending and negative ascending. Multi-currency Dashboard for the indicator is available https://www.mql5.com/en/market/product/72354
FREE

his indicator automatically identifies key support and resistance levels by analyzing volume patterns. Unlike traditional S/R tools that rely only on price, Volume S/R finds levels where the market truly reacted. DETECTION LOGIC: - High Volume Zones: Price levels where strong buying/selling occurred - Low Volume Zones: Areas of weak interest - potential breakout or reversal zones
SMART FILTERING: - Nearby levels are automatically merged to avoid chart clutter - Maximum levels limit keeps yo
FREE

VeMAs é uma ferramenta de negociação inovadora projetada para aprimorar sua estratégia de negociação por meio da análise da dinâmica do volume e da estrutura do mercado. Seja você um operador iniciante ou experiente, a VeMAs lhe dá uma vantagem. O indicador VeMAs está disponível por apenas US$ 50. O preço original do indicador é de US$ 299
OFERTA POR TEMPO LIMITADO. Entre em contato comigo após a compra para obter um bônus personalizado! Você pode obter gratuitamente um utilitário interessante (

Just another plain Super Trend indicator.
On this one i have added another buffer (on index 2) which can be used on EA; the values is -1 to identify a bearish trend while for bullish trend the value is 1.
Here a code snippet:
int trend = ( int ) iCustom ( NULL , Timeframe, "SuperTrend" , Period , Multiplier, 2 , 1 ); It work on every timeframe.
If you need help to integrate it on your EA, don't hesitate to contact me.
FREE

VWAP para Scalpers
Linhas VWAP cientes de sessão para scalps rápidos e precisos. ️ Entradas (MT4/MT5) Enable_Hourly_VWAP: Ativar VWAP por hora. Enable_Asia_VWAP: Ativar VWAP da sessão Ásia. Enable_Europe_VWAP: Ativar VWAP da sessão Europa. Enable_NA_VWAP: Ativar VWAP da sessão América do Norte. Enable_Extended_VWAP: Ativar VWAP da sessão estendida. Enable_Daily_VWAP: Ativar VWAP diário. Sessão Ásia (GMT) Session_Asia_Start_Hour: Hora de início da sessão Ásia. Session_Asia_End_Hour: Hora de tér
FREE

Tipu Trend is a non-lag, non-repaint, smart indicator, that shows the trend of selected time frames.
Features Customizable Buy/Sell alerts, push alerts, email alerts, or visual on-screen alerts. As easy to trade indicator that smooths the noise in the price action. Highlights ranging markets. Add Tipu Panel (found here ) and unlock the following additional features. An easy to use Panel that shows the trend + signal of the selected time frames. Customizable Panel. The panel can be moved to any
FREE

Melhore a precisão da sua negociação com o Sessões de negociação WH MT4 indicador para MetaTrader 4! Esta ferramenta poderosa ajuda você a visualizar e gerenciar as principais sessões de mercado sem esforço. Baseado em: Indicador WH SMC MT4
Versão MT5: Sessões de negociação WH MT5 Principais características: Painel GUI interativo – Selecione e alterne facilmente entre Ásia, Londres e Nova York sessões de negociação.
Alertas e configurações personalizáveis
FREE

O Oscilador de Índice de Precisão (Pi-Osc) de Roger Medcalf da Precision Trading Systems
A Versão 2 foi cuidadosamente reconfigurada para carregar rapidamente em seu gráfico, e algumas outras melhorias técnicas foram incorporadas para aprimorar a experiência.
O Pi-Osc foi criado para fornecer sinais precisos de temporização de negociações projetados para encontrar pontos de exaustão extremos, os pontos para os quais os mercados são forçados a ir apenas para tirar as ordens de todos.
Este pro
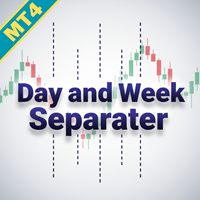
Optimiza tu análisis de trading con el Day and Week Separator MT4, una herramienta intuitiva diseñada para trazar líneas separadoras diarias y semanales personalizables, perfecta para traders que enfrentan diferencias de zonas horarias con sus brokers. Muy apreciada en comunidades de trading como Forex Factory y Reddit’s r/Forex por su simplicidad y eficacia, este indicador aborda el desafío común de alinear los marcos temporales de los gráficos con horarios locales o específicos del mercado, co
FREE

MarketSessions Indicator The Essential Tool for Global Market Session Visualization The MarketSessions indicator is a powerful MT4 tool designed to help traders visualize major forex market sessions directly on their charts. By clearly displaying the active trading hours of Sydney, Tokyo, London, and New York markets, this indicator helps you identify optimal trading periods and understand market volatility patterns. Key Features: Clear visualization of all four major trading sessions (Sydney, T
FREE
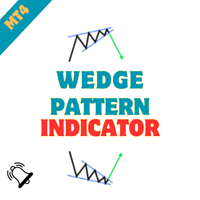
Wedge Chart Pattern Indicator - Unleash the Power of Wedge Patterns in Your Trading Embark on a journey of precision trading with the "Wedge Chart Pattern Indicator." Crafted for MetaTrader, this advanced tool is your ultimate companion for identifying wedge chart patterns, empowering you to make informed and strategic trading decisions. Whether you're a seasoned trader or just starting, this indicator simplifies the process of spotting wedge patterns, providing you with a valuable edge in the m
FREE

ECM Elite Channel é um indicador baseado na volatilidade, desenvolvido com um algoritmo de tempo especifico, que consiste em encontrar possíveis correções no mercado.
Este indicador mostra duas linhas exteriores, uma interior (linha de retração) e um sinal de seta, onde a teoria do canal consiste em ajudar a identificar condições de sobrecompra e sobrevenda no mercado.
O preço do mercado cairá geralmente entre os limites do canal. Se os preços tocarem ou se moverem para fora do canal é uma op

Breakout Sniper draw trendlines by using improved fractals and plots the breakout and reversal points.
NO REPAINT AUTOMATED TRENDLINES MULTI TIMEFRAME
*** SINCE THE STRATEGY TESTER OF MT4 PALTFORM DOES NOR SUPPORT, YOU NEED TO TEST "CURRENT TIMEFRAME" INPUTS ONLY.*** A trendline is a line drawn over pivot highs or under pivot lows to show the prevailing direction of price . Trend lines are a visual representation of support and resistance in any time frame. They show direction and speed

Huge 70% Halloween Sale for 24 hours only!
Send us a message after your purchase to receive more information on how to get your BONUS for FREE that works in great combination with Bull vs Bear ! Bull versus Bear is an easy-to-use Forex indicator that gives traders clear and accurate signals based on clear trend retests . Forget about lagging indicators or staring at charts for hours because Bull vs Bear provides real-time entries with no lag and no repaint, so you can trade with confiden

With this indicator you'll have a general reading of the market's range using Gann's calculating modes. Gann's swing is used to have a quick reading to the market latest movements at first glance. The foundation of this swing calculation is in the count of candles in relation to the break-up and break-down of the price. When the price breaks-up the last maximum, the swing will get traced if a certain number of candles is exceeded from the last minimum. It can be used a "pure Gann" or not: If set

Introduction to X3 Chart Pattern Scanner X3 Cherart Pattern Scanner is the non-repainting and non-lagging indicator detecting X3 chart patterns including Harmonic pattern, Elliott Wave pattern, X3 patterns, and Japanese Candlestick patterns. Historical patterns match with signal patterns. Hence, you can readily develop the solid trading strategy in your chart. More importantly, this superb pattern scanner can detect the optimal pattern of its kind. In addition, you can switch on and off individu
Huge 70% Halloween Sale for 24 hours only!
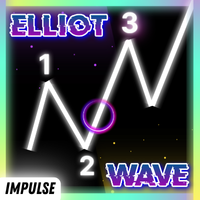
Manual guide: Click here This indicator is unstoppable when combined with our other indicator called Katana . After purchase, send us a message and you could get it for FREE as a BONUS! The Elliot Wave Impulse is a pattern identified in the Elliott Wave Theory, a form of technical analysis used to analyze financial market cycles. The Impulse Wave is considered the strongest and most powerful part of the Elliott Wave cycle, as it represents t

This is an indicator for Quasimodo or Over and Under pattern. It automatically finds the swing points and can even place virtual trades with stop loss and take profit. Press the "Optimize" button to automatically find the most effective settings. The pattern consists of four legs A,B,C,D as shown in the pictures. Open and close prices of the virtual trades are Bid price but the statistics in Display Panel take current spread into account. Its parameters are explained below. Buffer - Pips distanc
FREE
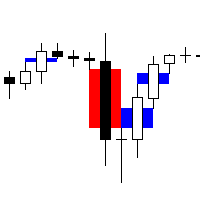
Fair Value Gap Scanner 4 is a sophisticated MetaTrader 5 indicator designed to detect fair value gaps (FVGs) in price action and display them as rectangles directly on the chart. This powerful tool empowers traders by providing visual representations of FVGs, enabling them to identify potential trading opportunities with ease and precision. With customizable parameters for color, width, and style, traders can tailor the indicator's appearance to suit their preferences and trading strategies. Key
FREE

Introduction To Time Box Indicator Time Box Indicator is a must have indicator for any trader. It will display daily, weekly and Monthly box according to your preferences. Yet, you can extend any important price levels in your chart automatically. You can use them as the significant support and resistance levels. It is very simple but effective tool for your trading.
Graphic Setting Use White Chart Line Style for Current Open price
Daily Setting Update Timeframe for daily box Number of days to
FREE

This comprehensive technical indicator calculates and plots up to 3 moving averages with 3 different periods. By employing three moving averages of distinct lookback periods, the trader can confirm whether the market has indeed experienced a change in trend or whether it is merely pausing momentarily before resuming its prior state. SX Golden MA Pack for MT5 is available here . The shorter the moving average period, the more closely it tracks the price curve. When a security initiates an upt
FREE

Exclusive Arrival: Presenting for the First Time . This is your secret weapon for predicting which way the wind will blow with the next market shift. It assists you in developing your trading strategy by predicting the direction of the next candle. Compatible with forex, stocks, and cryptocurrencies on all timeframes, but higher timeframes are recommended. MT5 Version - https://www.mql5.com/en/market/product/108937/ How does it work ? It's pretty neat. The algorithm separates green and red can
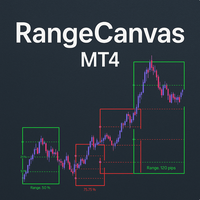
Daily Range Boxes : The indicator draws rectangular boxes around each day's high and low prices, creating a clear visual boundary for the daily trading range. Color-Coded Logic : Green boxes when the current price (or close) is above the daily open Red boxes when the current price is below the daily open Percentage Level Lines : Inside each box, it draws three horizontal lines at: 25% of the daily range 50% of the daily range (midpoint) 75% of the daily range Range Information : Each box displa
FREE
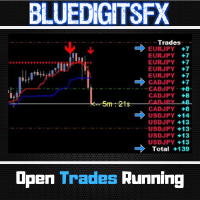
Free Utility Tool by BlueDigitsFx
Designed to improve workflow and trade management
Also available for MetaTrader 5
Optional access to updates & support via the BlueDigitsFx Telegram Assistant Bot BlueDigitsFx Open Trades is a powerful MT4 tool that displays your total pips from all open trades in real time.
Its intuitive color-coded interface quickly indicates winning and losing trades across all currency pairs.
This helps you monitor your trade performance effortlessly, enabling faster d
FREE
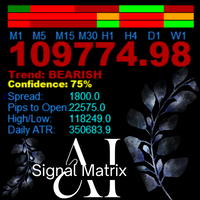
AanIsnaini Signal Matrix Multi-Timeframe Confidence Signal Dashboard AanIsnaini Signal Matrix is a powerful all-in-one indicator that analyzes market direction and confidence levels across multiple timeframes — allowing traders to see the overall bias of the market at a single glance. It combines signals from Price Action , Support–Resistance , and several proven technical tools (MACD, ADX, RSI, MA slope, ATR, and Volume Ratio), then calculates a confidence score showing how strongly th
FREE

The Netsrac Supply&Demand Dashboard shows you at a glance where relevant zones are located on your favorite assets. Open your chart directly from the dashboard and trade zones that really matter. Features
Finds the next relevant supply and demand zone and displays the distance to this zone (in pips) Finds and displays the zones in three different timeframes Calculates a trend indicator for the current and past candle for each configured time frame Opens a chart with your chart template directly

Attention! Friends, since there have been many scammers on the Internet recently selling indicators called ForexGump, we decided to warn you that only on our page is the LICENSE AUTHOR'S VERSION of the INDICATOR sold! We do not sell this indicator on other sites at a price lower than this! All indicators are sold cheaper - fakes! And even more often sold demo versions that stop working in a week! Therefore, in order not to risk your money, buy this indicator only on this site!
Forex Gump Pro is

This indicator allows you to manage your exposure and see how the lot changes. You can choose the optimal lot value for your deposit without opening real positions. And also evaluate new trading instruments. If you trade manually, then risk management will help you avoid unexpected losses. The indicator includes the ability to receive a sound signal when a specified level is reached, as well as send push notifications and a message to the mail.
FREE
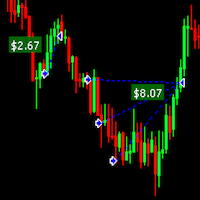
Draw Profit indicator can efficiently help those traders who want to see on the chart all closed positions output: profit or loss. If set DrawProfit on your chart managed by an Expert Advisor (EA) you will see clearly it’s performance by its profits & losses. My other products: https://www.mql5.com/en/users/hoangvudb/seller
Input parameters: Show Profit Labels : show profit of orders with a label (true/false). Profit Mode : available options: Show in currency. Show in pips. Show in currency a
FREE
O Mercado MetaTrader é a única loja onde você pode baixar um robô demonstração de negociação gratuitamente para testes e otimização usando dados históricos.
Leia a visão geral e opiniões de outros clientes sobre os aplicativos, faça o download para o seu terminal e teste um robô de negociação antes de comprá-lo. Apenas no Mercado MetaTrader você pode testar um aplicativo de forma absolutamente gratuita.
Você está perdendo oportunidades de negociação:
- Aplicativos de negociação gratuitos
- 8 000+ sinais para cópia
- Notícias econômicas para análise dos mercados financeiros
Registro
Login
Se você não tem uma conta, por favor registre-se
Para login e uso do site MQL5.com, você deve ativar o uso de cookies.
Ative esta opção no seu navegador, caso contrário você não poderá fazer login.