Смотри обучающее видео по маркету на YouTube
Как купить торгового робота или индикатор
Запусти робота на
виртуальном хостинге
виртуальном хостинге
Протестируй индикатор/робота перед покупкой
Хочешь зарабатывать в Маркете?
Как подать продукт, чтобы его покупали
Технические индикаторы для MetaTrader 4 - 13
Heikin Ashi Binary – Индикатор визуальной поддержки тренда с бинарным отображением Обзор Heikin Ashi Binary — это индикатор для MetaTrader, который отображает информацию о тренде Heikin Ashi в бинарном (двухцветном) формате в отдельном окне.
Вместо традиционных свечей состояния восходящего и нисходящего тренда отображаются в виде простых цветных блоков.
Это позволяет быстро визуально определять продолжение или разворот тренда. Индикатор подходит как для ручной торговли, так и для автоматических
FREE
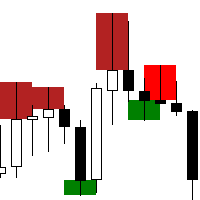
The "Rejection Block" MetaTrader 4 Indicator is a powerful tool designed to assist traders in identifying and visualizing rejection candlestick patterns, commonly referred to as rejection blocks. These patterns play a crucial role in market analysis as they often signify potential reversals or continuations in price movements. Key Features: Rejection Block Detection: The indicator meticulously scans price data to identify instances of rejection candlestick patterns. These patterns typically feat
FREE

FX Correlation Matrix is a powerful multi-timeframe dashboard that helps traders analyze real-time currency correlations of up to 28 symbols at a glance. With customizable settings, sleek design, and manual symbol selection option, it enhances trade accuracy, reduces risk, and identifies profitable correlation-based opportunities. Setup & Guide: Download MT5 Version here. Exclusively for you: It's your chance to stay ahead of the market. Follow our MQL5 channel for daily market insights, char

** All Symbols x All Timeframes scan just by pressing scanner button ** *** Contact me to send you instruction and add you in "Wolfe Wave Scanner group" for sharing or seeing experiences with other users. Introduction: A Wolfe Wave is created with five-wave patterns in price. It shows supply and demand and a fight towards a balance price. T hese waves of price actions can help traders identify the boundaries of the trend . Also It helps forecast how the price will move in the near future
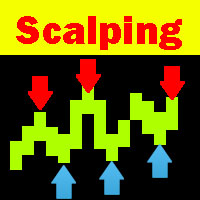
Scalping Explorer - готовая торговая система. Наши трейдеры протестировали и оптимизировали ее работу для получения максимального эффекта. Торговать с Scalping Explorer очень просто. Открываем в Metatrader4 окна с валютными парами: EURUSD, GBPJPY, GBPUSD, AUDUSD, USDCHF. Включаем на всех валютных парах таймфрейм D1. Добавляем в каждое окно с валютной парой индикатор Scalping Explorer. В настройках индикатора находим параметр "Signal" и ставим его TRUE. Теперь как только по любой из валютных пар
Overview
The TTM Squeeze indicator helps identify low volatility periods (squeeze) that often precede price breakouts. It uses Bollinger Bands (BB) and Keltner Channels (KC) to determine when the market is "coiling" and ready to move. Configuration Guide Volatility Settings The indicator uses Bollinger Bands to measure market volatility. When BBs are inside Keltner Channels, a squeeze is detected. The squeeze suggests the market is consolidating and may soon break out. True Range Option Optiona
FREE

Готовы ли вы стать Шерлоком Холмсом форекс-трейдинга? ️️ Представляем вам ультимативный торговый инструментарий: индикатор Lisek Levels and Channels !!! Забудьте о жонглировании несколькими индикаторами, как в цирковом номере. Мы упаковали всё необходимое в одно впечатляющее шоу: Ценовые уровни? Есть! Ценовые каналы? Ещё бы! Ценовой VWAP? О да! Балансовый объём? Всё тут! И вишенка на торте? Сигналы тревоги и push-уведомления, которые разбудят вас быстрее, чем двойной эспрессо! ️
FREE
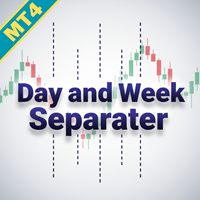
Оптимизируйте анализ торгов с помощью Day and Week Separator MT4 — интуитивно понятного инструмента, предназначенного для построения настраиваемых линий разделения дней и недель, идеально подходящего для трейдеров, сталкивающихся с разницей во временных зонах брокера. Этот индикатор высоко ценится в торговых сообществах, таких как Forex Factory и Reddit (r/Forex), за свою простоту и эффективность, решая распространенную проблему синхронизации таймфреймов графика с местным или рыночным временем,
FREE

Панель MT4 для нескольких таймфреймов Matrix Arrow Indicator - это бесплатное дополнение и отличный актив для вашего Matrix Arrow Indicator MT4 . Он показывает текущий сигнал индикатора Matrix Arrow Indicator MT4 для 5 настраиваемых пользователем таймфреймов и всего для 16 изменяемых символов / инструментов. Пользователь имеет возможность включить / отключить любой из 10 стандартных индикаторов, из которых состоит Matrix Arrow Indicator MT4 . Все 10 стандартных атрибутов индикаторов также настр
FREE

Indicator designed for both beginners and professionals. RECOMMEHDATION Trade with this indicator for 2-3 weeks and you will feel significant progress in your trading. This indicator is developed based on the use of HMA, Laguerre, CCI . The indicator is clear and does not require any setting. Does not redraw and works by opening bar. It works on timeframes M1-D1. I use timeframe M5 to enter the market.
FREE

Или (BD%), который представляет собой индекс волатильности, который измеряет волатильность в процентах, а не в пунктах. Идея BD% состоит в том, чтобы создать индекс, зависящий от классического стандартного отклонения (CSD), который колеблется от 0 до 100 процентов.
Вы можете использовать BD% для сравнения волатильности одной и той же ценной бумаги в разные периоды времени или в разных временных рамках. Кроме того, вы можете использовать BD% для сравнения волатильности между разными ценными бума

MACD Crossover Arrows & Alert is a MT4 (MetaTrader 4) indicator and it can be used with any forex trading systems / strategies for additional confirmation of trading entries or exits on the stocks and currencies market. This mt4 indicator provides a BUY signal if the MACD main line crosses above the MACD signal line . It also displays a Sell signal if the MACD main line crosses below the MACD signal line .
STRATEGY Traders can use the MACD signal alerts from a higher time frame
FREE

Dashboard uses Ichimoku Strategy to find best trades.
Get extra Indicators/Template: And read more about detailed Product Description and usage here: https://www.mql5.com/en/blogs/post/747457
Read more about Scanner Common features in detail here: https://www.mql5.com/en/blogs/post/747456
Features:
Price Kumo Breakout Tenkan-Kijun Cross Chikou/CLoud and Chikou/Price Support/Resistance (SR-SS or SR-NRTR) Stochastic OB/OS and back Awesome Oscillator Higher Timeframe Ichimoku Trend Align
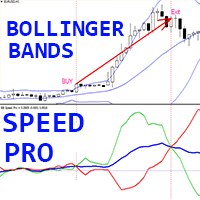
Уникальный трендовый индикатор Crypto_Forex "Bollinger Bands Speed Pro" для MT4, без перерисовки.
- Расчет этого индикатора основан на уравнениях из физики. - Скорость - это 1-я производная стандартных полос Боллинджера. - Индикатор Bollinger Bands Speed Pro показывает, как быстро средняя линия BB и границы BB меняют свое направление. - По умолчанию: синяя линия - это скорость средней линии BB, красная линия - скорость нижней границы, зеленая - скорость верхней границы. - Рекомендуется исп

Это простая стратегия, основанная на уровнях ПРОРЫВА и ФИБОНАЧЧИ.
После прорыва,
либо рынок продолжает движение сразу к уровням 161, 261 и 423
или откатывается к уровню 50% (также называемому коррекцией) и после этого, скорее всего, продолжает движение в исходном направлении к уровням 161, 261 и 423.
Ключом системы является обнаружение бара прорыва, обозначенного зеленым (ВЕРХНИЙ ТРЕНД) или красным (НИЖНИЙ ТРЕНД) прямоугольным объектом.
В момент пробоя целевые уровни Фибоначчи рассчитывают

This indicator Super Channel Pro Pluss indicator.Indicator displays trend movement. Indicator calculates automatically line. Features
FiltPer - displays indicator channel period. deviation - displays indicator channel deviation. deviation2 - displays indicator channel deviation. deviation3 - displays indicator channel deviation. How to understand the status: If the arrow is up and line color Teal ;trend is up. If the arrow is down and line color Red; trend is down. If the arrow is Yellow close

Универсальная авторская стратегия позволяющая определять точки входа на покупку и продажу как в направлении тренда так и на разворотах тенденций, а так же когда рынок находиться во флете. Индикатор оснащен уникальным сканером который каждый тик анализирует график цены, вычисляет оптимальные уровни и паттерны для поиска точек входа по одной из 3 стратегий. Каждая стратегия сочетает в себе авторские формулы и алгоритмы, для оптимальной торговли мы рекомендуем использовать 3 стратегии одновременно,
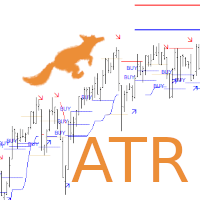
Are you looking for ATR Levels, ATR Trend, ATR Support and Resistance Indicators ? Now you have all in one !!! Info on your chart is showing you: where current price and levels are, what is current trend and signals. Search for an entry with low risk for trading by Lisek ATR Indicator. There are many ways to trade with Lisek ATR Indicator: Trade Support and Resistance Levels. Trade pullbacks (Range trading). Trade breakouts. Trade reversals. Take profit or set stop-loss based on ATR Levels.
FREE
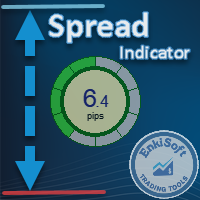
Custom Spread Indicator *Please write a review, thanks!
Also MT5 version is available
Spread Indicator show the current spread in pips with color codes. Handle 3 levels, Low, Medium, High. You can set levels and colors for each level (eg. Low: Green, Medium: Orange, High: Red), and can choose display position on the chart.
There is two spread calculation mode: -> Server spread value -> Ask - Bid value
Can set opacity, for better customization. When spread jump bigger, then display do not
FREE

Скользящая средняя Алана Хала, более чувствительная к текущей ценовой активности, чем обычная MA. Быстрее реагирует на изменение тренда, четче показывает движение цены. Цветная версия индикатора. Развитие оригинальной версии индикатора от Sergey <wizardserg@mail.ru>. Подходит для всех таймфреймов.
Параметры Period - период сглаживания, рекомендуемые значения от 9 до 64. Чем больше период, тем мягче индикатор. Method - метод сглаживания, возможные значения 0, 1, 2 или 3.
FREE

Gold TL MTF – это прекрасный биржевой технический индикатор. Алгоритм индикатора анализирует движение цены актива и отражает трендовые линии по фракталам заданного таймфрейма (ТФ).
Преимущества индикатора: Индикатор выдает сигналы с высокой точностью. Подтвержденный сигнал индикатора не исчезает и не перерисовывается. Торговать можно на торговой платформе MetaTrader 4 любого брокера. Торговать можно любыми активами (валюты, металлы, крипто валюты, акции, индексы и т.д.). Торговать можно на лю
FREE

Откройте будущее торговли с Easy Entry Points! Разработанный известным Фелипе FX, Easy Entry Points - это следующее поколение индикаторов торговли, предназначенное для предоставления интуитивного и эффективного торгового опыта. С передовыми функциями и удобным интерфейсом, этот индикатор идеально подходит для торговцев всех уровней. Основные функции: Сигнал легкого входа: Определите идеальные точки входа на основе пересечений EMA быстрых и медленных, обеспечивая точные и своевременные торговы

The indicator of a Professional Trader - это стрелочный индикатор для прогнозирования направления движения цены. Над этим индикатором я работаю с 2014 года.
Вы можете использовать этот индикатор в качестве основного, использовать его сигналы для входа и использовать его в качестве единственного индикатора для поиска точек входа.
О продукте: Рекомендуемый TF [H4-D1-W1] . Индикатор предсказывает направление движения следующей свечи. Подходят множество инструментов; Гибкость в настройках под ра
FREE

Индикатор показывает на графике к лассические уровни пивота , рассчитанные на основе предыдущего дня. Вы можете выбрать, с какого часа рассчитывать формулу. Торгуйте во флэте на разворот. На трендовом рынке используйте их как цель. Совместите со своими стратегиями для успешной торговли. Уровни строятся с помощью буферов и отображаются на всей доступной истории котировок.
Входные параметры.
Start Hour - с какого часа считать начало дня. 00 - по умолчанию. Show Mid Pivots - отображать промежуто
FREE

Название продукта Smart ADX (MT4) – часть серии SmartView Краткое описание Индикатор ADX с уникальным пользовательским опытом на платформе MetaTrader. Предоставляет расширенные возможности, ранее недоступные, такие как открытие настроек двойным кликом, скрытие и отображение индикаторов без удаления, и отображение окна индикатора на весь размер графика. Разработан для работы вместе с остальными индикаторами серии SmartView. Обзор Серия SmartView предлагает уникальный и отличительный пользовательс
FREE
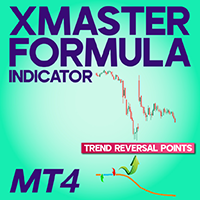
XMaster XHMaster Formula MT4 Indicator – No Repaint Strategy The XMaster / XHMaster Formula Indicator for MetaTrader 4 (MT4) is one of the most popular non-repaint tools used in Forex trading. According to sources like XS.com and TradingFinder, the indicator is designed to detect market direction, momentum strength, and potential reversal areas with high accuracy. This MT4 version blends multiple technical elements—such as EMA-based trend analysis, MACD momentum, RSI and Stochastic oscillators,
FREE

Tipu Trend это умный индикатор без задержек и перерисовывания, который показывает тренд выбранных таймфреймов.
Особенности Настраиваемые алерты Buy/Sell, push-уведомления, сообщения по email и визуальные оповещения на экране. Удобный для торговли индикатор, который сглаживает шум ценовых действий (price action). Выделяет безтрендовые рынки. Добавьте Tipu Panel (находится здесь ) и разблокируйте следующие дополнительные возможности. Легкая в использовании Панель, которая показывает тренд + сигна
FREE

Представляем вам индикатор, который не только улучшает визуальный аспект графика, но и придает ему живой, динамичный характер. Наш индикатор представляет собой комбинацию одного или нескольких индикаторов Moving Average (MA), которые постоянно меняют свой цвет, создавая интересный и красочный вид.
Данный продукт является графическим решением поэтому сложно описывать что он делает текстом, это легче увидеть скачав его, к тому же продукт бесплатный. Данный индикатор подойдёт блогерам, которые хо
FREE
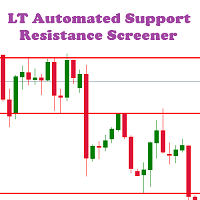
LT Automated Support Resistance Screener is a level indicator or a support resistance indicator that can be used to determine the level of support and resistance values. This indicator is free and easy to used in the Metatrader 4 platform which is built using the MQL4 programming language. Support resistance indicator is an important indicator that is often to used, but it is not available on the MT4 platform. This indicator can be used for all markets like forex, indices, gold etc and all time
FREE

The MACD 2 Line Indicator is a powerful, upgraded version of the classic Moving Average Convergence Divergence (MACD) indicator.
This tool is the embodiment of versatility and functionality, capable of delivering comprehensive market insights to both beginner and advanced traders. The MACD 2 Line Indicator for MQL4 offers a dynamic perspective of market momentum and direction, through clear, visually compelling charts and real-time analysis. Metatrader5 Version | How-to Install Product | How-to
FREE
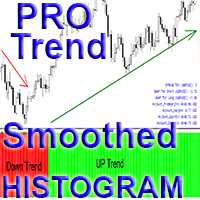
Crypto_Forex Индикатор "Pro Smoothed Trend Histogram" для MT4, без перерисовки.
- Индикатор Pro Smoothed Trend Histogram гораздо эффективнее любого стандартного пересечения скользящих средних. - Он особенно ориентирован на обнаружение крупных трендов. - Индикатор имеет 2 цвета: красный для медвежьего нисходящего тренда и зеленый для бычьего восходящего тренда (цвета можно изменить в настройках). - С оповещениями на мобильных устройствах и ПК. - Отлично сочетается с другими торговыми методами:

Индикатор " ZigZag on Trend " представляет из себя помощника в определении направления движения цены, а так же калькулятора баров и пунктов. Состоит из трендового индикатора, следящей за направлением цены трендовой линией представленной в виде зигзага и счетчика вычисляющего число баров пройденных в направлении тренда и количество пунктов по вертикальной шкале.(расчеты ведутся по открытию бара) Индикатор не перерисовывается. Для удобства исполнен в виде окрашенных баров или в виде линий. Можно и

PLEASE NOTE You can customize the settings of Fast EMA, Slow EMA, MACD SMA & Main SMA. The accuracy will change as per your settings.
100% Non repaint indicator
Pre-alert (get ready) signals
Non-delay indications
24/7 signals
100% No lag
No recalculating The arrows wont repaint even if the signal fails, or you refresh or restart the mt4 Indicator is based on simple crossover strategy of main line and signal line of MACD indicator in consideration with zero line and Main SMA. The best thing
FREE

Индикатор TrueChannel показывает нам истинные каналы движения цены. Этот индикатор своим видом напоминает Donchian Channel , но построен на основе совершенно иных принципов и дает более адекватные торговые сигналы. Как показано в статье цена на самом деле движется в каналах параллельных временной оси и резко – перепрыгивает из предыдущих каналов в последующие. Установить такое движение цены позволяет индикатор Probabilities distribution of price ( PDP ). Индикатор
FREE

Stop Guessing, Start Winning: Meet Swing Hunter Pro! Are you tired of confusing charts and late entries? The Swing Hunter Pro indicator is your ultimate weapon for capturing profitable market swings with unmatched clarity and confidence. This powerful tool combines the best of Hull Moving Averages (HMA) and Exponential Moving Averages (EMA) with a strict trend filter, giving you strong, high-probability signals right on your chart. Available in EA format. Link download https://www.mql5.com/en
FREE

Автоматическое построение уровней поддержки и сопротивления ПЛЮС разрывы между свечами на вашем графике, чтобы вы могли видеть, куда цена, скорее всего, направится дальше и/или потенциально может развернуться.
Этот индикатор разработан для использования в рамках методики позиционной торговли, которая преподается на моем сайте (The Market Structure Trader), и отображает ключевую информацию для таргетинга и потенциальных входов.
В индикаторе есть 2 основные функции и 4 дополнительные: ОСНОВНАЯ

Профиль Рынка (Market Profile) определяет ряд типов дней, которые помогают трейдеру распознать поведение рынка. Ключевая особенность - это область значений (Value Area), представляющая диапазон ценового действия, в котором произошло 70% торговли. Понимание области значений может помочь трейдерам вникнуть в направление рынка и установить торговлю с более высокими шансами на успех. Это отличное дополнение к любой системе, которую вы возможно используете. Blahtech Limited представляет сообществу Me

PipTick Heiken Ashi - это наша версия индикатора Heiken Ashi. В отличие от конкурирующих продуктов, этот индикатор предлагает широкие возможности для расчета свечей Heiken Ashi. Он может отображаться в классическом или сглаженном виде. Данный индикатор рассчитывает Heiken Ashi со скользящей средней четырьмя способами: SMA - простая скользящая средняя SMMA - сглаженная скользящая средняя EMA - экспоненциальная скользящая средняя LWMA - линейно-взвешенная скользящая средняя
Основные характеристик
FREE

GAP DETECTOR
FVG in trading refers to "Fair Value Gap", . It is a concept used in technical analysis to identify areas on a price chart where there is a discrepancy or gap between supply and demand. These gaps can occur due to rapid movements in price, usually as a result of important news or economic events, and are usually filled later as the market stabilizes. The GAP DETECTOR indicator is designed to identify fair value gaps (FVG) on the price chart and filter them using volatility to dete
FREE

Индикатор отображает на графике любой текст и любое изображение, а также может выводить информацию, запрашиваемую макросами. Имеется три текстовых блока и один блок для изображений. Доступны выбор шрифта, размер, цвет, отступы и позиционирование. Если вы хотите брендировать свои скриншоты или вывести необходимую информацию на график, то UPD1 Watermark будет очень полезным инструментом.
Описание настроек.
Настройки текста (3 блока). Text 1, 2, 3 – введите текст и, или макрос. Font Name – введи
FREE
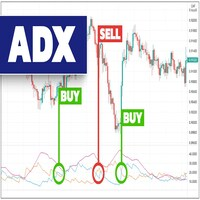
The indicator provides buy and sell signals on the charts every time ADX DI- and DI+ crosses each other. Blue arrow for uptrend (DI+>DI-). Red arrow for downtrend (DI->DI+). This technical analysis tool can be applied to various trading strategies. The ADX Crosses Signals Indicator is based on the Average Directional Index Metatrader Indicator. The ADX is a lagging indicator, meaning that a trend must already be established before the index can generate its signal.
Inputs PERIOD; AlertOn
FREE

Индикатор VeMAs — это инновационный торговый инструмент, предназначенный для улучшения вашей торговой стратегии за счёт анализа динамики объёма и рыночной структуры. Независимо от того, новичок вы или опытный трейдер, VeMAs дает вам преимущество. Индикатор VeMAs доступен всего за 50 $. Первоначальная цена индикатора 299 $ ПРЕДЛОЖЕНИЕ ОГРАНИЧЕННОЕ ПО ВРЕМЕНИ. Свяжитесь со мной после покупки для получения персонального бонуса! Вы можете получить абсолютно бесплатно крутую утилиту (VeMAs Utility MT

Necessary for traders: tools and indicators Waves automatically calculate indicators, channel trend trading Perfect trend-wave automatic calculation channel calculation , MT4 Perfect trend-wave automatic calculation channel calculation , MT5 Local Trading copying Easy And Fast Copy , MT4 Easy And Fast Copy , MT5 Local Trading copying For DEMO Easy And Fast Copy , MT4 DEMO Easy And Fast Copy , MT5 DEMO «Кооператив QQ: 556024» "Сотрудничество WeChat: 556024" «Совместная электронная почта: 55602
FREE

Прецизионный индикатор осциллятора (Pi-Osc) от Роджера Медкалфа из Precision Trading Systems Версия 2 была тщательно перекодирована для быстрой загрузки на вашем графике, а также внесены некоторые другие технические улучшения для улучшения опыта. Pi-Osc был создан для предоставления точных сигналов времени для совершения сделок, предназначенных для поиска экстремальных точек истощения - точек, к которым рынок вынужден идти, чтобы сработать стоп-заказы всех остальных. Этот продукт решает вековую

Профессиональный индикатор "Choch Pattern Levels" с RSI-фильтром для MT4 Описание: Вы устали от ложных пробоев и хотите находить точки разворота тренда с высокой точностью? Индикатор Choch Pattern Levels — это ваш профессиональный инструмент для определения смены характера рынка (Change of Character), дополненный мощным фильтром RSI и анализом объемов , чтобы вы входили в рынок только по самым надежным сигналам. Этот индикатор автоматически находит и отрисовывает на графике ключевые паттерны раз
FREE

As every ZigZag Indicator this Indicator Repaints . So use this only combining with other indicators or strategy.
CyberZingFx ZigZag Arrow MT4 Indicator, is one of the best tool for traders looking to identify trend reversals in the markets. This powerful indicator uses the ZigZag method to help you identify key support and resistance levels, making it easier to spot significant changes in price and filter out short-term fluctuations. With CyberZingFx ZigZag Arrow, you can quickly and easily
FREE
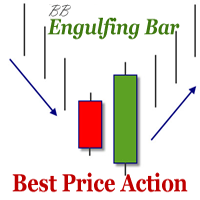
The indicator defines the Bullish and Bearish Engulfing Bar. The pattern has greater reliability when the open price of the engulfing candle is well above the close of the first candle, and when the close of the engulfing candle is well below the open of the first candle. For an engulfing bar to be valid it must fully engulf at least one previous bar or candle - includes all the body and the wick. The engulfing bar can engulf more than one bar as long as it completely engulfs the previous bar.
FREE
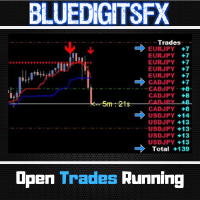
Free Utility Tool by BlueDigitsFx
Designed to improve workflow and trade management
Also available for MetaTrader 5
Optional access to updates & support via the BlueDigitsFx Telegram Assistant Bot BlueDigitsFx Open Trades is a powerful MT4 tool that displays your total pips from all open trades in real time.
Its intuitive color-coded interface quickly indicates winning and losing trades across all currency pairs.
This helps you monitor your trade performance effortlessly, enabling faster d
FREE

The Swing High Low Indicator is an essential tool for traders who rely on price action. It automatically marks key reversal points (swing highs in red, swing lows in green), helping you visualize trends, spot breakouts, and draw precise trendlines. By highlighting these critical levels, the indicator reveals market structure shifts—whether the trend is strengthening, reversing, or entering consolidation. Perfect for all timeframes and strategies, it turns raw price data into actionable tradi
FREE

Это бесплатный продукт, который вы можете использовать для своих нужд!
Также я очень ценю ваши положительные отзывы! Большое спасибо!
Нажмите здесь, чтобы увидеть высококачественные торговые роботы и индикаторы!
Индикатор Forex Spread Display для MT4, отличный вспомогательный торговый инструмент.
- Индикатор Spread Display показывает текущий спред валютной пары, к которой он прикреплен. - Можно расположить значение Spread display в любом углу графика: 0 - для верхнего левого угла, 1 - верхн
FREE

Индикатор "BIG FIGURE INDICATOR" автоматически идентифицирует и рисует горизонтальные линии на графиках цен на определенных уровнях, таких как целые числа или половинные числа (например, 1,0000 или 1,5000 в валютной торговле). Эти уровни считаются психологически значимыми, поскольку они представляют собой округленные цифры, на которые могут сосредоточиться крупные трейдеры и инвесторы, что может привести к потенциальным уровням поддержки или сопротивления. Этот индикатор может помочь трейдерам
FREE

ECM Elite Channel is a volatility-based indicator, developed with a specific time algorithm, which consists of finding possible corrections in the market.
This indicator shows two outer lines, an inner line (retracement line) and an arrow sign, where the channel theory is to help identify overbought and oversold conditions in the market.
The market price will generally fall between the boundaries of the channel. If prices touch or move outside the channel, it's a trading opportunity.
The ind

Breakout Sniper draw trendlines by using improved fractals and plots the breakout and reversal points.
NO REPAINT AUTOMATED TRENDLINES MULTI TIMEFRAME
*** SINCE THE STRATEGY TESTER OF MT4 PALTFORM DOES NOR SUPPORT, YOU NEED TO TEST "CURRENT TIMEFRAME" INPUTS ONLY.*** A trendline is a line drawn over pivot highs or under pivot lows to show the prevailing direction of price . Trend lines are a visual representation of support and resistance in any time frame. They show direction and speed

Huge 70% Halloween Sale for 24 hours only!
Send us a message after your purchase to receive more information on how to get your BONUS for FREE that works in great combination with Bull vs Bear ! Bull versus Bear is an easy-to-use Forex indicator that gives traders clear and accurate signals based on clear trend retests . Forget about lagging indicators or staring at charts for hours because Bull vs Bear provides real-time entries with no lag and no repaint, so you can trade with confiden

With this indicator you'll have a general reading of the market's range using Gann's calculating modes. Gann's swing is used to have a quick reading to the market latest movements at first glance. The foundation of this swing calculation is in the count of candles in relation to the break-up and break-down of the price. When the price breaks-up the last maximum, the swing will get traced if a certain number of candles is exceeded from the last minimum. It can be used a "pure Gann" or not: If set

Introduction to X3 Chart Pattern Scanner X3 Cherart Pattern Scanner is the non-repainting and non-lagging indicator detecting X3 chart patterns including Harmonic pattern, Elliott Wave pattern, X3 patterns, and Japanese Candlestick patterns. Historical patterns match with signal patterns. Hence, you can readily develop the solid trading strategy in your chart. More importantly, this superb pattern scanner can detect the optimal pattern of its kind. In addition, you can switch on and off individu
Huge 70% Halloween Sale for 24 hours only!
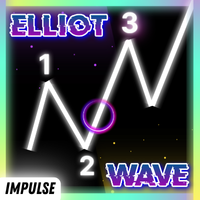
Manual guide: Click here This indicator is unstoppable when combined with our other indicator called Katana . After purchase, send us a message and you could get it for FREE as a BONUS! The Elliot Wave Impulse is a pattern identified in the Elliott Wave Theory, a form of technical analysis used to analyze financial market cycles. The Impulse Wave is considered the strongest and most powerful part of the Elliott Wave cycle, as it represents t

Усильте свои возможности по выявлению трендов с помощью Consecutive Candle Indicator MT4 — динамичного инструмента, предназначенного для определения последовательностей бычьих или медвежьих свечей, предоставляющего своевременные оповещения для подтверждения трендов и потенциальных разворотов на рынках форекс, акций, криптовалют и сырьевых товаров. Этот индикатор высоко ценится в торговых сообществах, таких как Forex Factory и Reddit (r/Forex), а также упоминается в обсуждениях на Investopedia и
FREE

TG MTF MA MT5 is designed to display a multi-timeframe moving average (MA) on any chart timeframe while allowing users to specify and view the MA values from a particular timeframe across all timeframes. This functionality enables users to focus on the moving average of a specific timeframe without switching charts. By isolating the moving average values of a specific timeframe across all timeframes, users can gain insights into the trend dynamics and potential trading opp
FREE
Other profitable programs https://www.mql5.com/en/users/ifyjava/seller Индикатор FNCD представляет собой продвинутый инструмент технического анализа, который объединяет преобразование Фишера со статистической нормализацией цен для создания сложного осциллятора. Основа начинается с Z-оценки нормализации, где ценовые данные стандартизируются путем вычисления того, на сколько стандартных отклонений текущая цена отстоит от своего скользящего среднего за определенный период. Этот процесс нормализац
FREE

The Supertrend Indicator is a popular technical analysis tool designed to assist traders in identifying market trends. The indicator combines the average true range (ATR) with a multiplier to calculate its value. This value is then added to or subtracted from the asset’s closing price to plot the supertrend line. The Supertrend Indicator can help identify trends, manage risk, and confirm market tendencies. The indicator is limited by its lagging nature, is not very flexible, and can send up fal
FREE

Exclusive Arrival: Presenting for the First Time . This is your secret weapon for predicting which way the wind will blow with the next market shift. It assists you in developing your trading strategy by predicting the direction of the next candle. Compatible with forex, stocks, and cryptocurrencies on all timeframes, but higher timeframes are recommended. MT5 Version - https://www.mql5.com/en/market/product/108937/ How does it work ? It's pretty neat. The algorithm separates green and red can
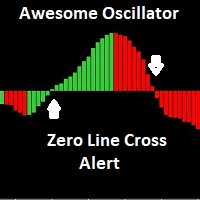
The Awesome Oscillator (AO) is an indicator used to measure market momentum. AO calculates the difference between a 34 Period and 5 Period Simple Moving Average. The Simple Moving Averages that are used are not calculated using closing price but rather each bar's midpoints. This indicator has email and pushup "mobile" features Alert, for any suggestions, please don't hesitate, thanks
FREE
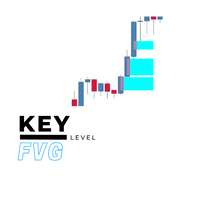
Key Level FVG Tired of manually scanning your charts for Fair Value Gaps (FVGs)? The Key Level FVG is a powerful and easy-to-use tool designed to automatically detect and display these critical price imbalances for you. Based on popular smart money concepts, this indicator highlights high-probability areas where the price is likely to return, providing you with clear and actionable trading zones. Whether you're a seasoned price action trader or just starting with FVG analysis, this indicator wi
FREE

The Netsrac Supply&Demand Dashboard shows you at a glance where relevant zones are located on your favorite assets. Open your chart directly from the dashboard and trade zones that really matter. Features
Finds the next relevant supply and demand zone and displays the distance to this zone (in pips) Finds and displays the zones in three different timeframes Calculates a trend indicator for the current and past candle for each configured time frame Opens a chart with your chart template directly

Ultimate MTF Support & Resistance - 5 Star Best Seller New Year Sale - Save $20 (normal price $79) Beginner or Professional our best selling multi-timeframe Pivot Prof will enhance your trading and bring you great trade opportunities with the Support and Resistance levels that professionals use. Pivot trading is a simple effective method for entering and exiting the market at key levels and has been used by professionals for decades and works on all symbols: Forex, Crypto, Stocks, Indicies et

Внимание! Друзья, так как в интернете последнее время появилось много мошенников которые продают индикаторы под названием ForexGump, мы решили Вас предупредить, что только у нас на странице продается ЛИЦЕНЗИОННАЯ АВТОРАСКАЯ ВЕРСИЯ ИНДИКАТОРА! Мы не продаем данный индикатор на других сайтах по цене ниже этой! Все индикаторы которые продаются дешевле - подделки! А еще чаще продаются демо версии которые через неделю прекращают работать! По этому, чтобы не рисковать своими деньгами, покупайте данный

The Pipsometer Pro Indicator is an essential, minimalist tool designed for the disciplined trader who requires immediate, at-a-glance financial feedback. It functions as a dedicated, real-time display that continuously calculates and shows your current floating profit or loss, measured exclusively in **pips**, for every open trade on the active chart. This focus on pips rather than monetary value allows traders to assess market performance and price movement directly, stripping away the emotion
FREE

KT Quick Risk Calculator is a professional utility tool for MetaTrader 4. It is designed to improve your workflow by providing instant calculations using an interactive measuring tool.
[Main Function] This tool allows you to interactively measure the distance between two points on the chart and immediately see the potential result in your account currency based on a fixed lot size.
[Key Features] 1. Smart Interaction: Hold [Ctrl] + Drag Left Mouse Button to measure. 2. Instant Data: Displays
FREE

После приобретения индикатора Tpx Dash Supply Demand вам необходимо загрузить этот индикатор, который будет связываться с индикатором Tpx Dash Supply Demand и передавать рыночные данные, предоставляя все ценовые сигналы спроса и предложения, ATR Stop, VAH и VAL, значения тренда с ADX, а также цены и местоположения точек подтверждения (POC) на рынке. Просто загрузите его, и Dash найдет индикатор для получения информации!
FREE
MetaTrader Маркет - уникальная площадка по продаже роботов и технических индикаторов, не имеющая аналогов.
Памятка пользователя MQL5.community расскажет вам и о других возможностях, доступных трейдерам только у нас: копирование торговых сигналов, заказ программ для фрилансеров, автоматические расчеты через платежную систему, аренда вычислительных мощностей в MQL5 Cloud Network.
Вы упускаете торговые возможности:
- Бесплатные приложения для трейдинга
- 8 000+ сигналов для копирования
- Экономические новости для анализа финансовых рынков
Регистрация
Вход
Если у вас нет учетной записи, зарегистрируйтесь
Для авторизации и пользования сайтом MQL5.com необходимо разрешить использование файлов Сookie.
Пожалуйста, включите в вашем браузере данную настройку, иначе вы не сможете авторизоваться.