Neue technische Indikatoren für den MetaTrader 4 - 18
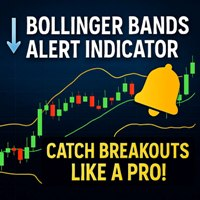
Bollinger Bands Alert Indicator - Ihr Vorteil in volatilen Märkten! Der Bollinger Bands Alert Indicator ist ein leistungsfähiges Instrument, das Händlern hilft, potenzielle Ausbruchs- und Umkehrmöglichkeiten präzise zu erkennen. Er überwacht das Kursgeschehen in Echtzeit und warnt Sie, wenn der Kurs die Bollinger-Bänder über- oder unterschreitet. Damit ist er ideal für volatilitätsbasierte Strategien, den Trendhandel oder Setups für den Gegentrend. Ganz gleich, ob Sie Scalper, Daytrader oder
FREE
Oszillator-Warnungen MultiPanel Alle Oszillatorsignale - in einem einzigen Panel!
Ein professionelles Multi-Panel-Tool zur Marktkontrolle, basierend auf den wichtigsten Oszillatoren mit einem flexiblen Alarmsystem und einzigartigen interaktiven Verwaltungsfunktionen. Beschreibung Oscillator Alerts MultiPanel ist ein innovatives Tool für Trader, das Multi-Symbol- und Multi-Timeframe-Analysen, flexible Benachrichtigungen und die bequemste interaktive Kontrolle vereint - und das alles direkt auf I
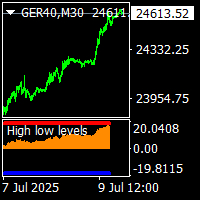
auf Demo-Modus, verwenden Datum für die Prüfung. für die Menschen kaufen diese Indikator, gibt es Bonus, Preis chanell und Timing-Indikator und tma Kontrolle periot und .complate Handelssystem hoch niedrig Ebenen Indikator ist nicht repaint Trendumkehr indicator.and arbeitet alle Paare und alle timeframes. Es gibt ein Histogramm Bewegung nach oben und unten. und es gibt ein Niveau rot und blau. Wenn Histogramm erreichen die bis rote Ebene, die top.and Umkehrung ist möglich. Wenn Histogramm nach
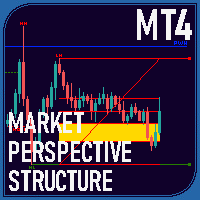
Übersicht Der Market Perspective Structure Indicator ist ein umfassender MetaTrader-Indikator, der Händlern eine detaillierte Analyse der Marktstruktur über mehrere Zeitrahmen hinweg bietet. Er identifiziert und visualisiert wichtige Preisaktions-Elemente, einschließlich Swing-Hochs und -Tiefs, Break of Structure (BOS), Change of Character (CHOCH), interne Strukturen, gleiche Hochs/Tiefs, Premium/Discount-Levels, frühere Levels aus höheren Zeitrahmen und Handelssitzungszonen. Dank umfangreicher
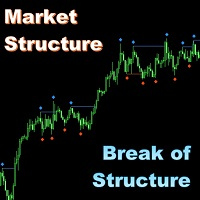
Marktstruktur - Bruch der Struktur (MS-BOS) für MT4 Es wurde ein einfaches Dashboard in der rechten Mitte des Charts hinzugefügt, das die Richtung des letzten aufgehobenen BOS-Levels für die Hauptgruppe der Timeframes anzeigt. Dieses Panel kann in den Parametern ausgeschaltet werden. Alle meine Indikatoren arbeiten nur bei geschlossenen Bars, sie malen keine Werte neu (wenn es nicht anders in der Beschreibung steht). Damit sind sie voll kompatibel mit dem Autotrading und können für die qualitat

MACD Crossover Arrows & Alert ist ein MT4 (MetaTrader 4)-Indikator und kann mit allen Forex-Handelssystemen/-Strategien zur zusätzlichen Bestätigung von Handelseintritten oder -austritten auf dem Aktien- und Devisenmarkt verwendet werden. Dieser mt4-Indikator liefert ein KAUFEN-Signal , wenn die MACD-Hauptlinie über der MACD-Signallinie kreuzt. Er zeigt auch ein Verkaufssignal an , wenn die MACD-Hauptlinie unterhalb der MACD-Signallinie kreuzt .
STRATEGIE Händler können die MACD-Signalwarnungen
FREE
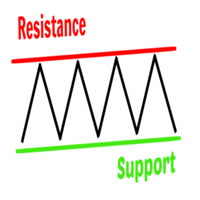
Unterstützungs- und Widerstandsniveaus sind die Schlüsselfaktoren, die die Preisbewegung von einer Zone zur anderen bestimmen. Sie sind Ebenen für Trendumkehr-/Ausbruchssignale, auf die Forex-Händler achten, bevor sie eine Handelsentscheidung treffen. Der Unterstützungs- und Widerstandsindikator ist ein benutzerdefiniertes Handelsinstrument für MT4, das entwickelt wurde, um Unterstützungs-/Widerstandszonen anhand vergangener Kursbewegungen darzustellen. Der Indikator hilft dem Händler auch dabei
FREE
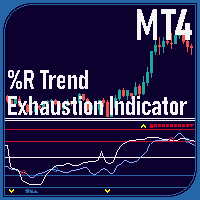
Überblick Der %R Trend Exhaustion Indicator ist ein leistungsstarkes technisches Analysetool, das von TradingView für MetaTrader 4 übernommen wurde. Er hilft Händlern bei der Identifizierung von Trenderschöpfungspunkten, potenziellen Umkehrungen und Trendfortsetzungssignalen unter verschiedenen Marktbedingungen. Mit mehreren Anzeigemodi, anpassbaren Einstellungen und erweiterten Funktionen ist dieser Indikator für verschiedene Handelsstrategien geeignet.
Wenn Sie weitere hochwertige Produkte s
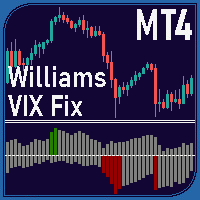
Überblick Der Williams VIX Fix-Indikator ist ein MetaTrader 4-Tool, das Händlern helfen soll, potenzielle Höchst- und Tiefststände des Marktes zu erkennen. Durch die Analyse von Preisextremen im Verhältnis zu den jüngsten Höchst- und Tiefstständen hebt er überkaufte und überverkaufte Bedingungen mithilfe von zwei Histogrammen hervor, die in einem separaten Fenster angezeigt werden. Der Indikator kombiniert die Berechnung des Williams VIX Fix mit Bollinger Bands und Schwellenwerten auf Perzentilb

Der Volli v9-Indikator basiert auf der Analyse von Zonen, die auf Volumen basieren. Das heißt, er basiert auf der Analyse, wie sich der Preis in der Nähe/in diesen Zonen verhält, ob er abprallt, sich weiterbewegt oder nicht reagiert. Der Indikator zeigt auch die Gesamtstärke der Währungen, die empfohlenen Stopps, die Trendrichtung, den Volumentrend und deren Veränderungen an.
Außerdem gibt es EA. https://www.mql5.com/en/market/product/145026?source=Site+Profil
Beschreibung 1) Die Pfeile. Werd

Waschbär FP Dieser MQL4-Indikator wurde entwickelt, um zuverlässige und klare Trendsignale ohne unnötige visuelle Unordnung zu liefern. Er erkennt sowohl Trendumkehrungen als auch starke Richtungsbewegungen durch die Kombination einer fortschrittlichen Filterlogik, die auf ADX, SAR und Marktstrukturanalyse basiert. Hauptmerkmale: Saubere visuelle Signale durch Pfeile (Kauf/Verkauf). Anpassbare Parameter: Hauptperiode, ADX-Periode, Mindestbarren, Alarmoptionen (Ton, E-Mail, SMS). Multi-Timeframe

Der Color Change MA ist ein vielseitiger, benutzerdefinierter Indikator für MetaTrader 4, der klare visuelle Signale zu Trendrichtung und Momentum liefert. Er verfügt über eine Linie des gleitenden Durchschnitts (Moving Average, MA), die auf intelligente Weise die Farbe ändert, basierend auf der Position des MA im Verhältnis zum Eröffnungs- und Schlusskurs der aktuellen Kerze, mit einem optionalen, aber leistungsstarken RSI-Filter (Relative Strength Index) zur besseren Bestätigung. Hauptmerkmale

# Quantum Apex Meter - Professioneller Währungsstärke-Analysator MT4 ## Demo Version funktioniert nicht richtig, Quantum Apex Meter funktioniert zu 100% nur mit echten Marktdaten. ### Handeln Sie nie wieder gegen den Trend Sind Sie müde von: Trades einzugehen, kurz bevor sich eine Währung umkehrt? Klare Stärke/Schwäche-Muster zu übersehen? Stunden mit der Analyse mehrerer Charts zu verschwenden? Das Quantum Apex Meter gibt Ihnen SOFORT visuelle Klarheit darüber, welche Währungen stark und schwac
FastTMALine_mth_PRT is non-redrawn channel indicator and can be used to identify trend and support and resistance levels.
Indicator settings allow you to assign a specific coefficient to each price channel, which makes it possible to narrow or expand each channel separately. The FastTMALine_mth_PRT indicator is a multicurrency instrument, so the choice of a timeframe depends solely on the trader’s preference. FastTMALine_mth_PRT indicator can be used on any time frame, so you can eas
FREE

Heikin Ashi Smoothed – MT4-Indikator Heikin Ashi Smoothed ist ein benutzerdefinierter Indikator für MetaTrader 4 (MT4), der das klassische Heikin Ashi-Kerzenchart durch einen zusätzlichen Glättungsprozess mit gleitenden Durchschnitten verbessert. Dieses Verfahren sorgt für eine deutlich klarere und gleichmäßigere Trenddarstellung, reduziert Marktrauschen erheblich und erleichtert die Erkennung sowohl der vorherrschenden Marktrichtung als auch möglicher Umkehrpunkte. Hauptmerkmale Zeigt geglättet
FREE
Heikin Ashi Binary – Visueller Trendunterstützungsindikator mit binärer Anzeige Übersicht Heikin Ashi Binary ist ein Indikator für MetaTrader, der Trendinformationen von Heikin Ashi in binärem Format (zweifarbige Blöcke) in einem Unterfenster anzeigt.
Anstelle traditioneller Kerzen stellt der Indikator Aufwärts- (bullisch) und Abwärtstrends (bärisch) als einfache farbige Blöcke dar.
Dies ermöglicht eine schnelle Erkennung von Trendfortsetzungen oder möglichen Umkehrpunkten. Der Indikator eignet
FREE

Future Trend Channel ist ein dynamischer und visuell intuitiver Indikator, der entwickelt wurde, um Trendrichtungen zu identifizieren und potenzielle Kursbewegungen vorherzusagen. Ursprünglich von ChartPrime für TradingView entwickelt, wurde dieses Tool für MetaTrader 4 adaptiert und bietet Händlern ähnliche Funktionalitäten. Egal, ob Sie Swing-Trader, Day-Trader oder langfristiger Investor sind – der Future Trend Channel hilft Ihnen, die Trendstärke zu visualisieren, Trendwenden vorherzusehen u
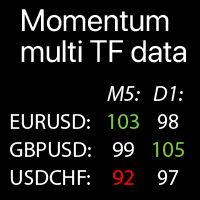
Multi-Zeitrahmen Momentum-Werte für ausgewählte Symbole: Vergleichen Sie die aktuellen Markttrends Der Indikator zeigt die Momentum-Indikator- Werte aus allen ausgewählten Zeitrahmen und Symbolen in einer einzigen Tabelle an, was eine schnelle Analyse der aktuellen Marktpreis- Trends ermöglicht.
Mein multifunktionales Tool : 66+ Funktionen | Kontaktieren Sie mich bei Fragen | MT5-Version Jedes Symbol kann angepasst werden: entfernt / ersetzt. Sie können bis zu 40 Symbole hinzufügen. D

BB-Sub – Bollinger-Bänder im Unterfenster BB-Sub ist ein einfacher, aber leistungsstarker Indikator, der Bollinger-Bänder unabhängig im Unterfenster des Charts anzeigt. Im Gegensatz zu den Standard-Bollinger-Bändern, die im Hauptchart erscheinen, arbeitet BB-Sub in einem separaten Unterfenster. Dadurch gibt es keine Überlagerung mit Kerzen oder anderen Indikatoren – ideal für Trader, die sich ganz auf die Bewegung und Form der Bänder konzentrieren möchten. Hauptmerkmale Gleichzeitige Anzeige des
FREE
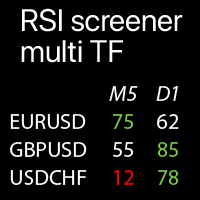
Multi-Timeframe RSI-Werte für ausgewählte Symbole: Vergleichen Sie die aktuellen Markttrends Der Indikator zeigt RSI-Werte von allen ausgewählten Timeframes und Symbolen in einer einzigen Tabelle an, was Ihnen ermöglicht, aktuelle Marktpreistrends schnell zu analysieren.
Mein multifunktionales Hilfsprogramm : 66+ Funktionen | Kontaktieren Sie mich bei Fragen | MT5-Version Jedes Symbol kann angepasst werden: entfernt / ersetzt. Sie können bis zu 40 Symbole hinzufügen. Das Panel kann an
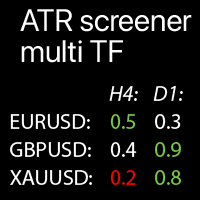
Multi-Zeitrahmen ATR-Werte für ausgewählte Symbole: Vergleichen Sie die aktuellen Markttrends Der Indikator zeigt ATR-Werte von allen ausgewählten Zeitrahmen und Symbolen in einer einzigen Tabelle , was eine schnelle Analyse der aktuellen Marktpreistrends ermöglicht .
Mein multifunktionales Tool : 66+ Funktionen | Kontaktieren Sie mich bei Fragen | MT5-Version Jedes Symbol kann angepasst werden: entfernen / ersetzen. Sie können bis zu 40 Symbole hinzufügen. Der Prozentsatz der aktue
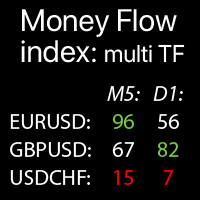
Multi-Timeframe Money Flow Index: Daten ausgewählter Symbole zum Vergleich aktueller Markttrends Der Indikator zeigt MTF (Money Flow Index) Daten von allen ausgewählten Zeitrahmen und Symbolen in einer einzigen Tabelle an, was eine schnelle Analyse der aktuellen Marktpreis Trends ermöglicht.
Mein multifunktionales Tool : 66+ Funktionen | Kontaktieren Sie mich bei Fragen | MT5-Version Jedes Symbol kann angepasst werden: entfernen / ersetzen. Sie können bis zu 40 Symbole hinzufügen. Das

GANN Forecaster - Präzisionswerkzeug für Forex-Händler (MT4) Verbessern Sie Ihren Handel mit dem Gann Forecaster Scanner für MetaTrader 4. Dieses leistungsstarke, interaktive Tool liefert präzise Preis- und Zeitprognosen und verschafft Ihnen einen professionellen Vorteil auf den Devisen-, Gold-, Index- und Kryptomärkten. Aufbauend auf der robusten Funktionalität des Gann Forecaster-Indikators bietet dieser fortschrittliche Scanner eine Multi-Paar-Analyse, berechnet kontinuierlich Gann-Levels un
Ein Indikator im Stil der binären Optionen für den Handel mit Fair Value Gaps und Line Breaks. Seine robuste Natur hebt ihn von anderen Indikatoren für binäre Optionen ab. Mit der richtigen Setup-Strategie, die ich Ihnen nach dem Kauf zur Verfügung stellen werde, werden Sie einen reibungslosen Betrieb des Indikators genießen. BinaryBlockBreaker ist mit Anwendungen von Drittanbietern wie http://www.mt2trading.com/?ref=1341 codiert. Bitte melden Sie sich an und laden Sie die benötigte Software her
M1 Golding - Dies ist ein einfach zu bedienendes Handelssystem. Es handelt sich um einen Pfeilindikator, der für den Zeitrahmen M1-M5 entwickelt wurde. Der Indikator kann sowohl als eigenständiges Scalping-System, als auch als Teil Ihres bestehenden Handelssystems verwendet werden. Bonus: Wenn Sie den Indikator kaufen, erhalten Sie ein Geschenk - Trend Arrow Super Ich biete auch einen zusätzlichen Trendfilter-Indikator absolut kostenlos an - Filter Die Kombination dieser Indikatoren kann Ihnen h

Heiken Aish-Indikator, der Warnungen erzeugt, wenn der Markt seine Richtung ändert. Er erleichtert die Visualisierung der Marktvolatilität und sorgt für mehr Ruhe bei der Entscheidungsfindung. Blau bedeutet Kaufen und Gelb bedeutet Verkaufen. Eine Kerze ohne Docht weist auf einen starken Trend hin, d. h. blaue Kerzen ohne Docht an der Unterseite weisen auf einen starken Kauftrend hin und umgekehrt, gelbe Kerzen ohne Docht an der Oberseite auf einen starken Abwärtstrend.
FREE
FlatBreakout (Kostenlose Version) Flat Range Detektor und Breakout Panel für MT4 - nur GBPUSD FlatBreakout ist die kostenlose Version des professionellen FlatBreakoutPro-Indikators, der speziell für die Erkennung von Kursschwankungen und Ausbruchssignalen nur für das GBPUSD-Paar entwickelt wurde.
Perfekt für Trader, die die einzigartige fraktale Logik von FlatBreakout erleben und Ausbruchssignale ohne Einschränkungen auf einem Live-Markt testen möchten. Für wen ist dieses Produkt geeignet? Für H
FREE

Der Indikator muss im gleichen Ordner wie Dash abgelegt werden, um den Alarmfilter mit Heiken Aish zu aktivieren. Nachdem Sie den Indikator heruntergeladen haben, kopieren Sie ihn in denselben Ordner, damit Dash den Indikator lesen kann. Es ist nicht notwendig, den Indikator in den Chart einzufügen. Dies dient nur dazu, dass Dash nach Signalen sucht und die Kauf- und Verkaufsrichtung des Indikators anzeigt. Prüfen Sie, ob der Pfad des Indikators in Dash korrekt ist.
FREE

Auto Buy/Sell mit MA Cross für MT4 - Ihr intelligenter Handelsassistent! Mit diesem leistungsstarken Moving Average Crossover-Indikator für MetaTrader 4 wird das Rätselraten beim Handel ein Ende haben.
Er identifiziert automatisch Kauf- und Verkaufschancen anhand von schnellen und langsamen MA-Crossovers - und zeigt klare visuelle Signale auf Ihrem Chart an. Ob Sie Anfänger oder Profi sind, dieses Tool bringt Präzision, Klarheit und Vertrauen in Ihre Handelsstrategie. Hauptmerkmale: Auto

Wohnung Reminder Übersicht Flat Reminder ist ein leistungsstarkes technisches Analysetool, das Preiskonsolidierungszonen auf Ihrem Chart identifiziert und hervorhebt. Es erkennt, wenn sich die Kursbewegung verlangsamt und seitwärts bewegt, und weist so auf potenzielle Umkehrpunkte, Fortsetzungs-Setups oder wichtige Entscheidungszonen im Markt hin. Hauptmerkmale Erkennung von Konsolidierungen : Identifiziert automatisch flache Preiszonen, in denen die Marktdynamik nachlässt Messung der Spanne : B
FREE
AI Driven Forex Trading Signal Indikator MT4 Dieser fortschrittliche MT4-Indikator nutzt künstliche Intelligenz, um Marktumkehrpunkte mit hoher Wahrscheinlichkeit und angemessener Genauigkeit zu identifizieren. Der Indikator wurde für Händler entwickelt, die Wert auf Präzision legen. Er analysiert das Kursgeschehen in Echtzeit und zeigt optimale Einstiegsmöglichkeiten sowohl für Kauf- als auch für Verkaufstransaktionen auf. Dieses Tool eignet sich für alle wichtigen Forex-Paare und Zeitrahmen un
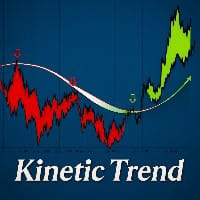
Autor: Alexander Lapin
---
Beschreibung:
Kinetic Trend ist ein einzigartiger Indikator, der auf einem mathematischen Modell der abklingenden kinetischen Energie des Preises basiert. Er bildet drei unabhängige Trägheitslinien (Haupt-, Umkehr- und Spiegellinie) und zeigt adaptive Abweichungszonen und deren Kreuzungen an.
Der Indikator verwendet keine Standardindikatoren wie gleitende Durchschnitte oder RSI und bietet eine völlig neue Möglichkeit zur Visualisierung von Trend und Bewegungsst

MA-Erinnerung Übersicht MA Reminder ist ein vielseitiger Indikator für gleitende Durchschnitte, der visuelle Hinweise und Hintergrundfarben liefert, um Händlern zu helfen, die Trendrichtung und potenzielle Handelsmöglichkeiten auf der Grundlage von MA-Überkreuzungen zu erkennen. Hauptmerkmale Mehrere gleitende Durchschnitte : Zeigt bis zu 4 konfigurierbare gleitende Durchschnitte auf dem Chart an Hintergrundfärbung : Hervorhebung des Chart-Hintergrunds basierend auf MA1- und MA2-Crossovers Zeitr
FREE

ตัวบ่งชี้ Sniper Zones Pro - คำอธิบายการใช้งาน ตัว บ่งชี้ Sniper Zones Pro ออกแบบมาเพื่อช่วยให้ผู้ซื้อขายระบุ "โซน" ราคาที่สำคัญและจุดเข้า/ออกที่แม่นยำสำหรับการซื้อขายได้อย่างรวดเร็ว โดยมุ่งหวังที่จะเพิ่มผลกำไรสูงสุดหรือจำกัดความเสี่ยง ตัวบ่งชี้ทำงานโดยคำนวณและแสดงระดับราคาตามค่าเฉลี่ยเคลื่อนที่ถ่วงน้ำหนักเชิงเส้น (LWMA) และให้คำแนะนำในการทำกำไร (TP) และหยุดการขาดทุน (SL) แบบไดนามิก ส่วนประกอบและหลักการทำงาน: การคำนวณระดับราคา: เส้นหลัก (L2 - จุดเข้า): เส้นสีแดงนี้แสดง ค่าเฉลี่ยเคลื่อนที่ถ่วงน้
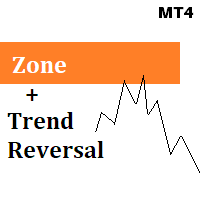
Zone + Trendumkehr-System
Es gibt viele Situationen, in denen Sie diesen Indikator verwenden möchten oder auch nicht. Bitte lesen Sie das Dokument im Kommentarbereich, um eine vollständige Anleitung zu erhalten. Prüfen Sie die Kommentare für die Anleitung. Bitte beachten Sie, Sobald Sie den Kauf tätigen, melden Sie sich bitte bei mir, wenn Sie in der Testphase sind, damit ich Ihre Fragen beantworten kann, wenn Sie feststecken und verwirrt sind, denn meistens scheitern wir, weil wir in eine fals
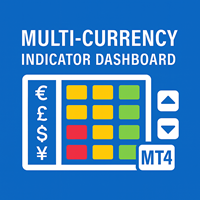
Das Multi-Currency Indicator Dashboard für MT4 ist ein hilfreiches Tool zur Überwachung von bis zu 10 Währungspaaren mit 6 wichtigen Indikatoren in einem kompakten, farbcodierten Dashboard. Dieses Tool ist ideal für Trader, die Wert auf Effizienz legen, denn es macht den Wechsel zwischen Charts oder Zeitrahmen überflüssig. Egal, ob Sie Scalper, Swing Trader oder Trendfolger sind, dieses Dashboard gibt Ihnen einen sofortigen visuellen Überblick über die Marktbedingungen für Ihre bevorzugten Symbo
Der Average Sentiment Indicator für MT4 ist ein zusammengesetzter Oszillator, der die Erkenntnisse von fünf herkömmlichen technischen Indikatoren - Relative Strength Index (RSI ), Stochastic (STO ), Money Flow Index (MFI) , DeMarker (DeM ) und William's %R (WPR ) - in einer einzigen Linie von 0 bis 100 zusammenfasst. Es handelt sich um das arithmetische Mittel der fünf Indikatoren nach der Normalisierung. Dieses Tool ist ideal für Händler, die eine geräuscharme Perspektive auf überkaufte und übe

Auto Price Squeeze Levels Der Auto Price Squeeze Levels-Indikator wurde entwickelt, um Händlern zu helfen, "Price Compression"- (oder Price Squeeze-) Bedingungen auf ihren Charts einfach und automatisch zu erkennen und zu verfolgen. Preiskompression bezieht sich auf Perioden, in denen die Marktvolatilität abnimmt und die Kursbewegungen zunehmend auf eine enge Spanne begrenzt werden. Dies ist oft ein wichtiges Signal, das darauf hinweist, dass sich Energie angesammelt hat, bevor es in naher Zukun
SNR INTRADAY ist ein nicht nachzeichnender Unterstützungs- und Widerstandsindikator, der für den Intraday-Handel entwickelt wurde. Er projiziert automatisch horizontale Ebenen auf der Grundlage der durchschnittlichen täglichen prozentualen Bewegung, die aus über 20 Jahren historischer Tageskerzendaten berechnet wurde. Der Indikator soll Ihnen helfen, wahrscheinliche Einstiegszonen , Zielbereiche und Risikoniveaus zu identifizieren, die wahrscheinlich noch am selben Handelstag erreicht werden.

Der Indikator „ Dynamic Scalper System “ ist für Scalping-Handel innerhalb von Trendwellen konzipiert.
Getestet an wichtigen Währungspaaren und Gold, Kompatibilität mit anderen Handelsinstrumenten ist gegeben.
Liefert Signale für die kurzfristige Eröffnung von Positionen entlang des Trends mit zusätzlicher Unterstützung von Kursbewegungen.
Das Prinzip des Indikators:
Große Pfeile bestimmen die Trendrichtung.
Ein Algorithmus zur Generierung von Scalping-Signalen in Form kleiner Pfeile arbeitet

„Naturu“ ist ein manueller Indikator, der die Symmetrie der Natur als Algorithmus nutzt.
Beherrsche den Markt mit einer einfachen Strategie und verborgener Weisheit! Beim Laden des Indikators siehst du zwei Linien – Oben (Top) und Unten (Bottom).
Klicke einmal auf eine Linie, um sie zu aktivieren. Um sie zu verschieben, klicke einfach auf die Kerze, an die du sie setzen möchtest. Du legst einen Höchst- und einen Tiefstpunkt fest, und der Indikator berechnet automatisch: Eine magentafarbene Zone,

Der SuperTrend-Indikator ist ein trendfolgendes technisches Tool, das Trendwechsel im Markt visuell hervorhebt. Die Farbe und Position der Linien ändern sich automatisch in Abhängigkeit von den Kursbewegungen und unterstützen so bei der Entscheidung von Ein- und Ausstiegen. Dank seines einfachen Designs kann er in verschiedenen Handelsstilen sowohl manuell als auch automatisiert eingesetzt werden. Hauptmerkmale Klare Anzeige von Trendwechseln
In Aufwärtstrends wird die Linie unterhalb der Kerze
FREE
TMA Classic – Übersicht des Dreiecks gleitenden Durchschnitts-Indikators Der TMA Classic ist ein sehr einfacher und leichter Indikator, der den Dreiecks gleitenden Durchschnitt (TMA) als eine einzelne, geglättete Linie anzeigt. Er entfernt effektiv übermäßiges Rauschen und erfasst die zentrale Preisbewegung, was hilfreich für die Erkennung von Trends und Seitwärtsmärkten ist. Da nur eine Linie angezeigt wird, bietet der Indikator eine hohe Sichtbarkeit auf dem Chart, ohne mit anderen Indikatoren
FREE

Wir alle wissen: Steigen die Benzinpreise, wird alles teurer. Schließlich werden die erhöhten Frachtkosten in die Lieferpreise aller Waren eingerechnet. Nehmen wir ein Beispiel aus dem Alltag - ein heißes Jahr führt zu Getreideüberschüssen, wodurch Erzeuger die Preise senken, um sich dem Marktangebot anzupassen. Genauso hilft der RadarBoard-Indikator, offensichtliche Zusammenhänge auf Devisenmärkten zu erkennen. Wenn Gold teurer wird, kauft man es mit Dollar, was den Dollar schwächt. Diese Erke
FREE

VALUE EDITION LIMITED ist ein fortschrittlicher technischer Indikator, der für Händler entwickelt wurde, die Klarheit, Präzision und Geschwindigkeit bei der Marktanalyse suchen. Kompatibel mit MetaTrader 4 und 5, integriert er intelligente Überkauft-/Überverkauft-Zonen, dynamische Preiskanäle, normalisierte Kerzenanalyse und Echtzeit-Warnungen und bietet so eine zuverlässige Unterstützung für den Handel mit jedem Basiswert oder Zeitrahmen. Hauptmerkmale Intelligente Handelszonen: Automatisc
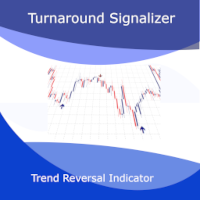
Wir stellen den Turnaround Signalizer vor: Ihr Wettbewerbsvorteil bei Trendumkehrungen.
Dieser für die MetaTrader 4-Plattform entwickelte Trendumkehr-Indikator ist ein robustes Instrument für Händler, die mit hoher Wahrscheinlichkeit Wendepunkte am Markt erkennen wollen. Sein firmeneigener Algorithmus analysiert kontinuierlich das Kursverhalten und filtert Marktgeräusche heraus, um die wichtigsten Richtungswechsel hervorzuheben.
Vielseitigkeit für alle Handelsstile
Perfekt für Scalping: Der T

GANN Forecaster - Präzisionswerkzeug für Forex-Händler (MT4) Entfesseln Sie die Kraft der Gann-Analyse in Ihrem Handel mit diesem fortschrittlichen, interaktiven Indikator, der speziell für MetaTrader 4 entwickelt wurde. Egal, ob Sie mit Devisen, Gold, Indizes oder Kryptowährungen handeln, dieses Tool verschafft Ihnen mit präzisen Preis- und Zeitprognosen einen professionellen Vorteil.
Hauptmerkmale GANN-Projektionen mit Live-Referenzpunkt aktivieren automatisch entweder "Up"- oder "Down"-Gann
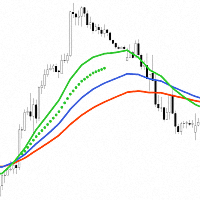
" Trend Acceleration 4" wurde entwickelt, um Händlern bei der Navigation durch die Marktsituation zu helfen. Der Indikator zeigt drei Multi-Time-Frame "Moving Averages" , die den Trend (Tendenz) der Preisbewegung von Finanzinstrumenten anzeigen. Sie sind die Grundlage für die Analyse von Abhängigkeiten, die mit großem Erfolg die Beschleunigung oder Verlangsamung des Trends (der Tendenz) der Finanzmärkte anzeigen.
Die Entscheidung für die Verwendung von drei gleitenden Durchschnitten im Indikato

Wie der Indikator funktioniert MultiMarket Direction ist ein leistungsstarker und vielseitiger Indikator für die MetaTrader-Plattform, der Händlern helfen soll, Markttrends zu visualisieren und potenzielle Einstiegspunkte zu identifizieren. Durch die Kombination bewährter technischer Analysewerkzeuge wie Exponential Moving Averages (EMAs) und High/Low Levels bietet dieser Indikator eine klare und umfassende Sicht auf die Marktdynamik. Der Indikator zeigt Folgendes auf dem Chart an: EMA 21, EMA 8
Dieser Indikator hebt die genauen Punkte auf dem Diagramm hervor, an denen der eingebaute ZigZag-Indikator seine Höchst- oder Tiefststände übermalt hat. Graue Pfeile zeigen an, wo ein zuvor bestätigter Höchst- oder Tiefststand später verschoben wurde - ein Verhalten, das als Repainting bekannt ist. Warum das wichtig ist:
Repainting kann Händler in die Irre führen, indem es historische Signale verändert und einen falschen Eindruck von vergangener Genauigkeit vermittelt. Dieses Tool hilft Händler
FREE
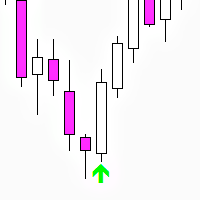
Three Bar Reversal (MT4) - kostenloser Indikator Three Bar Reversal ist ein einfacher und effektiver MetaTrader 4-Indikator, der das klassische Three-Bar-Reversal-Kerzenmuster mit zusätzlicher Filterung auf Basis von ATR und Kerzenkörpergrößen erkennt.
Die Pfeile werden auf der letzten geschlossenen Kerze des Musters angezeigt, und es werden auch Push-Benachrichtigungen gesendet. Ein automatisierter Handelsroboter Three Bar Reversal EA wurde auf der Grundlage dieses Indikators entwickelt. De
FREE
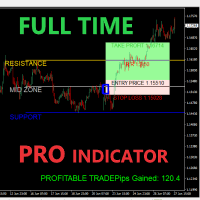
Liebe Traderinnen und Trader,
Willkommen beim Full Time Pro Indicator - einem professionellen Handelsassistenten, der Ihnen hilft, durch eine visuell intelligente und hochgradig interaktive Chartschnittstelle fundierte Entscheidungen zu treffen. Egal, ob Sie Anfänger oder fortgeschrittener Trader sind, dieser Leitfaden wird Sie durch alle Funktionen des Indikators führen, damit Sie Ihre Charting-Erfahrung mit Präzision und Leichtigkeit maximieren können.
️ Empfohlener Zeitrahmen Am besten
ADX-Indikator, der in der Didi's Needles-Methode verwendet wird und es Ihnen erleichtert, im Handel zu bleiben. Solange er blau ist, brauchen Sie nicht auf andere Signale zu achten, um aus dem Handel auszusteigen, und umgekehrt, solange er gelb ist, werden Sie den Verkauf beibehalten. Alles schnell und visuell. Der ADX-Indikator zeigt an, ob es einen Trend auf dem Markt gibt. Dieser Indikator zusammen mit den Nadeln ist die perfekte Kombination für das Surfen in starken Marktbewegungen!!!!
FREE

Ich bin nicht hier, um Ihnen Träume zu verkaufen oder Ihnen zu versprechen, dass Sie nächsten Monat Ihren Job aufgeben werden. Dieser Indikator identifiziert drei proprietäre Muster, die 99% der Händler noch nie gesehen haben. Und warum? Weil ich sie selbst entdeckt und unzählige Stunden damit verbracht habe, den Erkennungsalgorithmus zu verfeinern, um Ihnen nur die absolut besten Setups zu zeigen. Ich habe 11 echte Chart-Screenshots für verschiedene Vermögenswerte beigefügt. Versuchen Sie ruhig

Statistischer zeitbasierter Indikator - Richtungskerze Dieser Indikator analysiert alle Kerzen des letzten Monats (30 Tage) auf dem aktuellen Zeitrahmen und identifiziert, zu welchem genauen Zeitpunkt (Stunde und Minute) bullische oder bearische Kerzen am häufigsten auftreten. Auf der Grundlage dieser Daten gibt er in Echtzeit KAUF- (CALL) oder VERKAUFS- (PUT) Signale aus, sobald die Wiederholung des Verhaltens den konfigurierten Prozentsatz erreicht. Die statistische Logik basiert auf
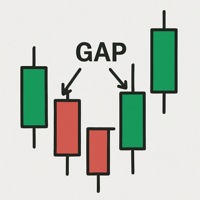
Eine Lücke ist eine Lücke auf dem Chart zwischen zwei aufeinanderfolgenden Kerzen, in der zwischen dem Schluss der einen Kerze und der Eröffnung der nächsten Kerze kein Handel stattgefunden hat. Auf dem Devisenmarkt treten Lücken hauptsächlich zur Wocheneröffnung auf und spiegeln Ereignisse oder Erwartungen vom Wochenende wider. Aus technischer Sicht kann eine Lücke auf ein Ungleichgewicht zwischen Angebot und Nachfrage hinweisen. Strategien nutzen Gaps als Signale für eine mögliche Trendfortset
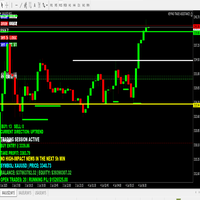
HANDELSSTRATEGIELEITFADEN LIEFERUNG Der vollständige Handelsstrategie-Leitfaden wird Ihnen nach dem Kauf direkt zugesandt.
Schreiben Sie mir einfach eine Nachricht auf MQL5 und fordern Sie ihn an - Sie erhalten ihn sofort, zusammen mit vorrangigem Support und Einrichtungshilfe. Powered Market Scanner für intelligente Handelsentscheidungen Keypad Support & Resistance ist ein MT4-Handelssystem der nächsten Generation, das für seriöse Trader entwickelt wurde, die Präzision, Zuverlässigkeit und
FREE
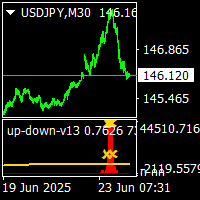
up-down v13 Indikator ist kein repaint und arbeitet alle Paare und alle Zeitrahmen Charts. es verbraucht zu viel Zeit brauchen mindestens i5 cpu.pc v.2.2 use les cpu.but it sometimes cahange back signals.any one request it i will give bonus it. Es ist geeignet auch 1 m Charts für alle Paare. und halten lange Weg zum Signal. dont gibt zu viele Signale. Wenn das rote Histogramm die Triggerlinie kreuzt, ist das ein Aufwärtssignal und der Preis wird wahrscheinlich fallen. wenn blaue Histogramm Kre

Der Market Session Currency Meter ist ein fortschrittlicher Währungsmesser, der hauptsächlich für den Intraday-Handel entwickelt wurde. Das Messgerät verfolgt die Preisbewegungen und Volatilitäten in den verschiedenen Marktsitzungen täglich. Mit diesem Marktmesser können Sie sehen, wie sich der Preis innerhalb der vier (4) Hauptmarktsitzungen (SYDNEY, TOKYO, LONDON und NEW YORK) bewegt. Der Indikator verfügt über eine eingebaute Zeitumstellung, die die Stunden für jede Sitzung automatisch anpass
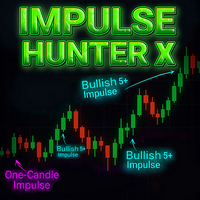
Impulse Hunter X Indikator - Professioneller Marktbewegungsradar Impulse Hunter X ist ein professionelles Trading-Tool, das Händlern hilft, neue, starke Marktimpulse zu erkennen. Er identifiziert und warnt Sie vor starken Kursbewegungen, damit Sie keine Handelsgelegenheit verpassen. Jeder Impulstyp wurde sorgfältig getestet und auf seine Genauigkeit hin verfeinert. Stellen Sie vor der Verwendung sicher, dass Sie die Eingabeparameter konfigurieren, insbesondere die Kerzengröße für stärkere Impuls
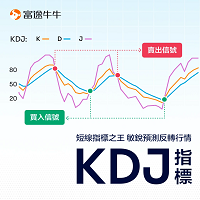
Der KDJ-Indikator ist ein sehr nützlicher Momentum-Oszillationsindikator, der aus den drei Indikatorlinien K, D und J besteht. Viele bezeichnen den KDJ-Indikator auch als "Zufallsindikator", weil er auf der Grundlage eines traditionellen Zufallsindikators (der nur die Linien K und D enthält) eine J-Linie als Hilfslinie hinzufügt. Der KDJ-Indikator verfügt über ein gewisses Maß an Vollständigkeit und nutzt die Vorteile des William-Indikators (WMSR) und der gleitenden Durchschnitte (MA), um Anleg
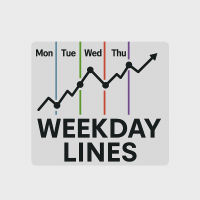
Verbessern Sie Ihre technische Analyse mit unserem Wochentagslinien-Indikator - einem leistungsstarken und dennoch leichtgewichtigen Tool, das für Händler entwickelt wurde, die die tägliche Marktstruktur klar visualisieren möchten.
Hauptmerkmale: Zeichnet automatisch vertikale Linien für jeden Handelstag: Montag bis Freitag
Anpassbare Farben und Stile , die zu Ihrem Chartthema passen
Tagesbeschriftungen (Mo, Di, etc.) erscheinen neben den Linien, um die Verfolgung zu erleichtern
Funktio
FREE

Dark & Light Themes für MT4.
Der Indikator Dark & Light Themes hilft Ihnen, die MT4-Chartanzeige zwischen dunklen und hellen Farbschemata zu wechseln. Er enthält auch ein Wasserzeichen, das das aktuelle Währungspaar (Symbol) und den aktiven Zeitrahmen anzeigt.
Diese einfache und saubere Schnittstelle macht es für Händler bequemer, Charts mit jedem Indikator zu analysieren.
FXDragunov Indonesia.
FREE
Dieser Indikator ist die mql4 Version des SSLHybrid Indikators . MT5-Version Erfahren Sie hier mehr: https: //www.mql5.com/en/users/rashedsamir/seller
Beschreibung der TradingView-Version: Dieses Skript wurde für die NNFX-Methode entwickelt, daher wird es nur für Daily-Charts empfohlen.
Versucht, einige VP NNFX-Regeln zu implementieren
Dieses Skript hat eine SSL / Baseline (Sie können zwischen SSL oder MA wählen), eine zweite SSL für Fortsetzungsgeschäfte und eine dritte SSL für Ausstiegsgeschä
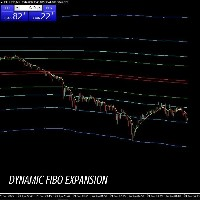
Hauptkomponenten und Funktionsweise Dieser Indikator kombiniert im Wesentlichen drei Hauptelemente, um einen umfassenden Überblick über das Kursgeschehen zu geben: Die EMA14-Linie (Gelbe Linie) Dies ist ein einfacher exponentieller gleitender Durchschnitt , der aus den Schlusskursen der letzten 14 Kerzen berechnet wird. Funktion: Seine Hauptaufgabe besteht darin, kurzfristige Preistrends aufzuzeigen. Ist die Linie nach oben geneigt, deutet dies auf einen Aufwärtstrend hin; ist sie nach unten gen
*LIMITED FREE! DOWNLOAD JETZT*
CDS Fractal Divergence Oscillator (AIO): Das ultimative Multi-Oszillator-Divergenz-Tool mit 15 Oszillator-Optionen Der CDS Fractal Divergence Oscillator (AIO) ist ein robuster und äußerst vielseitiger Indikator, der Händlern durch fortschrittliche Divergenzerkennung hilft, entscheidende Trendumkehrungen und Momentumverschiebungen zu erkennen. Seine unvergleichliche Stärke liegt in seiner einzigartigen Fähigkeit, Divergenzen über 15 verschiedene eingebaute Oszillato
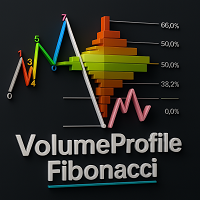
Beschreibung: Verbessern Sie Ihre Chartanalyse mit diesem fortschrittlichen Indikator, der nahtlos Zigzag-Strukturen, Fibonacci-Retracements und Erkenntnisse über das Volumenprofil integriert. Dieses Tool wurde für Händler entwickelt, die Klarheit und Präzision suchen, und identifiziert visuell hochwahrscheinliche Preismuster und Marktwendepunkte.
Ob Sie nun CHOCH-Verschiebungen verfolgen, POIs lokalisieren oder TRIPLE-Tops und FLAG-Formationen analysieren, dieser Indikator bietet die Tiefe un
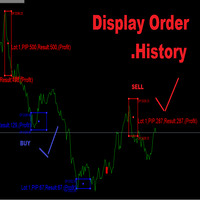
Auftragshistorie anzeigen Handeln lassen.
Schaltfläche Mark - Rot : Auftrag VERKAUFEN - Blau : Auftrag KAUFEN
Schaltfläche Lot - Bsp. (Lot : 0.01)
Schaltfläche Gewinn,Verlust - Bsp. (Gewinn:1,Verlust:-1) Schaltfläche PIP - Bsp. (PIP:100) Schaltfläche Open,Close - Bsp. Öffnen:3300,Schließen:3301 VLine M30,H1,H4,D1 IMport CSV Schaltfläche Alle Schaltfläche Zusammenfassung M30,H1,H4,D1 Gewinn,Verloren Nummer Bestellung _____________ Handel starten Anzeige im Chart ____________
FREE

Miraculous Indicator – 100 % Nicht-Repaint Forex- und Binary-Tool basierend auf dem Gann-Quadrat der Neun Dieses Video stellt den Miraculous Indicator vor, ein hochpräzises und leistungsstarkes Trading-Tool, das speziell für Forex- und binäre Optionen-Trader entwickelt wurde. Was diesen Indikator einzigartig macht, ist seine Grundlage auf dem legendären Gann-Quadrat der Neun und Ganns Gesetz der Vibration , was ihn zu einem der präzisesten Prognose-Tools im modernen Trading macht. Der Miraculous

This channel is based on the Hodrick-Prescott filter, which is a type of zero-lag digital filter. First, filtered Close price values are calculated. Then, a second filtering with a longer period is applied. This results in two arrays: HP and HPSlow. In the next step, the standard deviation of HP relative to HPSlow is computed, and a channel is constructed. The VHP channel PRT indicator displays the average spread value and the channel width relative to HPSlow (expressed as a percentage) at th
FREE
MetaTrader Market - Handelsroboter und technische Indikatoren stehen Ihnen direkt im Kundenterminal zur Verfügung.
Das MQL5.community Zahlungssystem wurde für die Services der MetaTrader Plattform entwickelt und steht allen registrierten Nutzern der MQL5.com Webseite zur Verfügung. Man kann Geldmittel durch WebMoney, PayPal und Bankkarten einzahlen und sich auszahlen lassen.
Sie verpassen Handelsmöglichkeiten:
- Freie Handelsapplikationen
- Über 8.000 Signale zum Kopieren
- Wirtschaftsnachrichten für die Lage an den Finanzmärkte
Registrierung
Einloggen
Wenn Sie kein Benutzerkonto haben, registrieren Sie sich
Erlauben Sie die Verwendung von Cookies, um sich auf der Website MQL5.com anzumelden.
Bitte aktivieren Sie die notwendige Einstellung in Ihrem Browser, da Sie sich sonst nicht einloggen können.