Neue technische Indikatoren für den MetaTrader 4 - 22
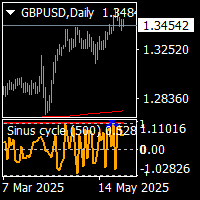
sinus-zyklus-indikator ist ein nicht repaint-indikator für mt4-terminal. Er funktioniert in allen Zeitfenstern und für alle Paare. geeignet für erfahrene Trader und Anfänger. es gibt sinus wawes. wenn die intensive Wellen erscheinen, ist es Trendwechsel Punkte. Level 1 oder -1 ist eine Trendumkehr. cnt Zahlen sind die Balken Zahlen auf dem Chart.es kann erhöht oder verringert werden. Minimum cnt Wert ist 500. Welle ist Standard 500 value.and kann nicht ändern wenn die Preise oben, Zyklus Ebene
Hauptmerkmale: So fortige BUY/SELL-Signale mit klaren Einstiegslevels 3 Take Profit Levels (TP1, TP2, TP3) - passen Sie Ihr Risiko/Ertrag an Dynamischer Stop Loss basierend auf der Marktstruktur Trendlinien-Breakout-Logik - erkennt automatisch die Breakout-Bestätigung S ignalbenachrichtigungen in Echtzeit (Alarme, E-Mails, Push-Benachrichtigungen) Funktioniert auf allen Zeitrahmen (M5 bis D1 empfohlen) Kompatibel mit allen Forex-Paaren, Gold, Indizes und Kryptowährungen Wie es funk

Dieser Indikator zeigt potenzielle Kursniveaus, Unterstützungs- und Widerstandsniveaus, höchste und niedrigste Kursniveaus für asiatische, europäische und amerikanische Sitzungen an. Er funktioniert für den Tag, den Sie auf der Benutzeroberfläche auswählen. Er ist geeignet für Gold, Bitcoin, alle Währungen, Rohstoffe, Kryptowährungen und alle Anlageinstrumente auf dem Metatrader. Sie können auf den Tag Handel Transaktionen leicht zu verwenden. Dieser Indikator ist für metatrader4 Plattform.
FREE
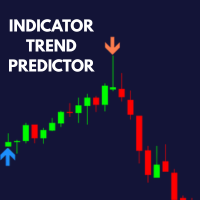
Easy Trend Predictor: Visueller Signalindikator für MT4 Der Easy Trend Predictor ist ein unkomplizierter und benutzerfreundlicher Indikator für MetaTrader 4, der klare Richtungspfeile anzeigt, die auf einer trendbasierten Logik basieren. Dieses Tool ist für jedes Symbol und jeden Zeitrahmen geeignet und hilft Ihnen, Klarheit in Ihre technische Analyse zu bringen, indem es potenzielle Veränderungen in der Kursbewegung visuell hervorhebt. Hauptmerkmale: Richtungspfeile
Zeigt auffällige Kauf- und

Automatisierte Protokollierung von Handelssitzungen und Echtzeit-PnL-Anzeige Übersicht Trade Journal Plus ist ein MetaTrader 4-Indikator, der Ihre Handelssitzungen automatisch dokumentiert und Echtzeit-Performance-Statistiken auf dem Chart anzeigt. Er hilft Händlern, Sitzungen effizient zu analysieren und zu überprüfen - ohne dass eine manuelle Protokollierung erforderlich ist. Hauptmerkmale Automatisches Session Logging
Zeichnet während des Handels automatisch Ein- und Ausstiege, Handelsdauer

Der Indikator wählt trending Paare in diesem Tag, wie es in screanshorts gezeigt. Er wurde entwickelt, um dem Benutzer die Arbeit sehr leicht zu machen. Wie der Indikator funktioniert Der Indikator zeigt 5 Trendpaare an und Ihre Aufgabe ist es, diejenigen auszuwählen, die zu Ihrer Strategie passen. Der Indikator ist für Daytrader geeignet und zeigt das Geschehen des Tages an. Der Indikator entspricht eher der Währungsstärke auf fortgeschrittenem Niveau. Der Indikator zeigt Trendpaare in Pips an

Dieser Indikator wurde entwickelt, um Ihnen bei der Lokalisierung von Trendpaaren auf den Devisenmärkten zu helfen .
Verfügbare Zeitrahmen M5 M15 M30 H1 H4 DAILY (empfohlen für Daytrading ) Wöchentlich Monatlich
In diesen Zeitrahmen zeigt der Indikator an, wie sehr sich die Märkte in den letzten 5, 15, 24, 7 und 30 Tagen bewegt haben und viele andere Zeitrahmen zeigen dasselbe an.
Der tägliche Zeitrahmen wird empfohlen, weil er angibt, welcher Trend an diesem Tag vorherrscht. Er wird für Tren
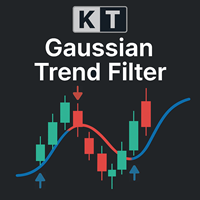
Der KT Gaussian Trend Filter kombiniert die Gauß-Filterung mit der linearen Regressionsglättung, um eine klare und präzise Trenderkennung zu ermöglichen. Er liefert leicht verständliche Kauf- und Verkaufssignale und zeigt gleichzeitig effektiv die langfristige Marktrichtung an.
Funktionen
Vollständig anpassbarer Gauß-Filter: Passen Sie Länge und Polanzahl an, um die Glättung feinzutunen und die Trenddarstellung zu verbessern. Verstärkung durch lineare Regression: Verfeinert das Glättungsergebni
Der KT Trend Reversal Probability Indikator berechnet in Echtzeit die Wahrscheinlichkeit eines Trendwechsels basierend auf einem verfeinerten RSI-Algorithmus. Diese Wahrscheinlichkeit wird als klarer Prozentwert angezeigt und hilft dir dabei, einzuschätzen, ob ein aktueller Trend an Stärke verliert oder ob sich ein neuer bildet. Egal ob du deine Einstiege planst oder deine Ausstiege optimierst – dieser Indikator verschafft dir einen datengestützten Vorteil bei deinen Trading-Entscheidungen.
Fu
Der Opening Range Breakouts Indikator ist ein sitzungsbasiertes Handelstool für Händler, die institutionelle Handelskonzepte wie ICT (Inner Circle Trader), Smart Money Concepts (SMC) und volumen- oder auftragsflussbasierte Strategien verfolgen. Dieser Indikator stellt wichtige Eröffnungsspannen der Sitzung dar und ermöglicht es Händlern, potenzielle Liquiditäts-Sweeps, Ausbruchszonen, Fakeouts und wichtige Intraday-Levels in den wichtigsten globalen Forex-Sitzungen zu ide
Minotaur Waves ist ein fortschrittlicher Marktanalyse-Indikator, der entwickelt wurde, um potenzielle Wendepunkte zu erkennen und Richtungswechsel des Preises mit hoher Genauigkeit zu bestätigen. Das System kombiniert die Stärke des Minotaur Oscillators mit einer dynamischen Struktur adaptiver Bänder und bietet saubere, zuverlässige visuelle Signale für gut fundierte Einstiegspunkte. Es ist kompatibel mit allen Währungspaaren, wobei die beste Performance bei EURUSD, GBPUSD und USDJPY in den Zeit
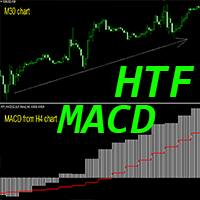
Crypto_Forex Indikator HTF MACD-Oszillator für MT4.
– HTF steht für „höherer Zeitrahmen“. – Der MACD-Indikator selbst ist einer der beliebtesten Indikatoren für Trendhandel. – Dieser Indikator eignet sich hervorragend für Multi-Time-Frame-Handelssysteme mit Price-Action-Einträgen oder in Kombination mit anderen Indikatoren. – Der HTF MACD-Indikator ermöglicht die Verknüpfung von MACDs aus höheren Zeitrahmen mit Ihrem aktuellen Chart – ein professioneller Handelsansatz. – Der Indikator verfügt
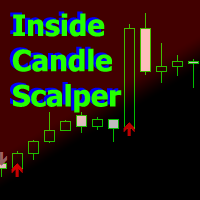
Inside Candle Scalper – Pfeilindikator mit Bestimmung der Marktdynamik. Der Algorithmus analysiert die Volatilität innerhalb der Kerze und identifiziert potenzielle Handelssignale.
Funktioniert auf der aktuellen Kerze, ohne hinter der Zeit zurückzubleiben (auf der aktuellen Kerze ist ein Flackern möglich), oder auf dem Schließen der Kerze, nachdem die Kerze geschlossen wurde, verschwindet der Pfeil nirgendwo.
Der Indikator führt keine Neudarstellung der Handelshistorie durch.
Der Indikator ist

Pulse Mark Pro – Präzision bei der Erkennung von Trendwenden Der PulseMark Pro Indikator wurde entwickelt, um frühzeitige Veränderungen in der Marktrichtung zu erkennen. Im Gegensatz zu Standardindikatoren, die sich ausschließlich auf die letzte Kerze stützen, verwendet PulseMark Pro eine eigene Logik, um den möglichen Beginn eines neuen Trends zu identifizieren – selbst wenn dies kurzfristig kontraintuitiv erscheint. Er bietet eine visuelle Darstellung von Impulswechseln durch farbcodierte Sign
Trend Flip Pro
Trend Flip Pro ist ein strukturbasiertes Signalsystem, das Richtungswechsel im Markt auf der Grundlage interner Momentum-Verschiebungen erkennt – ohne sich auf herkömmliche visuelle Overlays zu stützen. Jeder Pfeil markiert eine bestätigte Verschiebung der Kontrolle zwischen Käufern und Verkäufern, basierend auf der zugrunde liegenden Richtungsstärke – nicht auf oberflächlichen Kursbewegungen.
Kein Repainting – Feste Signale
Dieses Tool repainted nicht. Signale erscheinen nur,
ZONE CRACK ALPHA — STRATEGISCHE ERKENNUNG VON MARKTPHASENWECHSELN
Zone Crack Alpha wurde entwickelt, um strukturelle Übergänge im Preisverhalten durch ein zweistufiges Logiksystem zu identifizieren. Es nutzt Polaritätswechsel im Histogramm sowie visuelle Richtungshinweise, um potenzielle Breakout-Momente zu erfassen – ganz ohne Verzögerungen oder herkömmliche Indikatorlogik.
Signal-Logik
Das Verfahren basiert auf einem Histogramm-Crossover über der Null-Linie als Kernelement. Sobald ein Rich

Auric Pulse System
Präzise entwickelt für strategische Marktumschwünge
Das Auric Pulse System ist ein hochauflösendes Signalframework, das speziell für Trader entwickelt wurde, die strukturelle Klarheit in volatilen Märkten suchen – insbesondere im komplexen Umfeld von XAUUSD. Im Gegensatz zu herkömmlichen Werkzeugen, die auf visuelle Overlays oder verzögerte Momentum-Oszillatoren setzen, identifiziert dieses System Richtungswechsel basierend auf den inneren Mechanismen des Marktflusses und a

Snap Entry System
Entwickelt für präzise Ausführung unter Hochdruckbedingungen
Snap Entry System ist eine ausgefeilte Signalarchitektur, die speziell für Trader entwickelt wurde, die in volatilen Marktphasen höchste Präzision in Timing und Struktur verlangen. Die zentrale Logik kombiniert relative Bewegungsdynamiken mit richtungsbezogener Bestätigung und liefert taktische Einstiegspunkte, basierend auf internem Preisverhalten – nicht auf externen Overlays.
Bleiben Sie informiert
Treten Sie

TradeZones Fibonacci Pro – Dynamische Fibonacci-Zonen und intelligente Trading-Alarme Erkennen Sie automatisch wichtige Umkehrzonen mithilfe von Fibonacci. Verfeinern Sie Ihre Einstiege mit Präzision. TradeZones Fibonacci Pro ist ein professioneller Indikator, der automatisch die relevantesten Fibonacci-Level auf Ihrem Chart zeichnet und potenzielle Kauf- und Verkaufszonen basierend auf einem konfigurierbaren Zeitraum identifiziert. Mit einer intuitiven Benutzeroberfläche, integrierten Alarme
BreakAxis — Präzise Signale am Wendepunkt
Tritt dem Kanal bei, um keine Neuigkeiten zu verpassen: https://www.mql5.com/en/channels/forexnewadvisor
Signal-Logik auf Basis von Achsenkreuzungen
BreakAxis Signal wurde entwickelt, um Richtungswechsel basierend auf Achsenkreuzungen des Niveaus null zu erkennen.
Histogramm-Übergänge werden verwendet, um potenzielle Marktimpulse hervorzuheben, unterstützt durch visuelle Bestätigung in Form von Richtungspfeilen.
Signalbestätigung und Stabilität
Jed
Heiken Ashi Pro – Anpassbares Werkzeug zur Trendvisualisierung Heiken Ashi Pro ist ein MetaTrader-4-Indikator, der angepasste Heiken Ashi-Kerzen mit einer Vielzahl von Einstellmöglichkeiten generiert. Durch die Auswahl verschiedener gleitender Durchschnitte und Preisberechnungsmethoden eignet sich das Tool zur individuellen Darstellung von Markttrends. Hauptfunktionen: Enthält 34 Arten gleitender Durchschnitte, darunter SMA, EMA, HMA, KAMA, JMA, TEMA, DEMA, McGinley, Super Smoother, Gaussian, La
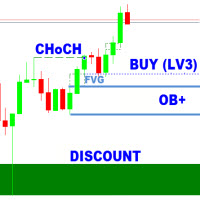
SMC Analyzer Single-Timeframe (STF) für MT4 Der SMC Analyzer STF MT4 ist ein leistungsstarkes Single-Timeframe Smart Money Concepts (SMC) Analysetool, das für präzise Handelsbestätigungen auf Basis der SMC-Kernkomponenten entwickelt wurde. Es bewertet die Marktstruktur auf vier Bestätigungsebenen unter Verwendung von Elementen wie Break of Structure (BOS), Change of Character (CHoCH), Order Blocks (OB), Fair Value Gaps (FVGs), Liquidity Zones und Higher Timeframe Trend Bias .
Jede Ebene hat kon

Volume Footprint Analysis ist ein präzisionsgefertigter, volumenbasierter Indikator, der das rohe Marktvolumen in ein intuitives, farbcodiertes Signalsystem umwandelt. Dieses Tool, das auf Konzepten der Volume Spread Analysis (VSA) und Smart Money-Prinzipien basiert, macht Schluss mit dem Rätselraten bei der Interpretation des Volumens und liefert Händlern klare, umsetzbare Erkenntnisse darüber, wann sie kaufen oder verkaufen sollten - auf jedem Zeitrahmen und für jedes Handelsinstrument. MT5-Ve
Dies ist ein leistungsstarker, sitzungsbezogener Ausbruchsindikator, der für ernsthafte Händler entwickelt wurde, die von Volatilität und Struktur profitieren. Der Indikator ist auf Präzision ausgelegt und identifiziert hochwahrscheinliche Ausbruchszonen während der Londoner und New Yorker Handelssitzungen - dort, wo sich der Markt mit Absicht bewegt. Hauptmerkmale: Session Range Detection
Erkennt und markiert automatisch die wichtigsten Kursbereiche der Londoner und New Yorker Sitzungen. Break
FREE

StochasticDivergence ist ein benutzerdefinierter Indikator für die Plattform MetaTrader 4 (MT4), der die Divergenz zwischen den Werten des stochastischen Oszillators (%K-Linie) von zwei Währungspaaren analysiert. Er vergleicht die Stochastik %K des Chartsymbols (erstes Symbol) mit einem benutzerdefinierten zweiten Symbol und zeigt beide %K-Werte und ihre absolute Differenz (Divergenz) in einem separaten Unterfenster an. Der Indikator bietet visuelles und auf Warnungen basierendes Feedback, um s
FREE

Der Auto-Fibonacci-Indikator ist ein professionelles technisches Analyseinstrument, das automatisch Fibonacci-Retracement-Levels auf der Grundlage der zuletzt geschlossenen Tages- (D1) oder 4-Stunden-Kerze (H4) zeichnet . Diese Niveaus werden von Händlern häufig verwendet, um wichtige Unterstützungs-, Widerstands- und Trendumkehrzonen zu identifizieren .
Diese Version ist für den manuellen Handel konzipiert und unterstützt eine leistungsstarke Handelsstrategie, die Fibonacci-Levels in Kombinati
FREE

Ultra Band ist ein Trendindikator, der für verschiedene Arten von Händlern entwickelt wurde, vom Scalp bis zum Long Term Trader. Da er den aktuellen Balkenpreis in die Berechnung einbezieht, sieht es so aus, als ob die Wiederholung erst nach dem Schließen des Balkens erfolgt und dann für immer bestehen bleibt. Strategie der Wahl für den Handel mit dem Ultra Band: KAUFEN am unteren Band / VERKAUFEN am oberen Band und Ausstieg, wenn der Preis das gegenüberliegende Band erreicht. VERKAUFEN Sie nach

RSIDivergence ist ein benutzerdefinierter Indikator für die Plattform MetaTrader 4 (MT4), der die Divergenz zwischen den Werten des Relative Strength Index (RSI) von zwei Währungspaaren analysiert. Er vergleicht den RSI des Chartsymbols (erstes Symbol) mit einem benutzerdefinierten zweiten Symbol und zeigt beide RSI-Werte und ihre absolute Differenz (Divergenz) in einem separaten Unterfenster an. Der Indikator bietet visuelles und auf Warnungen basierendes Feedback, um signifikante Divergenzniv
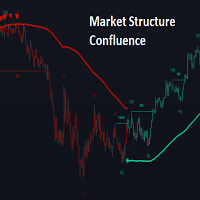
ÜBERBLICK
Dieses Skript heißt "Market Structure Confluence" und kombiniert die klassische Marktstrukturanalyse mit einem dynamischen volatilitätsbasierten Bandsystem, um Trend- und Momentumverschiebungen zuverlässiger zu erkennen. Es verfolgt wichtige Swing-Punkte (höhere Hochs, höhere Tiefs, niedrigere Hochs, niedrigere Tiefs), um den Trend zu definieren, und überlagert dann eine Basis und ATR-geglättete Volatilitätsbänder, um Ablehnungssignale zu erkennen und potenzielle Wendepunkte im Markt
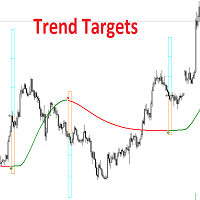
ÜBERBLICK
Dieses Skript kombiniert ein geglättetes Trendfolgemodell mit einer dynamischen Preisablehnungslogik und einer ATR-basierten Zielprojektion, um Händlern einen vollständigen visuellen Rahmen für den Handel mit Trendfortsetzungen zu bieten. Es überlagert den Preis und erkennt automatisch potenzielle Trendwechsel, bestätigt Ablehnungen in der Nähe von dynamischen Unterstützungen/Widerständen und zeigt berechnete Stop-Loss- und Take-Profit-Levels an, um ein strukturiertes Risiko-Ertrags-M

G0ldenZone - Präzise Umkehrzonen für den Profi-Handel Erkennen Sie wichtige Levels wie ein Profi! Der G0ldenZone-Indikator scannt automatisch das Kursgeschehen, um hochwahrscheinliche Umkehrzonen zu erkennen, indem er eine einzigartige Kombination aus: Price Action Pivots ( dynamische Unterstützungs-/Widerstandszonen). Fibonacci-Confluences ( kritische Retracement-Levels). Volumenprofil ( Bereiche mit hoher Akkumulation/Distribution). Warum Trader lieben G0ldenZone? Echtzeit-Benachrichti

Ich präsentiere Ihnen den hervorragenden technischen Indikator Grabber, der als eine vollständig einsatzbereite „All-Inclusive“-Handelsstrategie funktioniert.
In einem einzigen Code sind leistungsstarke Werkzeuge zur technischen Marktanalyse, Handelssignale (Pfeile), Alarmfunktionen und Push-Benachrichtigungen integriert. Jeder Käufer dieses Indikators erhält zusätzlich kostenlos: Grabber Utility: ein Tool zur automatischen Verwaltung offener Orders Schritt-für-Schritt-Videoanleitung: wie man de
Tauchen Sie ein in eine Handelsumgebung, in der Anpassungsfähigkeit auf Präzision trifft. Dynamic Grid Pro v1.7 bietet eine Reihe von Werkzeugen, die entwickelt wurden, um Ihren Ansatz am Markt zu verfeinern. Dieses System wurde mit der Absicht entwickelt, einen flexiblen Rahmen für die Ausführung von Grid-Trading-Strategien bereitzustellen. Seine Hauptfunktionalität liegt in der Fähigkeit, die Gitterparameter als Reaktion auf sich ständig ändernde Marktbedingungen dynamisch anzupassen. Funktio
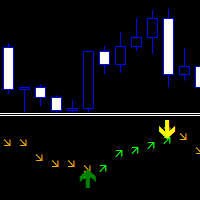
Direction Change Detector – Ein Trendindikator, der das Gleichgewicht zwischen bullischen und bärischen Bewegungen trennt. Es verfügt über zwei Pfeilreihen mit Signalen, die ihre Richtung bestätigen.
Kann als eigenständiger Indikator zum Erkennen eines Trends oder als zusätzliches Tool zum Eröffnen von Trades und Verfolgen von Signalrichtungen verwendet werden.
Anpassungsfähig an jeden Markt und Zeitrahmen. Beschönigt sein Zeugnis nicht in der Geschichte. Es gibt verschiedene Arten von Benachric
FREE
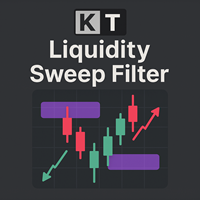
Der KT Liquidity Sweep Filter identifiziert und markiert kritische Liquiditätszonen. Er kombiniert diese Zonen mit klaren Preisreaktionen sowie einem adaptiven Trendfilter, um präzise Kauf- und Verkaufssignale zu generieren, die mit dem aktuellen Marktrend übereinstimmen. Er unterscheidet zwischen großen und kleinen Liquiditätssweep-Zonen. Große Zonen werden mit großen Pfeilen gekennzeichnet, kleinere mit kleinen Pfeilen, um eine einfache visuelle Unterscheidung zu ermöglichen. Große Pfeile: Wei

VWAP-Crossover-Signalindikator für MetaTrader 4
Entfesseln Sie präzises Trading mit dem VWAP-Crossover-Signalindikator!
Heben Sie Ihre Handelsstrategie mit dem VWAP-Crossover-Signalindikator auf ein neues Level – einem leistungsstarken und intuitiven Tool, das speziell für MetaTrader 4 entwickelt wurde. Entworfen für Trader, die Genauigkeit und Klarheit verlangen, nutzt dieser benutzerdefinierte Indikator den Volume Weighted Average Price (VWAP), um direkt auf Ihrem Chart aktionsfähige Kauf-
FREE

Gold Flux Signal – Nicht-neuzeichnendes Signalindikator für XAUUSD
Entwickelt für eine klare Signalgebung
– Das Gold Flux Signal wurde entwickelt, um klare und stabile Einstiege auf XAUUSD zu ermöglichen – ohne Repainting oder Backpainting
– Speziell konzipiert für Trendfolge- und Ausbruchstrategien, mit Fokus auf Klarheit statt überladenen Charts
– Der Indikator arbeitet ausschließlich auf geschlossenen Kerzen
– Optimiert für die Zeitrahmen M1, M5 und H1
Stabile visuelle Signale
– Einmal

Sniper Flip Zones – Präzises Kauf-/Verkaufssignalsystem
Ich habe Sniper Flip Zones entwickelt, um äußerst präzise KAUF- und VERKAUF-Signale zu generieren, indem Momente identifiziert werden, in denen sich der Impuls in trendstarken oder seitwärts gerichteten Märkten stark verändert. Es funktioniert hervorragend auf XAUUSD M1/M5, kann aber auf jedes Währungspaar und jeden Zeitrahmen angepasst werden, dank konfigurierbarer Parameter.
Join the channel to stay updated: https://www.mql5.com/en/chan

Der ICT New York Open Killzone Indikator wurde für Trader entwickelt, die Smart Money Concepts (SMC) , ICT-Handelsmodelle und liquiditätsbasierte Strategien im Forex-Markt verfolgen. Dieses Tool markiert die New York Open Killzone von 11:00 bis 14:00 Uhr GMT , eine kritische Zeit, in der institutionelles Volumen oft zu großen Kursbewegungen führt. Der Indikator zeigt Session-Ranges , Market-Maker-Ranges , Liquiditäts-Sweeps , FVG-Zonen (Fair Value Gaps)
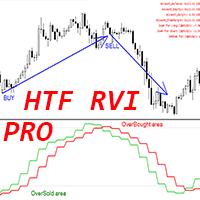
Crypto_Forex Indikator HTF RVI Pro Oszillator für MT4.
– Verbessern Sie Ihre Handelsmethoden mit dem professionellen HTF RVI Pro Oszillator für MT4. HTF steht für „Higher Time Frame“. – RVI ist einer der besten Oszillatoren zur Erkennung von Trendänderungen und Einstiegen in überverkauften/überkauften Bereichen. – Dieser Indikator eignet sich hervorragend für Multi-Time-Frame-Handelssysteme mit Price-Action-Einstiegen in überverkauften/gekauften Bereichen. – Mit dem HTF RVI Pro Indikator könne
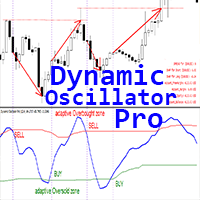
Dynamic Oscillator Pro – ein fortschrittlicher, benutzerdefinierter Crypto_Forex-Indikator – ein effizientes Handelstool für MT4!
– Neue Oszillatoren-Generation – siehe Bilder zur Bedienung. – Der Dynamic Oscillator verfügt über adaptive Überverkauft-/Überkauft-Zonen. – Der Oszillator ist ein Hilfsmittel, um genaue Einstiegspunkte in Überverkauft-/Überkauft-Bereichen zu finden. – Überverkauft: unterhalb der grünen Linie, Überkauft: oberhalb der roten Linie. – Deutlich genauer als Standard-Oszi

Delta Trigger Indicator
Clear signals. Fast alerts. No repaint.
Delta Trigger ist ein präziser Pfeilindikator, der sofort auf Trendveränderungen reagiert, basierend auf den DI+ und DI– Linien des ADX. Er liefert saubere Kauf-/Verkaufssignale – ohne Neuzeichnung, ohne Verzögerung und ohne Verschwinden der Signale.
Bestes Paar: XAUUSD
Delta Trigger funktioniert auf allen Forex-Paaren und Zeitrahmen (von M1 bis H4 und darüber hinaus), aber er erzielt besonders starke Ergebnisse auf XAUUSD, wo
Ghost Entry Signal ist ein nicht-repaintender Trendfolge-Indikator, der für hochpräzise Handelseinträge entwickelt wurde. Er kombiniert dynamische Momentum-Erkennung, Preisaktions-Filter und eine proprietäre Wechsel-Logik, um falsche Signale zu vermeiden und saubere KAUF/VERKAUF-Signale zu liefern. Er funktioniert am besten auf EURUSD, USDJPY und GBPUSD in den Zeitrahmen M1, M5, M15 und M30 .
Bleiben Sie informiert: https://www.mql5.com/en/channels/forexnewadvisor
Der Signal-Engine umfasst: Ad
SwitchStrike Signal – Indikatorübersicht
Der SwitchStrike Signal ist ein benutzerdefinierter Indikator für MetaTrader 4 (MT4), der entwickelt wurde, um Trader bei der Erkennung potenzieller Trendwenden zu unterstützen, indem Preisbewegungen und Volatilität analysiert werden.
Tritt dem Kanal bei, um über neue Updates informiert zu bleiben: https://www.mql5.com/en/channels/forexnewadvisor
Kernlogik und Funktionalität
Beim Start richtet der Indikator mehrere Puffer ein, um berechnete Daten zu
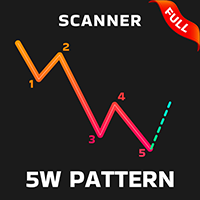
Kontaktieren Sie mich nach der Bezahlung , damit ich Ihnen das Benutzerhandbuch als PDF-Datei zusenden kann. 5W-Muster Einführung Das 5W-Muster tritt auf, wenn der Preis einen alternierenden 5-Wellen-Zyklus mit seiner Volatilität bildet. In der Tat ist das 5W-Muster eine Preisserie mit abwechselnden HH oder LL (höheres Hoch oder niedrigeres Tief), was das Hauptmerkmal eines Trends ist. Das 5W-Muster sollte die Eigenschaft haben, dass sich die Wellen nicht überschneiden, außerdem werden die Punk

Haben Sie sich jemals gefragt, warum Ihre Angebots- und Nachfragezonen nicht funktionieren , selbst wenn alles "perfekt" aussieht? Die Wahrheit ist, dass Sie nicht im Unrecht sind - Sie beobachten nur die Reaktion, nicht den Grund. Es ist nicht wie bei diesen willkürlichen Währungsstärkemessern, die sich auf nachlaufende Indikatoren wie RSI, CCI oder ähnliche Instrumente stützen, um Stärke oder Schwäche zu erraten. Bei diesem Ansatz wird auf die Vergangenheit reagiert - nicht auf die Ursache. P

Indikator (beinhaltet Volumenprofil + Orderblöcke) - ein revolutionärer Indikator, der zwei der leistungsfähigsten Konzepte der modernen technischen Analyse kombiniert: Volumenprofile und Orderblöcke institutioneller Akteure. Mit diesem Tool können Sie sehen, was den meisten Händlern verborgen bleibt, und Sie erhalten einen bedeutenden Vorteil auf dem Markt.
Die wichtigsten Vorteile des Indikators: Visualisierung von "intelligentem Geld": Zeigt deutlich die Bereiche, in denen sich große Marktte

QuickPivora ist ein fertiges Handelssystem für Scalping. Es zeigt an, wann ein Geschäft zu eröffnen ist, in welche Richtung es zu eröffnen ist und wann es zu schließen ist. QuickPivora ist ein umfassendes Handelssystem, das viele Indikatoren auf dem Chart ersetzt, da seine Signale bereits die Messwerte von Trendindikatoren, Oszillatoren und Kanalindikatoren berücksichtigen. Der Vorteil des QuickPivora-Handelssystems ist, dass es sowohl für Anfänger als auch für Profis geeignet ist, da es eine w

Fibonacci Dynamic Channels Ultimate Pro - MetaTrader-Indikator
(Ideal für den Handel mit binären Optionen | Nicht-Neuberechnung | Erweiterte Filterung) https://youtu.be/0ZT3gg29_ss?si=jG86Z0fUARrXg8Aa Überblick Der Fibonacci Dynamic Channels Ultimate Pro ist ein hochentwickeltes Handelsinstrument, das entwickelt wurde, um mit Hilfe von Fibonacci-Verhältnissen hochwahrscheinliche Umkehrzonen und Trendfortsetzungen zu identifizieren. Er kombiniert dynamische Kanäle, Multi-Timeframe-Filter und Ech
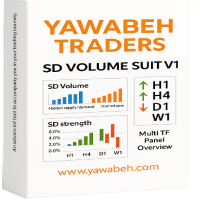
Yawabeh SD Pro - Professioneller Indikator für Angebot und Nachfrage Handeln Sie intelligenter mit volumenbestätigten Angebots-/Nachfrage-Zonen Unser institutioneller Algorithmus identifiziert Umkehrzonen mit hoher Wahrscheinlichkeit, bevor der Preis reagiert, und verschafft Ihnen so einen Vorteil bei Devisen, Kryptowährungen und Aktien. Hauptmerkmale Multi-Timeframe-Bestätigung
- Zeigen Sie die Trendstärke in mehreren Zeitrahmen gleichzeitig an
- Richten Sie Ihre Trades auf das Momentum in hö
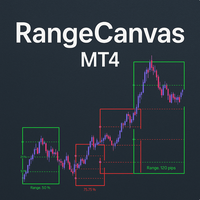
Tägliche Range-Boxen : Der Indikator zeichnet rechteckige Kästchen um die Höchst- und Tiefstkurse jedes Tages und schafft so eine klare visuelle Begrenzung für die tägliche Handelsspanne. Farbkodierte Logik : Grüne Boxen , wenn der aktuelle Kurs (oder Schlusskurs) über dem Tageseröffnungswert liegt Rote Kästchen , wenn der aktuelle Kurs unter dem Tageseröffnungswert liegt Prozentuale Level-Linien : Innerhalb jedes Kästchens werden drei horizontale Linien bei: 25% der täglichen Spanne 50% der Ta
FREE

Der Swing-High-Low-Indikator ist ein unverzichtbares Werkzeug für Händler, die sich auf Preisaktionen verlassen. Er markiert automatisch wichtige Umkehrpunkte (Swing Highs in rot, Swing Lows in grün) und hilft Ihnen, Trends zu visualisieren, Ausbrüche zu erkennen und präzise Trendlinien zu zeichnen. Durch die Hervorhebung dieser kritischen Niveaus zeigt der Indikator Verschiebungen in der Marktstruktur auf - ob sich der Trend verstärkt, umkehrt oder in eine Konsolidierung übergeht. Der Indikator
FREE
Hauptmerkmale des Indikators: Kauf- und Verkaufssignale: Der Indikator generiert Kauf- und Verkaufssignale auf der Grundlage bestimmter Bedingungen. Er verwendet den Crossover des Fast Moving Average (Fast MA) und des Slow Moving Average (Slow MA), um Markteintritte zu bestimmen. Der RSI (Relative Strength Index) wird verwendet, um Kaufsignale zu erkennen, wenn der RSI über 50 und unter 75 liegt. Es werden auch Unterstützungs- und Widerstandsniveaus zur zusätzlichen Bestätigung von Signalen berü
FREE

Erkennen Sie Muster sofort mit unserem fortschrittlichen Handelsindikator Möchten Sie wichtige Candlestick-Muster wie Engulfing, Doji, Marubozu, Harami, Hanging Man, Shooting Star, Evening Star, Hikkake, Dark Cloud Cover oder Black Crow sofort erkennen, wenn sie sich bilden? Mit diesem leistungsstarken Indikator können Sie alle 28 Währungspaare in Echtzeit überwachen und erhalten sofortige Warnungen, sobald eines dieser entscheidenden Muster erkannt wird. Hauptmerkmale: Echtzeit-Warnungen: Sie w
FREE

Gold EMA-SMA Crossover Indikator für MT4 - kostenloser Download Steigern Sie Ihren Goldhandel mit diesem kostenlosen, auffälligen Indikator! Suchen Sie nach einem leistungsstarken Tool, um Ihre Goldhandelsstrategie (XAUUSD) zu verbessern? Der Gold EMA-SMA Crossover Indicator ist ein speziell entwickelter MetaTrader 4 (MT4)-Indikator, der Händlern helfen soll, wahrscheinliche Kauf- und Verkaufschancen auf dem sich schnell bewegenden Goldmarkt zu erkennen. Und das Beste daran? Er ist völlig koste
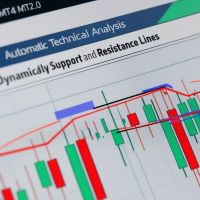
SRline- Zeichnet automatisch intelligente Unterstützungs- und Widerstandszonen SRline ist ein einfacher, aber leistungsstarker Indikator, der automatisch Unterstützungs- und Widerstandszonen auf der Grundlage fraktaler Muster erkennt. Kein manuelles Zeichnen, kein Rätselraten - jedes Level wird mithilfe eines intelligenten Algorithmus genau berechnet. Hauptmerkmale: Automatische Erkennung von fraktalen Hochs und Tiefs
Zeichnet Pfeilmarkierungen für Unterstützung/Widerstand direkt auf
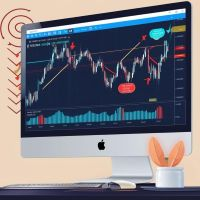
Smart Trend Forecasting - Zuverlässiger mittelfristiger Trendindikator Smart Trend Forecasting ist eine modifizierte Version eines klassischen trendbasierten Indikators, der ursprünglich von Wizard Serg entwickelt und im Forex Magazine #104 vorgestellt wurde. Diese verbesserte Version, die für den mittelfristigen Handel optimiert ist, hilft Händlern, Trendrichtungen und Momentumverschiebungen mit akustischen Warnsignalen und visuellen Markierungen zu erkennen. Hauptmerkmale: S lope-basie
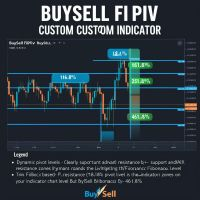
BuySell FibPiv - Fibonacci-Pivot-Levels mit Buy/Sell-Zonen BuySell FibPiv ist ein leistungsstarker benutzerdefinierter Indikator, der dynamische Pivot-Levels berechnet und Fibonacci-basierte Unterstützungs-/Widerstandszonen für präzise Intraday- und Swing-Trading-Entscheidungen visualisiert. Er wendet auf intelligente Weise fortgeschrittene Niveaus wie 161,8%, 261,8% und 461,8% an und hilft Händlern, wichtige Umkehr- oder Fortsetzungsbereiche zu antizipieren. Hauptmerkmale: Berechnet Fibona
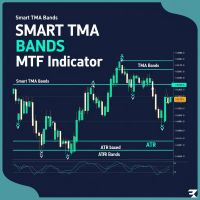
Smart TMA Bands MTF - Adaptiver Trendkanal mit Multi-Timeframe-Unterstützung Smart TMA Bands MTF ist ein leistungsstarker und adaptiver Trendfolgeindikator, der auf dem gleitenden Dreiecksdurchschnitt (TMA) und dynamischen ATR-basierten Bändern basiert. Er wurde für Trader entwickelt, die Klarheit über die Marktrichtung und die Preisvolatilität über mehrere Zeitrahmen hinweg suchen. Hauptmerkmale: Zentrierter dreieckiger gleitender Durchschnitt (TMA) : Glättet die Preisbewegung für eine kl

Color Stochastic - Smarter Stochastic Cross mit DCA Insights
Übersicht Color Stochastic ist eine erweiterte und visuell optimierte Version des klassischen Stochastik-Oszillators. Er zeigt nicht nur die Marktdynamik an, sondern identifiziert auch intelligente Einstiegspunkte mit Hilfe einer DCA-Strategie (Dollar Cost Averaging). Mit klaren, farbcodierten Pfeilen für Kauf-/Verkaufssignale, die auf stochastischen Überkreuzungen auf extremen Niveaus basieren, können Händler rechtzeitig und sic
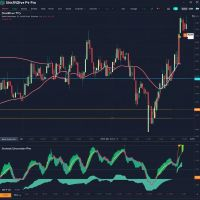
StochDiver PRO - Intelligenter stochastischer Divergenz-Detektor Überblick: StochDiver PRO ist ein fortschrittlicher Indikator zur Erkennung von Divergenzen, der sowohl reguläre als auch versteckte Divergenzen zwischen der Preisbewegung und dem Stochastik-Oszillator identifiziert. Er ist besonders nützlich für Trader, die DCA (Dynamic Cost Averaging) oder Umkehrstrategien anwenden. ️ Hauptmerkmale: Erkennt bullishe und bearishe Divergenzen (regelmäßig und versteckt) Zeichnet Preistrend
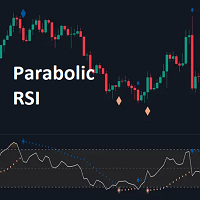
Der Parabolic RSI Indikator wendet den Parabolic SAR direkt auf den Relative Strength Index (RSI ) an. Diese Kombination hilft Händlern, Trendverschiebungen und potenzielle Umkehrpunkte innerhalb des RSI-Rahmens zu erkennen. Der Indikator liefert sowohl regelmäßige als auch starke Signale , je nachdem, ob der Parabolic SAR die RSI-Schwellenwerte über- oder unterschreitet.
KEY FEATURES
Parabolic SAR Applied to RSI - Verfolgt Momentum-Verschiebungen innerhalb des RSI-Indikators.
Dynamische S
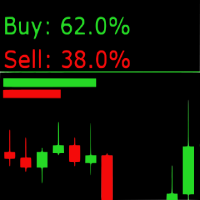
Sentiment-Markt-Indikator: Echtzeit-Marktsentiment-Anzeige Der Sentiment-Marktindikator ist ein Echtzeit-MQL4-Tool, das die aktuelle Kauf-/Verkaufsstimmung direkt auf Ihrem MetaTrader 4-Chart anzeigt. Er wurde entwickelt, um Ihre technische Analyse zu unterstützen und bietet eine visuelle Darstellung der Marktpositionierung, um Ihren Entscheidungsprozess zu unterstützen. Wichtigste Merkmale Live-Sentiment-Anzeige
Anzeige der prozentualen Aufschlüsselung der Kauf- und Verkaufsstimmung in Echtzei

Ichimoku Volatility Pro ist ein fortschrittlicher Ichimoku-Indikator, der dynamisch an die Marktvolatilität angepasst wird und klare visuelle Signale sowie eine präzise Trenderkennung liefert. Er kombiniert die Klarheit der traditionellen Ichimoku-Wolke mit einem ausgeklügelten volatilitätsbasierten Anpassungsmechanismus, der die Signalgenauigkeit und Reaktionsfähigkeit verbessert. Dieser professionelle Indikator skaliert automatisch die wichtigsten Ichimoku-Komponenten (Tenkan-Sen, Kijun-Sen,
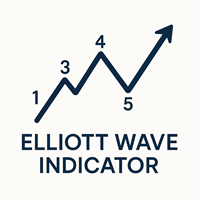
Elliott-Wellen-Theorie-Indikator für Meta Trader 4 Der Elliott-Wellen-Theorie-Indikator wurde basierend auf einem der professionellen Forex-Konzepte entwickelt. Dieser Indikator kann die Marktstruktur als Wellen darstellen und Spitzen als Aufwärts- und Abwärtswellen von 1 bis 5 zählen. Dadurch kann der Nutzer die Elliott-Wellen erkennen und bei neuen Nummerierungen Benachrichtigungen erhalten. Der Indikator enthält zwei Wellentypen: Hauptwelle und Nebenwelle, die jeweils in unterschiedlichen Far
FREE
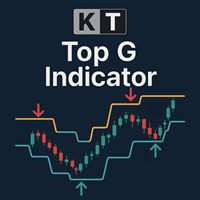
KT Top G ist ein auf Preisaktionen basierender Indikator, der eine intelligente Kanalanalyse kombiniert, um potenzielle Markt-Tops und -Bottoms zu erkennen. Sobald eine mögliche Umkehr identifiziert wird, erscheinen deutlich sichtbare Pfeile im Chart – ein früher Hinweis, bevor der Markt dreht. Große Pfeile: Markieren wahrscheinliche Hoch- und Tiefpunkte des Marktes durch Erkennung von Preiserschöpfung und Momentumwechsel. Kleine Pfeile: Deuten auf Wendepunkte mit geringerer Wahrscheinlichkeit h

Rejection Confirmation Indikator - Price Action Analyse-Tool Erweiterte Pin Bar Erkennung und Marktumkehr-Analyse Dieser MT4/MT5-Indikator analysiert Preisablehnungsmuster und konzentriiert sich speziell auf Pin Bar Formationen zur Identifizierung potenzieller Marktumkehrpunkte. Das Tool bietet visuelle Bestätigung von Price Action Signalen basierend auf etablierten technischen Analyseprinzipien. Zentrale Analysemethode Der Indikator verwendet Preisablehnungsmuster-Erkennung um: Pin Bar Formatio

TURBO ENTRY SYSTEM
Hochgeschwindigkeits-Krypto-Signale – Funktioniert auch mit Forex-Paaren
Das Turbo Entry System wurde mit dem Fokus auf Kryptowährungen – insbesondere BTC/USD entwickelt, ist jedoch auch vollständig kompatibel mit den wichtigsten Forex-Paaren . Es ist optimiert für präzises Scalping und bietet Signale ohne Nachbearbeitung und ohne Verzögerung zwischen Preisaktion und visueller Benachrichtigung.
Kein Rätselraten, keine Vorlagen, keine verborgene Logik . Ziehen Sie den Indik

Pairs Trading Z-Score Optimized ist ein benutzerdefinierter Indikator für die Plattform MetaTrader 4 (MT4), der den Paarhandel unterstützt, indem er den Spread zwischen zwei Währungspaaren mithilfe von Z-Score-Berechnungen und Stationaritätstests analysiert. Der Indikator arbeitet mit einem einzigen Paar (dem Symbol des Charts und einem benutzerdefinierten zweiten Symbol) und zeigt Z-Score-Werte, Schwellenwerte und Handelssignale in einem Unterfenster mit optionalen Pfeilen im Hauptchart an. Der
Volume Thermal Vision - Erweiterte Volumenanalyse für MetaTrader 4 Nutzen Sie die Möglichkeiten der Volumenanalyse mit Volume Thermal Vision, einem hochentwickelten Indikator zur Verbesserung Ihrer Handelsentscheidungen. Dieses von Jean Roso entwickelte Tool bietet eine dynamische Visualisierung der Volumenintensität durch eine anpassbare Heatmap, die es Händlern ermöglicht, Markttrends und potenzielle Umkehrungen präzise zu erkennen. Hauptmerkmale: Multi-Protokoll-Visualisierung: Wählen Sie au
MetaTrader Market bietet jedem Entwickler eine einfache und bequeme Plattform für den Verkauf von Programmen.
Wir unterstützen Sie bei der Veröffentlichung des Produkts und beraten Sie gerne, wie man eine Beschreibung für den Market vorbereitet. Alle Produkte, die im Market verkauft werden, sind durch eine zusätzliche Verschlüsselung geschützt und können nur auf dem Rechner des Kunden gestartet werden. Illegales Kopieren ist ausgeschlossen.
Sie verpassen Handelsmöglichkeiten:
- Freie Handelsapplikationen
- Über 8.000 Signale zum Kopieren
- Wirtschaftsnachrichten für die Lage an den Finanzmärkte
Registrierung
Einloggen
Wenn Sie kein Benutzerkonto haben, registrieren Sie sich
Erlauben Sie die Verwendung von Cookies, um sich auf der Website MQL5.com anzumelden.
Bitte aktivieren Sie die notwendige Einstellung in Ihrem Browser, da Sie sich sonst nicht einloggen können.