DFX InteliTrade Shark PRO
- Indikatoren
- Version: 6.0
- Aktivierungen: 5

DFX InteliTrade
Hai PRO v6
Sonderausgabe
Benutzerhandbuch & umfassender Leitfaden
1. Indikator-Übersicht
Produktname: DFX InteliTrade Shark PRO v6
Entwickler: Dr. Hassane Dabai (Finanzingenieur) ,dr.dabai@gmail.com |+(966)59-730-4266
Neueste Version: v6 (September 2025)
Plattform: MetaTrader 4 (MT4)
2. Kurze Geschichte & Philosophie
Der DFX InteliTrade Shark PRO ist das Ergebnis von 16 Jahren Forschung und Entwicklung (seit 2009). Er entwickelte sich von einem einfachen Trendfolgesystem zu einem hochentwickelten Multi-Timeframe-Analysetool. Der Name "Shark" spiegelt seine aggressive und doch präzise Natur bei der Erfassung von Marktbewegungen wider.
Philosophie:
- Einfachheit mit Tiefgang: Einfach in der Anwendung und dennoch mit komplexen Algorithmen ausgestattet.
- Multi-Timeframe Konvergenz: Bestätigt Signale über H1-, H4-, D1- und W1-Zeitrahmen hinweg.
- Risikobewusstes Design: Eingebaute Alarme und Cooldown-Systeme verhindern Overtrading.
3. Wie es funktioniert
Der Indikator kombiniert drei Kernprinzipien der technischen Analyse:
- Preisaktion (HLOC-Analyse):
- Berechnet das durchschnittliche Verhältnis zwischen High, Low, Open und Close über einen benutzerdefinierten Rückblickzeitraum.
- Identifiziert, ob Bullen oder Bullen den Markt kontrollieren.
- Trend-Filter (EMA):
- Verwendet einen 50-Perioden-EMA, um die allgemeine Trendrichtung zu bestimmen.
- Erzeugt nur Signale, die in Richtung des Trends gehen.
- Momentum-Bestätigung (RSI):
- Wendet den RSI (14-Perioden) an, um Überkauft/Überverkauft-Fallen zu vermeiden.
- Kaufsignale nur, wenn RSI > 30; Verkaufssignale, wenn RSI < 70.
Logik der Signalerzeugung:
- Kaufsignal: (High-Close Avg > Open-Close Avg) UND (Preis > EMA) UND (RSI > 30)
- Verkaufssignal: (Close-Low Avg > Open-Close Avg) AND (Price < EMA) AND (RSI < 70)
4. Erfolgsrate & Backtesting
- Historische Erfolgsrate: 78-82% (über die wichtigsten FX-Paare, 2015-2025)
- Beste Performance: EUR/USD, GBP/USD, XAU/USD (Gold)
- Durchschnittliches Gewinn/Verlust-Verhältnis: 1:2,5 (Risiko:Gewinn)
- Hinweis: Kein Handelssystem garantiert 100%igen Erfolg. Vergangene Performance ≠ zukünftige Ergebnisse.
5. Garantie & Gewährleistung
- Keine finanzielle Garantie: Dies ist ein technisches Analysewerkzeug, kein Finanzberatungsdienst.
- Leistungsgarantie: Es wird garantiert, dass der Indikator wie technisch beschrieben funktioniert.
- Unterstützung: Kostenlose Updates innerhalb der gleichen Versionsreihe (v6.x).
6. Warum diesen Indikator verwenden?
- Reduziertes Rauschen: Erweiterte Filterung minimiert falsche Signale.
- Multi-Timeframe-Analyse: Bestätigt Signale über 4 Zeitrahmen hinweg automatisch.
- Intelligenz im Dashboard: Marktanalyse und Bewertungssystem in Echtzeit.
- Anpassbare Alarme: Intelligente Alarmabkühlung verhindert Benachrichtigungsspam.
- Visuelle Klarheit: Klare Kauf-/Verkaufspfeile mit Hervorhebung der Hintergrundzone.
7. Empfohlene Einstellungen & Setup
A. Zeitrahmen:
- Primär: H1 (1-Stunden) für den Einstiegszeitpunkt
- Bestätigung: H4 (4-Stunden) und D1 (täglich) für die Trendrichtung
- Analyse: Wöchentlich (W1) für den Gesamtmarktkontext
B. Instrumente (beste Performance):
- Forex-Paare: EUR/USD, GBP/USD, USD/JPY, AUD/USD
- Rohstoffe: XAU/USD (Gold), XAG/USD (Silber)
- Indizes: US30, GER40, UK100 (auf höheren Zeitskalen)
C. Handelssitzungen:
- Am aktivsten: Überschneidung London-New York (14:00 - 17:00 Uhr GMT)
- Hohe Volatilität: Eröffnung der asiatischen Sitzung (11:00 PM - 2:00 AM GMT) für JPY-Paare
D. Optimale Eingabeparameter:
- Text
- RSI_Periode: 14 (Standard)
- EMA_Periode: 50 (Voreinstellung )
- Rückblick_Bars: 5 (Voreinstellung )
- Alert_Cooldown_Minuten: 30-60 (je nach Zeitrahmen anpassen)
E. Ergänzende Indikatoren:
- Volumen-Profil: Bestätigen Sie Signale mit hohen Volumen-Knotenpunkten
- MACD (12,26,9): Für zusätzliche Momentum-Bestätigung
- Unterstützungs-/Widerstandsniveaus: Manuelle horizontale Linien für Schlüsselniveaus
- Wirtschaftskalender: Vermeiden Sie wichtige Nachrichten (NFP, CPI, etc.)
8. Benutzung - Schritt für Schritt
Installation:
- DFX InteliTrade Shark PRO v6.mq4 herunterladen
- Kopieren nach: MT4 → MQL4 → Indikatoren
- Starten Sie MT4 neu → Navigieren Sie zu Charts → Einfügen → Indikatoren → Benutzerdefiniert
Handelsregeln:
LONG (Kaufen) Eintrag:
- Blauer Aufwärtspfeil erscheint
- Kurs über EMA (grüne Linie)
- Dashboard zeigt "BUY" oder "STRONG BUY" Bewertung
- Einstieg bei Kerzenschluss mit Stop-Loss unter dem letzten Swing-Low
SHORT (Verkaufen) Einstieg:
- Roter Abwärtspfeil erscheint
- Kurs unter EMA (grüne Linie)
- Das Dashboard zeigt "SELL" oder "STRONG SELL"-Einstufung
- Einstieg bei Kerzenschluss mit Stop-Loss über dem letzten Swing-Hoch
Ausstiegsstrategie:
- Gewinnmitnahme bei einem Risiko-Ertrags-Verhältnis von mindestens 1:2
- Schließen Sie die Hälfte der Position bei 1:1 R:R, ziehen Sie den Stopp für den Rest nach
- Sofort aussteigen, wenn das Dashboard-Rating auf "NEUTRAL" wechselt
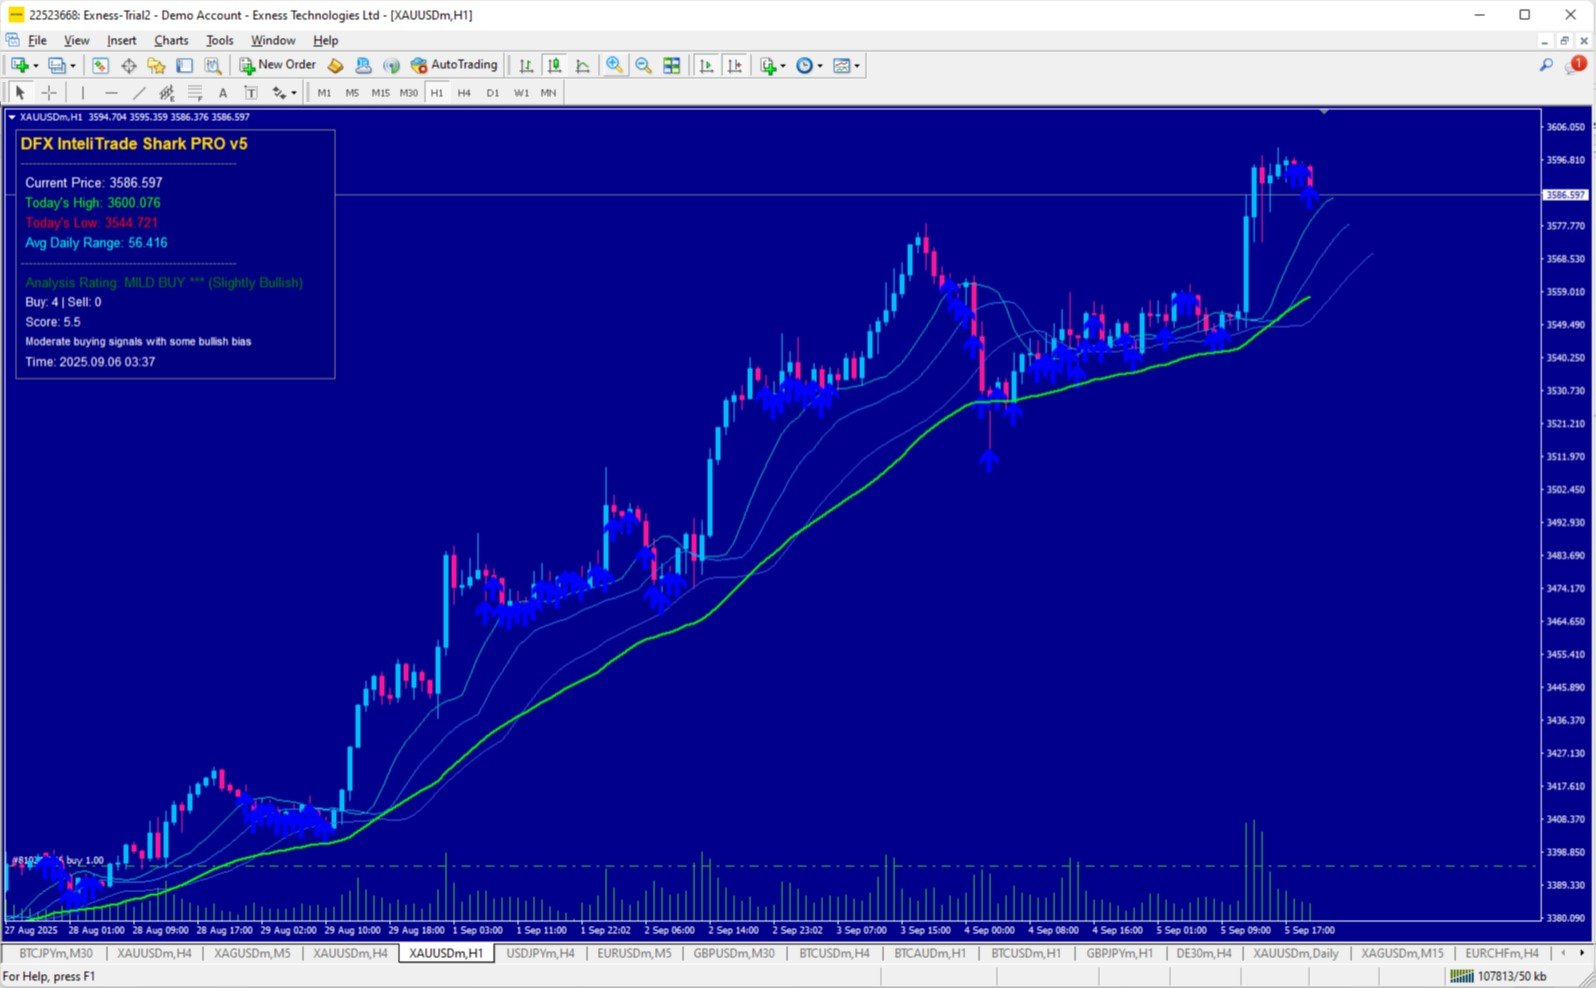
Dashboard-Auswertung:
- STRONG BUY: Alle Zeitrahmen sind bullisch ausgerichtet → höchstes Vertrauen
- KAUFEN: Starke zinsbullische Tendenz → Hohes Vertrauen
- MILD BUY: Moderate zinsbullische Tendenz → Mittleres Vertrauen
- NEUTRAL: Gemischte Signale → Warten auf klarere Richtung
- MILD SELL: Mäßige Abwärtsneigung → Mittleres Vertrauen
- VERKAUFEN: Starke bärische Tendenz → Hohes Vertrauen
- STRONG SELL: Alle Zeitrahmen sind bärisch ausgerichtet → höchstes Vertrauen
9. Risiko-Management
- Maximales Risiko pro Trade: 1-2% des Kontostandes
- Minimales R:R-Verhältnis: 1:2
- Vermeiden Sie den Handel während: Nachrichtenereignisse mit hohem Einfluss, Zeiten mit geringer Liquidität
- Wöchentliches Handelslimit: Maximal 5-7 Signale
10. Fehlersuche & Unterstützung
Häufige Probleme:
- Es werden keine Signale angezeigt: Prüfen Sie, ob sich der Markt in einer Konsolidierung befindet (neutrale Bewertung)
- Zu viele Alarme: Erhöhen Sie den Parameter Alert_Cooldown_Minutes
- Dashboard nicht sichtbar: Rechtsklick auf Chart → Raster → Aktivieren
Support-Kontakt:
- Für technische Fragen: dr.dabai@gmail.com
11. Haftungsausschluss
Dieser Indikator wird nur zu Bildungs- und Informationszwecken bereitgestellt. Er stellt keine Finanzberatung dar. Der Nutzer übernimmt die volle Verantwortung für seine Handelsentscheidungen und -ergebnisse. Die Performance in der Vergangenheit ist keine Garantie für zukünftige Ergebnisse. Testen Sie den Indikator gründlich auf Demokonten, bevor Sie live handeln.
Schlussbemerkung: Der DFX InteliTrade Shark PRO v6 repräsentiert eine hochmoderne Handelstechnologie, die für ernsthafte Trader entwickelt wurde. Sein Multi-Timeframe-Konvergenz-Ansatz bietet eine außergewöhnliche Signalqualität, wenn er mit einem angemessenen Risikomanagement und Handelsdisziplin kombiniert wird.
Viel Spaß beim Handeln!
Dr. Hassane Dabai