RenkoFromRealTicks

4.5

This non-trading expert utilizes so called custom symbols feature (available in MQL API as well) to build renko charts based on history of real ticks of selected standard symbol. RenkoFromRealTicks generates custom symbol quotes, thus you may open many charts to apply different EAs and indicators to the renko. It also transmits real ticks to update renko charts in real time.

The generated renko chart uses M1 timeframe. It makes no sense to switch the renko chart to a timeframe other than M1. The start time of a "minute" bar does normally correspond to the start time of renko box. The end time of a such "minute" bar is dummy (MetaTrader does not allow for bars with different duration), instead you should look at start time of the next "minute" bar. Optionally, you may enable markup of the boxes by close time (see CloseTimeMode below).

After its placement on a chart, RenkoFromRealTicks downloads tick history and generates renko bars for the custom symbol. This may take a while and require additional space on the disk. EA shows a progress in the comment. When the process is finished, the comment looks like this:

RenkoChart(100pt): open EURUSD_T_r100 / 1000 bars

where 100pt is the requested box size in points, EURUSD_T_r100 is a customizable symbol name, 1000 is a number of generated boxes (if EA is running for the very first time, this is the total number of renko bars, but if it continues on results of a previous terminal session, the number of new boxes can be a few, because only most recent, missing boxes are generated).

You may build renko faster and with less resources using RenkoCharts. But RenkoFromRealTicks is more precise and feature-reach.


Unique feature - volume delta per box. The delta is encoded in a special way, because MetaTrader does not support negative volumes. This is why you need free CustomVolumeDelta indicator to view it.

Parameters

  • RenkoBoxSize - box size in points, by default - 100;
  • ShowWicks - enable/disable wicks on renko, by default - true;
  • EmulateOnLineChart - enable/disable ticks emulation on renko charts, by default - true; it updates indicators and other EAs on backtests and online;
  • OutputSymbolName - name of the custom symbol for renko, by default - empty string - then the name is formed as "Symbol_T_PrefixSizeSuffix", where Symbol - current work symbol, Prefix - "r" (renko) wicks are enabled or "b" (brick) if disabled, Size - RenkoBoxSize; optional Suffix - "c" for close time mode; "g" - for gapless renko type;
  • Reset - an option to enforce complete recalculation of entire renko chart, by default - false; after it is set to true and calculations are completed, it is recommended to reset it back to false in order to eliminate excessive recalculations on every terminal restart; this mode is helpful in rare cases, when generated renko chart contains an error for some reason; normally the option is disabled, because the EA continues calculation smartly from the most recent existing box;
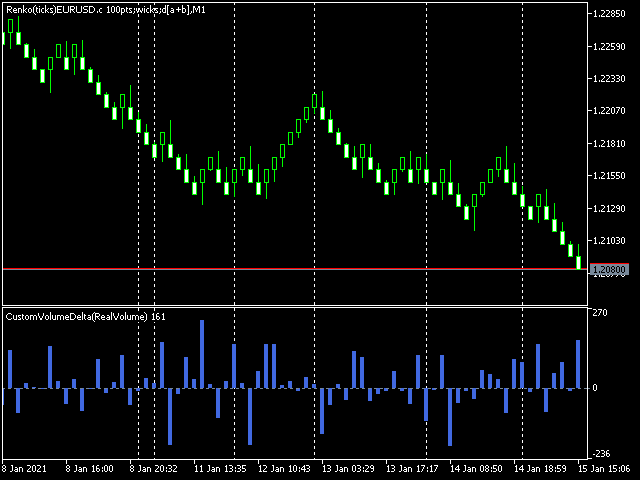
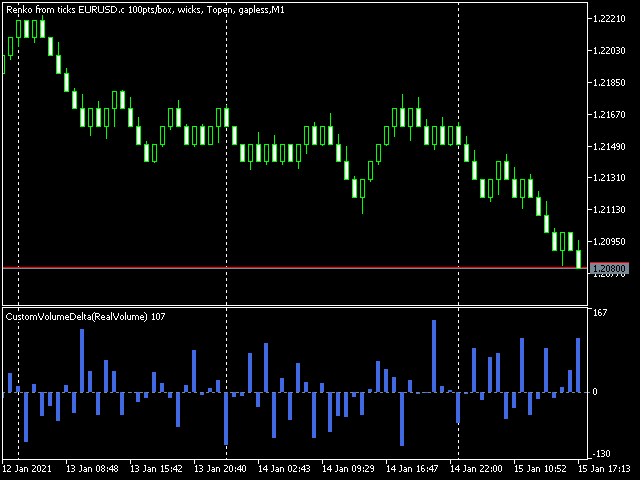
  • RenkoType - selector of the box calculation algorithm: Conventional or Gapless (also known as non-gap, rail-to-rail, see examples in the pictures);
  • VolumeType - selector of the volumes per box calculations: Total Volume, or Delta Volume with either of 3 algorithms (Ask vs Bid, Ask + Bid, Tick Flags);
  • CloseTimeMode - when true, boxes are shown and formed at their close time; in this mode only 1 tick is generated per box, when box is added completely formed to a chart; by default - false, i.e. boxes are created at open time (the latest live "box" is updated continuously and is not actually a box until it's closed);
  • DropTicksOutsideBars - filter out incorrect ticks (outliers);
  • StartFrom - time where to start the tick history processing, 0 means very beginning;
  • StopAt - time where to stop, 0 means till current time;


Volume Delta Methods

In the method Ask vs Bid tick volumes are considered for buy if Ask price increases, and for sell if Bid decreases (please note, that on some accounts/symbols Bid changes more frequent than Ask, which introduces a negative bias; this is the platform specificity).

The method Ask+Bid analyses the changes of the average price (sum of Ask and Bid): move up - buy, move down - sell.

Tick Flags is based on buy/sell tick flags and applicable for exchanges only.


评分 3
Mohamed Tharwat Hussein El Sherief
377
Mohamed Tharwat Hussein El Sherief 2024.02.27 06:50 
 

Hello,

I have traded Renko for many years manually without using EAs. Like many other traders, I faced the challenge when attempting to Backtest and/or optimize trading EAs based on custom symbols (Renko charts) in MT5. I have tested different Renko Generators EAs. I have generally struggled with these main points:

A-Backtesting results vary a lot.

B-The coders who created these EAs are not responsive and if they do respond, their replies are very short and do not address my concerns.

C- When applying Renko Generators on custom symbols, some Renko generators do not work or the backtesting results do not show 100 percent history quality.

For example: using third-party Tick Data providers to create a custom symbol for any pair and then creating a Renko custom symbol based on this imported tick data. Not all MT5 brokers offer tick data for previous years and thus we need to rely on imported tick data.

The result is that either the Renko Generator does not create a Renko custom symbol (because the source chart is a custom tick data chart) or it creates a custom symbol but the backtesting shows zero percent history quality. Regardless of how accurate and precise the Renko Generator is, there will always be limitations with MT5. It is inevitable as MT5 does not offer a custom-tailored solution for Renko bars. Any EA generator is simply trying to apply the concept of Renko on a time-based chart.

In a time chart, all data series (o/h/l/c) have to be manipulated by any Renko Generator. There are limits and issues. Stanislav (the creator of RenkoFromRealTicks) is very transparent about it in one of his articles. Read them to understand. This shortfall will apply to any Renko Generator you use (from Stanislav or others).

All right! So now starts my review of Stanislav Korotky Renko Generator (RenkoFromRealticks) EA.

1- Communication and support:

I give 5 stars out of 5 for the communication with Stanislav. I purchased his EA when it was version 1. There were so many backtracks done from my end and I had many questions to send to Stanislav. To be honest and straightforward, I am a very skeptical person by nature and I compare different products and always question the result.

It has been a couple of weeks and Stanislav was always responsive and updated his EA with a newer version to address a concern I have. He has also backtested two of my EAs and changed the code in one of them to make sure (from his view) that the backtesting is accurate. I have also sent him a third EA and some tick data and asked him to backtest it without changing the code and his results closely matched with mine.

I have never had such a communication channel with any other Renko Coder! Thank you, Stanislav for your support. I have also sensed you are a sincere coder who takes responsibility for his work and is very open with limitations (from MT5) without hiding or polishing them.

2-Applying RenkoFromRealTicks on Custom symbols: No issues at all. Let’s say you have a custom EURUSD chart built from tick data provided by a third party. You can apply RenkoFromRealTicks on it and it will generate the Renko bars. Some other Renko Generators do not! This is because they rely on one-minute data and the authors won't inform you.

3-Backtesting: Some Renko Generators have a special mode for backtesting. In other words, the user has to change the Renko size for reversal bars. (for example, Reno Reversal should be 200 percent of Renko bar). This is not wrong as this depends on the Author’s recommendations when backtesting. However, in the case of RenkoFromRealTicks, you do not need such a feature and you should not worry about (the artificial opening of a bar) affecting the backtest.

I have exhausted this concern with Stanislav! Besides, it is a lot nicer to see the authentic look of Renko Bars in the bactested chart. Also bear in mind, that some Renko Generators do not address this issue at all! Coders decline to inform their users if backtesting is synthetic and not real. So again: it depends on how the Renko generator is coded and what are the recommendations (if any) for Backtesting.

The recommendation from Stanislav is to choose (Bulk Ticks per box) in the Tick History Mode for the most accurate backtesting. Stanislav may need to update the description of the EA for Backtesting.

Some Renko Generators do not deal well with (compressed tick data)! Read this carefully! Some tick data providers offer a compressed version of their tick data to reduce the file size of tick data. That is great; sometimes you would get 99 percent quality instead of 100 percent.

A one percent difference is not that much when it comes to reducing file sizes on your PC. However, here is the issue: Some Renko generators do not handle well such compressed Data. They construct the bars in the wrong way affect your trading EA Backtesting and give you an unrealistic high profit factor.

But when it comes to RenkoFromReal Ticks, there was no issue at all. This Renko generator deals very well with either compressed or standard-sized data. There was no real concerning discrepancy when I backtested my trading EAs. The important thing is that you have a detailed log report to investigate the construction of Renko bars and the tick data you are using. I have also once downloaded the wrong format of ticks from one of the tick data providers. I downloaded a .csv file that was not meant for MT5. RealDataFrom Ticks EA generated a blank custom symbol and upon going through the log report, I noticed many ticks are being missed or are bad. I then downloaded the right format for MT5, and the EA worked like a charm.

However, when I used another Renko generator, the bars were still created and the trading EA got me an unrealistic high-profit factor. I realized then that RenkoFromRealTicks is a trustworthy Renko generator I should use.

C-History Quality: With RenkoFromRealTicks, I got 99 percent quality with the compressed data and 100 percent quality with standard-size data. When it comes to standard size tick data, I tested another commercial Renko generator and it was close to RenkoFromRealTicks EA but it shows history quality at Zero percent! This does not give me assurance the backtesting is good (even if the results are very close).

D-Online Trading: I have not tested it on online mode but I do not see any reason why it would not perform as expected. Usually, the issue of any Renko EA generator is in backtesting not in online mode.

E-takes a bit of time when constructing the renko bars: I believe this is because it is a genuine Renko generator that does build Renko from real ticks. I have similar MT4 Renko generators that take some time to construct Renko HST and FXT files from tick data. Besides, I was skeptical of other MT5 Renko generators that generate Renko bars on the fly! Or in a few seconds.

I hope I have given a comprehensive review of the product based on experience and knowledge.

Finally, I want to add that I did not have a reference point to compare the backtesting results I got from my trading EAs tested on Renko bars generated by RenkoFromRealTicks EA. I used a couple of EAs in MT4 and MT5 and was looking for an outlier here or there. The best way to make sure that any Renko Generator EA is offering the best backtesting results is to run an EA on a server for a month or so and compare the life trading results with the backtested ones. I have not done this yet.

My Recommendations for future development: (This depends on the users’ opinion and voting for such features)

1-I wish I see another EA from Stanislav (a different product with a different purchase) that offers Flexible Renko Construction. (i.e. changing the open and close offset by percentage). This way it will be a universal Renko builder to create Mean Renko or other exotic Renko bars.

The current EA offers Conventional and rail-to-rail (Point O Chart) Renko bars. The author would be able to code a new Renko generator if there is enough demand for it.

2-Option to build a Renko chart based on a percentage of the price. This will be great for stock trading. I am not fond of Renko based on ATR and I think the percentages will be a better option.

Thank you,

carlospelegrini
87
carlospelegrini 2022.09.29 17:45 
 

the only non-gap renko I found.. it works okay

推荐产品
This MT5 indicator provides real-time updates of classic Renko charts. Renko charts focus on price movement, filtering out noise and highlighting trends. What are Renko candles? Renko charts display price movement using "bricks" of equal size, ignoring time. A new brick is drawn only when the price moves by a specified amount. They help visualize trends by removing time-based noise. Parameters - BrickSizePoints  (20): Renko brick size in points - HistoryDepthSec  (3600): Historical data to ini
FREE
Gino Renko
Stephane, Andr Valette
1 (1)
Another renko-based indicator. It returns different usable values ​​for an EA, and is directly displayed on the main chart. Its setting is very simple: The size of the renko The number of bars taken into account The falling color The color on the rise Returned values: Buffer 0 : Value of the middle Buffer 1 : Value of the Top Buffer 2 : Value of the Bottom Buffer 3 : Direction of renko (0.0 for top ; 1.0 for bottom) Buffer 4 : Ratio of the renko, for example, if it is twice, 3 times, ro more of
MetaTrader 5 (MT5) 世界交易时钟 世界交易时钟是一款专为 MetaTrader 5 设计的专业市场交易时钟,可实时可视化显示全球交易时段。 它帮助交易者快速识别市场开盘、收盘和交易时段重叠,无需手动计算时间或调整时区。 该产品将 24 小时模拟时钟、数字时间显示、交易时段弧线和可选的图表交易时段区域整合到一个简洁轻便的界面中,专为日常交易而设计。 主要功能 实时世界市场交易时钟 支持惠灵顿、悉尼、东京、伦敦和纽约交易时段 自动处理 GMT/UTC 时间 完全支持夏令时 交易时段弧线以及可选的图表区域(矩形或垂直线) 未来交易时段可视化(提前绘制) 时钟和数字显示的可拖动锚点 简洁的基于对象的绘图(无指标,无缓冲区) 可安全地与任何 EA 或指标一起使用 自动化与准确性 时钟和交易时段弧线自动与本地时间同步 图表交易时段区域自动与经纪商服务器时间同步 正确处理跨午夜的交易时段 无需手动偏移或重新校准 图表位置 世界交易时钟目前已针对主图表窗口的使用进行了优化,交易时段区域直接与价格走势对齐。 未来版本计划添加专用的子窗口仪表盘模式(
Renko Builder GLX1
Eranga Thilina Dhanushka Gallage
GLX1 Renko Builder   Expert Advisor (EA) can create the Renko bar charts on any symbol. The Renko charts are generated as real-time custom symbol charts which can be further used for technical analysis with any MT5 compatible indicator.  Find the free   GLX1 Renko Euro   Expert Advisor from here.  https://www.mql5.com/en/market/product/115074 Included Features: Truly responsive Renko Charting on a custom symbol chart Accurate automatic live chart update Ability to attach any MT5 indicator Abi
Indicador "MR BEAST - Detectador de Mejores Spikes" para el Índice BOOM1000 (M1) El indicador "MR BEAST - Detectador de Mejores Spikes" es una herramienta especializada y altamente precisa diseñada exclusivamente para operar en el índice CRASH 1000, con un enfoque específico en el marco temporal de 1 minuto (M1). Desarrollado por el reconocido trader Mr. Beast, este indicador ha sido meticulosamente diseñado para identificar únicamente los mejores spikes, permitiendo a los operadores capitalizar
KT Renko Live Charts MT5
KEENBASE SOFTWARE SOLUTIONS
KT Renko Live Chart 工具可在 MT5 平台中生成 Renko 图表,这些图表可用于技术分析、实盘交易或策略研究。该工具所创建的 Renko 图支持大多数自定义指标和自动化交易专家顾问(EA)。 完全兼容我们的 Renko Patterns 指标和 Renko Patterns EA。 功能特点 一款简单明了的 Renko 图表工具,在 MT5 上创建 Renko 图表,无需复杂设置。 支持大多数自定义指标和 EA,可实现 100% 自动化交易。 可在策略测试器中对 Renko 图进行回测,提升策略开发效率。  可启用或关闭 Renko 的影线显示功能。 输入参数 Renko 砖块大小(点): 输入用于生成 Renko 图的砖块/箱体大小(单位为点)。 显示影线: 启用或关闭 Renko 图的影线显示。 故障排查 问:  Renko 图没有接收到新的行情数据。 答:  请关闭主图和离线图,重新启动 MetaTrader,再次生成图表。 问:  生成的图表显示不完整或变形。 答:  请确保主图表中有足够的历史数据,数据量应与设定的砖块大小匹配。 问: 为什么
DAILY OH/OL SDEV QUANT MODEL - STATISTICAL TRADING WITH PRECISION RISK MANAGEMENT TRADE WITH MATHEMATICAL CERTAINTY - KNOW YOUR EXACT STOP-LOSS AND TAKE-PROFIT BEFORE YOU ENTER This indicator analyzes 5,000+ days of price history to give you: Exact entry levels (sigma bands locked at daily open) Exact stop-loss distance (from M
Advanced CRT Indicator MT5 — Candle Range Theory Tool Advanced CRT Indicator MT5 is a professional analysis tool that automates Candle Range Theory. It identifies consolidation ranges, breakout levels, Fair Value Gaps (FVG), and profit targets, with a real-time dashboard and alerts. Overview - Multi-timeframe candle range detection   - Automatic breakout levels with buffer settings   - Fair Value Gap identification and tracking   - Up to three customizable target levels (Risk:Reward ratios)  
Renko Chart
Marcin Konieczny
3.56 (9)
This indicator allows to display Renko charts in the indicator window. Renko charts show only price movements that are bigger than the specified box size. It helps to eliminate noise and allows to focus on main trends. Time is not a factor here. Only price movements are taken into account. That's why Renko chart is not synchronized with the main chart it is attached to. Indicator works in two modes: CLOSE - only close prices are taken into account while building the chart HIGH_LOW - only high/l
FREE
The ATR Indicator Based on Heiken Ashi is a unique volatility analysis tool that combines the Average True Range (ATR) with Heiken Ashi candlestick calculations to provide a smoother and more reliable measure of market volatility. Unlike the traditional ATR, which uses standard candlesticks, this indicator applies the Heiken Ashi formula to filter out market noise and deliver a clearer volatility signal. Key Features: • ATR Calculation Based on Heiken Ashi Candlesticks – Offers a more stable v
FREE
Renko Plus
Eadvisors Software Inc.
With Renko Plus you can use the features in the Indicator functionality, just add it to the Metatrader5 chart.             The Renko chart is a type of chart, developed by the Japanese, that is constructed using price movement rather than standardized prices and time intervals like most charts. It is believed to be named after the Japanese word for bricks, "renga", as the graphic looks like a series of bricks.             A new brick is created when the price moves a specified pri
The Expert Advisor is used to create Renko chart, realtime updates, easy for technical analysis. Backtest your strategy with all indicators with Renko chart in MetaTrader 5. Parameters Box Size : input the number of box size. Show Wicks : if true , draw a candle with high/low. History Start: input the date to creat first candle. Maximum Bars: limit number of bars on renko chart How to use Attach the Expert Advisor to a chart (timeframe M1), for which you want to create a renko. Input box size a
This SMT (Smart Money Technique) divergence indicator identifies discrepancies in price movement between two different trading symbols, helping traders detect potential market reversals. This tool compares the price action of two correlated assets, such as two currency pairs or indices, to spot divergences where one asset's price moves in the opposite direction of the other. For example, while one symbol may be making higher highs, the other might be making lower highs, signaling a divergence. T
FREE
Hull Heikin Ashi Smoothed
Flavio Javier Jarabeck
Heikin Ashi candlesticks are a powerful tool for traders, offering a clear and smooth visualization of market trends. Unlike traditional candlesticks, they filter out market noise, providing a cleaner view of the market's direction and strength, which helps traders make more informed decisions. The Hull Heikin Ashi Smoothed indicator from Minions Labs takes this a step further by integrating the Hull Moving Average for enhanced smoothing and precision. This indicator not only simplifies trend id
Advanced 4xZeovo MT5 Indicator (MetaTrader 5)   Product Description  4xZeovo is a powerful trading indicator system monitoring 24/7 financial markets. Metatrader5 tool designed to find the best buying/selling opportunities and notifies the user.    Making life easy for traders in helping with the two most difficult decisions with the use of advanced innovate trading indicators aiming to encourage users to hold the winning positions and take profit at the best times.    Equipped with a unique tra
Indicador "MR BEAST - Detectador de Mejores Spikes" para el Índice CRASH 300(M1) El indicador "MR BEAST - Detectador de Mejores Spikes" es una herramienta especializada y altamente precisa diseñada exclusivamente para operar en el índice CRASH 1000, con un enfoque específico en el marco temporal de 1 minuto (M1). Desarrollado por el reconocido trader Mr. Beast, este indicador ha sido meticulosamente diseñado para identificar únicamente los mejores spikes, permitiendo a los operadores capitalizar
Indicador "MR BEAST - Detectador de Mejores Spikes" para el Índice CRASH 500(M1) El indicador "MR BEAST - Detectador de Mejores Spikes" es una herramienta especializada y altamente precisa diseñada exclusivamente para operar en el índice CRASH 1000, con un enfoque específico en el marco temporal de 1 minuto (M1). Desarrollado por el reconocido trader Mr. Beast, este indicador ha sido meticulosamente diseñado para identificar únicamente los mejores spikes, permitiendo a los operadores capitalizar
Trend Direction ADX indicator for MT5
Renaud Herve Francois Candel
Trend Direction ADX indicator Trend Direction ADX is part of a serie of indicators used to characterize market conditions. Almost any strategy only work under certain market conditions. Therefore it is important to be able to characterize market conditions at any time: trend direction, trend strength, volatility, etc.. Trend Direction ADX is an indicator to be used to characterize trend direction: trending up trending down ranging Trend Direction ADX is based on ADX standard indicator. Tre
Gino Renko EA
Stephane, Andr Valette
Here is an EA based on the Renko indicator, it can be used with currencies, commodities, and forex. Just associate it with the corresponding graph. The indicator used for the EA is available here, but it is not necessary for its operation, they are 2 independent products: https://www.mql5.com/fr/market/product/87852?source=Site +Market+MT5+Indicator+Search+Rating006%3agino+renko Personally I don't like renko like EA, and I haven't done any tests to find out which configuration is the best. Th
Auto Channel Trader
Ross Adam Langlands Nelson
The Auto Channel Trader creates a channel by plotting a line along the high points and low points of the chart, the EA then makes long trades near the bottom of the channel and short trades near the top of the channel. The channel is created by finding high points for the top line and low points for the bottom line, these points are shown with arrows. A line of best fit is then plotted through these points and extended until the end of the chart.  The length of the channel is determined by the M
Trend Bands 5
Leonid Basis
Bands are a form of technical analysis that traders use to plot trend lines that are two standard deviations away from the simple moving average price of a security. The goal is to help a trader know when to enter or exit a position by identifying when an asset has been overbought or oversold. This indicator will show upper and lover bands. You can change input parameters nPeriod and  nMethod to calculate those bands for each timeframe. Aqua clouds represent up or down trends.
Dobiforex AI服务是一个为外汇交易者提供智能交易支持的专业平台。该助手利用先进的实时市场分析,帮助交易者在其交易策略中做出更明智的决策。用户通过注册Dobiforex网站并访问其专用面板,可以将此智能服务集成到其交易平台中。Dobiforex使用高级算法和机器学习,实时处理市场数据,提供准确可靠的交易信号。这个强大的工具使交易者能够聪明地利用市场波动,同时优化他们的交易风险。 由AWS Amazon提供支持 该交易助手利用Amazon AWS云服务的高级计算基础设施,实时处理和分析交易数据。通过AWS,工具能够以高精度和速度处理大规模的金融市场数据。此交易助手的一个突出特点是其使用的实时机器学习技术。该技术使系统能够快速识别数据中的隐藏模式,并通过复杂的算法提供极为准确的市场走势预测。随着每次新分析和数据输入,机器学习模型不断改进,优化交易信号的性能。这让交易者能够做出更智能的实时决策,并改善他们的交易策略以获得更好的结果。 什么是AI服务? 来自Dobiforex的交易助手是一种在MetaTrader 5 (MT5)平台上运行的智能顾问(EA),用户可以在其个人系统上使用。
O Alpha B3 Renko Trader  é um robô especialista para negociação no Bovespa B3  (miniíndice e minidólar) que une a análise de candlesticks do gráfico Renko (calculado internamente, sem imagens gráficas) com a estratégia Alpha B3 . O robô permite configurar, para os sinais de entrada, o tamanho do brick do gráfico Renko, bem como um número de candlesticks para análise. Além disso, você deve configurar os stops fixos, em pontos. O robô permite também a configuração de funções, tais como número de c
HLC bar MT5 Wyckoff
Eduardo Da Costa Custodio Santos
創建 MT5 的指標“HLC_bar_MT5 Wyckoff”是為了方便交易時的分析。 HLC Bar 由 Richard Wyckoff 使用,目前廣泛用於“VSA”操作。 Wyckoff 發現使用 High、Low 和 Close 使圖表更清晰、更易於分析。 指標“HLC_bar_MT5 Wyckoff”允許: # 改變條寬; # 保持條形相同的顏色; # 並突出顯示以相同價格開盤和收盤的柱。 顏色和寬度很容易在設置中修改 要使用該指標,只需將其拖到圖表上即可。 當與成交量一起使用時,威科夫將 HLC 圖表稱為條形圖。 他們試圖隱藏這些信息多年,但現在每個人都可以訪問這些信息,並可以使用此類圖表改進他們的操作。 HLC bar MT5 Wyckoff Chart 可用於任何市場和任何圖表時間,使操作員更加舒適。
Cumulative Volume Delta CVD
Jerome Stephane Eric Brivet
JB Cumulative Volume Delta -- 看清谁在买入、谁在卖出 价格告诉你发生了什么。成交量告诉你是谁在操作。但标准成交量指标(OBV、Volume Profile)对所有成交量一视同仁 -- 它们无法区分买入压力和卖出压力。 CVD(Cumulative Volume Delta)通过实体/影线分析,将每根K线的成交量分解为买入量和卖出量,从而解决了这个问题。大实体的阳线 = 主要是买入量。长影线的阴线 = 混合,但卖出占主导。 这创建了一幅买卖双方实时博弈的画面,而仅凭价格无法展示这一点。 图表上显示的内容: 买卖云带 -- 两条EMA(买入压力和卖出压力)以彩色填充绘制。绿色云带 = 买方主导。红色云带 = 卖方主导。云带宽度显示一方的主导程度。 Delta柱状图 -- 每根K线的原始买入量减去卖出量。绿色柱 = 净买入。红色柱 = 净卖出。即时查看当前K线是由买方还是卖方驱动。 力量波 -- 最大压力(买入或卖出)的EMA。显示市场整体能量。当力量高时,走势是真实的。当力量下降时,市场正在失去信心。 HTF力量 -- 在更高时间周期上的相同
Renko Charts Pro
Makarii Gubaydullin
过滤掉小的价格波动,专注于更大的趋势 . Renko 图表指标将帮助您过滤掉小的价格波动,以便您可以专注于整体趋势。 价格必须移动指定的数量才能创建一个 Renko 砖块。 这使得识别价格当前移动的方向变得容易。 多功能实用工具 : 包含 66+ 功能  |   联系我  如果您有任何问题  |    MT4 版本 在指标的设置中,您可以配置: 计算设置: 计算 块 大小的 方法 : 点差   / 点; 块大小; 将 用于 计算的 时间框架 ; 指标样式: 块颜色; 程序文件应放置在 " Indicators " 目录中。 //--------------------------- 多功能实用工具 : 包含 66+ 功能  |   联系我  如果您有任何问题  |    MT4 版本 //-----------------------
All about time and price by ICT. This indicator provides a comprehensive view of ICT killzones, Silver Bullet times, and ICT Macros, enhancing your trading experience.  In those time windows price either seeks liquidity or imbalances and you often find the most energetic price moves and turning points. Features: Automatic Adaptation: The ICT killzones intelligently adapt to the specific chart you are using. For Forex charts, it follows the ICT Forex times: In EST timezone: Session: Asia: 20h00-0
Renko + ATR Trend Envelope PRO+ (Non-Repainting) Renko + ATR Trend Envelope PRO+ is a clean trend-filter indicator that combines a Renko-style step histogram with an ATR-based trend envelope. It highlights trend direction, volatility expansion/contraction and trend reversals with arrows and optional alerts. This tool is ideal for: Trend following strategies Breakout confirmation Filtering false entries during choppy markets Visualizing volatility using ATR envelopes Key Features Renko-Style Hi
RENKO PRICE ACTION ATR 是通过构建 Renko 图表开发的“智能交易系统”,其中每个 BRICK 的大小都通过用户选择的时间段的 ATR 计算得出。 Renko 图表旨在滤除微小的价格变动,从而使交易者更容易关注重要趋势。 由于其检测价格趋势的效率,还可以清楚地识别支撑和阻力以及顶部和底部背离,从而更好地利用交易机会。 手术 RENKO PRICE ACTION ATR 适用于任何货币对。 RENKO PRICE ACTION ATR 具有出色的实时更新性能。 设置 ATR Calculation Timeframe:用户选择的 RENKO PRICE ACTION ATR 周期,以应用 ATR 的平均值并计算/重新计算每个 BRICK 的大小。 ATR 计算平均周期:用户选择的 ATR 平均周期为 RENKO PRICE ACTION ATR 执行每个 BRICK 的大小计算。 ATR 大小的百分比:用于形成每个 BRICK 的计算大小的百分比。 如果您还有问题,请通过直接消息与我联系:  https://www.mql5.com/zh/users/ro
可训练的人工智能和神经网络。 SolarTrade Suite 金融指标 - Theia 市场指标! 这款指标采用特殊的创新和先进算法来计算其数值, 是您金融市场的得力助手。 SolarTrade Suite - Theia 市场指标可以提前几步预测金融工具的价格, 并在终端窗口中以注释的形式显示其读数。 请在产品描述底部查看我们 SolarTrade Suite 系列的其他产品。 您想自信地畅游投资和金融市场吗? SolarTrade Suite - Theia 市场指标是一款创新的软件,旨在帮助您做出明智的投资决策并提升您的利润。 SolarTrade Suite - Theia 市场指标金融指标的优势: - 精准计算:我们的指标采用先进的算法和分析方法,能够准确预测市场走势。 在这种情况下,它就是高效的人工智能。 - 用户友好的界面:直观的界面让您轻松掌握程序,并在安装后立即享受其优势。 - 专家支持:我们的专业团队随时准备解答您的任何问题,并提供程序使用建议。 立即试用 SolarTrade Suite 金融指标 - Theia 市场指标,让您的投资决策充满
该产品的买家也购买
Trade Assistant MT5
Evgeniy Kravchenko
4.42 (208)
它有助于计算每笔交易的风险,容易安装新的订单,具有部分关闭功能的订单管理, 7 种类型的追踪止损和其他有用的功能。   附加材料和说明 安装说明   -   应用程序说明   -   模拟账户应用程序的试用版 线条功能  - 在图表上显示开仓线、止损线、止盈线。 有了这个功能,就可以很容易地设置一个新的订单,并在开仓前看到它的附加特性。   风险管理  - 风险计算功能在考虑到设定的风险和止损单的大小的情况下,计算新订单的成交量。它允许你设置任何大小的止损,同时观察设定的风险。 批量计算按钮 - 启用 / 禁用风险计算。 在 " 风险 " 一栏中设置必要的风险值,从 0 到 100 的百分比或存款的货币。 在 " 设置 " 选项卡上选择风险计算的变量: $ 货币, % 余额, % 资产, % 自由保证金, % 自定义, %AB 前一天, %AB 前一周, %AB 前一个月。   R/TP 和 R/SL - 设置止盈和止损的关系。 这允许你设置相对于损失的利润大小。 例如, 1 : 1 - 这决定了 TP = SL 的大小。 2 : 1 - 这意味着 TP 是 SL 的两倍。 RR -
欢迎来到 Trade Manager EA——这是一个终极风险管理工具,旨在使交易变得更直观、精准和高效。它不仅仅是一个下单工具,而是一个用于无缝交易计划、仓位管理和风险控制的全面解决方案。不论您是新手交易员、资深交易员,还是需要快速执行的剥头皮交易员,Trade Manager EA 都可以满足您的需求,适用于外汇、指数、大宗商品、加密货币等各种市场。 借助 Trade Manager EA,复杂的计算已成过去。只需分析市场,在图表上用水平线标记入场、止损和止盈,设置您的风险水平,Trade Manager 就会立即计算出理想的头寸规模,并实时显示以点、账户货币计价的止损和止盈。每笔交易都得以轻松管理。 主要功能: 头寸规模计算器 :根据定义的风险瞬间确定交易规模。 简单的交易计划 :在图表上用可拖动的水平线直接计划交易,设置入场、止损和止盈。 实时显示 SL 和 TP :以账户货币、点或分显示止损和止盈,便于分析。 高级保护工具 盈亏平衡选项 : 基本盈亏平衡 :当您的交易达到设定水平时自动保护利润。 多级盈亏平衡 :设置多达 4 个级别以逐步保护利润。 尾随止损选项 : 基本尾随
Local Trade Copier EA MT5
Juvenille Emperor Limited
4.96 (135)
通过 Local Trade Copier EA MT5 获得非常快速的交易复制体验。它的简单1分钟设置,使您可以在同一台Windows计算机或Windows VPS上在多个MetaTrader终端之间复制交易,具有闪电般快速的复制速度,低于0.5秒。 无论您是初学者还是专业交易者, Local Trade Copier EA MT5 都提供了广泛的选项,可根据您的特定需求进行自定义。对于任何希望增加利润潜力的人来说,这都是终极解决方案。 今天就尝试一下,看看为什么它是市场上最快、最简单的贸易复印机! 提示: 您可以在您的模拟账户中下载并试用 Local Trade Copier EA MT5 模拟版: 这里 将下载的免费演示文件粘贴到您的 MT5 >> 文件 >> 打开数据文件夹 >> MQL5 >> 专家文件夹并重新启动您的终端。  免费演示版本每次可在 4 小时内发挥全部功能,仅限演示帐户。 要重置试用期,请转至 MT5 >> 工具 >> 全局变量 >> Control + A >> 删除。 请仅在非关键模拟账户上执行此操作,不要在挑战道具公司账户中执行此操作。 如果您无法
TradePanel MT5
Alfiya Fazylova
4.87 (151)
交易面板是一款多功能交易助手。该应用包含超过50种手动交易功能,并允许您自动执行大多数交易任务。 注意!折扣时间有限,每周二价格将上涨5美元。(直到100美元)。 在购买之前,您可以在演示账户上测试演示版本。下载用于演示账户的试用版应用程序: https://www.mql5.com/zh/blogs/post/762579 。 完整说明 这里 。 贸易. 只需单击一下即可执行交易操作: 打開掛單和頭寸,並自動計算風險。 一鍵打開多個訂單和頭寸。 打開訂單網格。 按組別關閉掛單和頭寸。 反轉頭寸方向(關閉買入>打開賣出,關閉賣出>打開買入)。 鎖定頭寸(通過開啟缺少的頭寸,使買入和賣出頭寸的數量相等)。 一鍵部分關閉所有頭寸。 將所有頭寸的止盈和止損設置在同一價格水平。 將所有頭寸的止損設置在盈虧平衡水平。 開倉時,可使用以下功能: 在多個訂單或倉位之間分配計算出的數量(在單擊一次時開啟多個訂單和倉位)。 在開啟訂單前在圖表上可視化交易水平。 僅在當前點差不超過設定值時才開啟倉位。 止盈和止損之間的自動比例。 虛擬止損和止盈。 自動將止損和止盈的大小增加為當前點差的大小。 基於ATR指
Farmed Hedge Yield Farming | All Markets (Manual - Hybrid - Semi/Automated EA) MULTI-ASSET SUPPORT Trade any asset available on your broker - Forex: Major, Minor, Exotic pairs - Crypto: BTC, ETH, XRP, SOL, BNB - Stocks: Apple, Tesla, Amazon, Google, etc. - Commodities: Gold, Silver, Oil, Gas - Indices: US30, NAS100, SPX500, DAX40 - Any CFD your broker offers VERIFIED TRADING RESULTS - Farmed Hedge Yield Axi Copy:  https://www.mql5.com/en/signals/2356376 - Farmed Hedge Yield Exn Copy:   https:/
测试版发布 Telegram to MT5 Signal Trader 即将进入正式的 Alpha 版本。一些功能仍在开发中,您可能会遇到一些小错误。如果您遇到问题,请反馈,您的意见将帮助我们改进软件。 Telegram to MT5 Signal Trader 是一款强大的工具,能够将 Telegram 频道或群组的交易信号自动复制到您的 MetaTrader 5 账户。 支持公开和私人频道,可将多个信号提供者连接至一个或多个 MT5 账户。软件优化、高效、稳定,精准控制每笔复制交易。 界面简洁,仪表盘美观,图表交互性佳,导航直观。您可以管理多个信号账户,自定义每个提供者的设置,并实时监控所有操作。 系统需求 由于 MQL 限制,EA 需要配合 PC 端应用与 Telegram 通信。 安装程序可通过官方 安装指南 获取。 核心功能 多提供者支持: 从多渠道复制信号至多个 MT5 帐户 高级信号识别: 关键词、模式和标签全面自定义 逐提供者控制: 可启用/禁用特定信号类型、平仓策略等 灵活风险管理: 固定手数、固定金额、余额/权益百分比、部分平仓设置 可定制 SL/TP: 覆盖信号
HINN Lazy Trader
ALGOFLOW OÜ
5 (2)
Limited time offer: 20% off for a few days only!  - Annual subscription $360 instead of $450  - Lifetime plan $550 instead of $690 The core idea: using the user interface, you configure the parameters the chart must meet before entering a position (or positions), choose which entry models to use, and set the rules for when trading and planning should end. Lazy Trader  handles the rest: it  takes over all the routine chart watching and execution! full description  :: 3 key videos [1] ->  [2]   -
Exp COPYLOT CLIENT for MT5
Vladislav Andruschenko
3.82 (34)
适用于 MetaTrader 5 的专业交易复制器 快速、专业、稳定可靠的 交易复制器 ,适用于 MetaTrader 。 COPYLOT 可在 MT4 和 MT5 终端之间复制 Forex 交易,并支持 Hedge 和 Netting 账户。 COPYLOT 的 MT5 版本支持: - MT5 Hedge → MT5 Hedge - MT5 Hedge → MT5 Netting - MT5 Netting → MT5 Hedge - MT5 Netting → MT5 Netting - MT4 → MT5 Hedge - MT4 → MT5 Netting MT4 版本 完整说明 + DEMO + PDF 如何购买 如何安装 如何获取日志文件 如何测试和优化 Expforex 的所有产品 您也可以将交易复制到 MT4 终端(MT4 → MT4,MT5 → MT4): COPYLOT CLIENT for MT4 COPYLOT 是一款专业的交易和持仓复制器,可同时与 2、3 甚至 10 个终端协同工作。 支持从 模拟账户和投资者账户 复制,也支持同时在多个终端上运行。 您可以使
Footprint Chart Pro — Professional OrderFlow EA for MetaTrader 5 Version 6.34 | Professional tool for real traders | Institutional-Grade Visualization DEMO USERS - PLEASE SELECT EVERY TICK / REAL TICK WHEN TESTING AND YOU HAVE DOWNLOADED HISTORICAL DATA. IF YOU SEE A WAITING SCREEN AND IT IS NOT DOWNLOADING, IT MEANS YOU HAVE LOW HISTORICAL DATA. TRY 1 MIN AND 5 MIN FIRST ON 1 DAY DATA. ONE DAY DATA SHOULD BE THE NEWEST AND MOST CURRENT DATE. PLEASE WAIT UNTIL THE MARKET HAS ROLLED OVER PERIOD.
Trade Dashboard MT5
Fatemeh Ameri
4.94 (121)
疲于复杂的订单下达和手动计算?Trade Dashboard 是您的解决方案。凭借其用户友好的界面,订单下达变得轻而易举,只需点击一下,您就可以开设交易、设置止损和止盈水平、管理交易手数,并计算风险回报比,让您只需专注于您的策略。告别手动计算,使用 Trade Dashboard 简化您的交易体验。 立即下载演示版本 。 您可以在这里找到仪表盘功能和特性的详细信息 。 加入 Telegram 频道 。 购买后请给我发消息以获取支持。如果您需要添加更多功能,可以在产品的评论区留下您的想法,我愿意听取任何建议,希望您能在使用我的产品时获得最佳体验 。 这是 MT4 版本。 风险管理:使用 Trade Dashboard,可以将您的风险设置为账户余额或权益的百分比,或将风险设置为总金额。在图表上直观地定义您的止损,让工具准确计算每个货币对的适当手数。该工具还可以根据您期望的风险回报比自动设置止盈水平。它甚至可以在手数计算中涵盖佣金和点差费用。此外,您的止损和止盈可以转变为虚拟水平,隐藏于经纪商。通过 Trade Dashboard 的高级风险管理功能,掌控风险,保护您的资本。 交易线
Copy Cat More Trade Copier MT5 (复制猫MT5) 是一个本地跟单软件,也是一个完整的风险管理和执行框架,专为当今的交易挑战而设计。从资金管理公司挑战到个人投资组合管理,它能适应各种情况,结合了稳健的执行、资本保护、灵活配置和高级交易处理功能。 该跟单软件可在主端(发送方)和从端(接收方)模式下工作,实时同步市价单和挂单、交易修改、部分平仓和对冲平仓操作。它兼容模拟和实盘账户、交易或投资者登录,并通过持久的交易记忆系统确保恢复功能,即使EA、终端或VPS重启也不例外。可以同时管理多个主端和从端,使用唯一ID,并通过前缀/后缀调整或自定义品种映射自动处理跨经纪商差异。 手册/设置  | Copy Cat More MT4 | 频道  特色功能: 易于设置——快至30秒(见视频)。 快速、稳定、准确——Turbo模式下低延迟复制(见截图)。 高安全性——不使用潜在危险的DLL或WebRequest。 持久交易记忆,避免孤立、丢失或不准确的交易。 可从手动或EA复制,支持所有账户类型。 品种自动前缀/后缀,快速设置;支持MT4和MT5之间复制。 非常灵活的多主端
MT5 to Telegram Signal Provider 是一个易于使用且完全可自定义的工具,它允许向 Telegram 的聊天室、频道或群组发送 指定 的信号,将您的账户变为一个 信号提供商 。 与大多数竞争产品不同,它不使用 DLL 导入。 [ 演示 ] [ 手册 ] [ MT4 版本 ] [ Discord 版本 ] [ Telegram 频道 ]  New: [ Telegram To MT5 ] 设置 提供了逐步的 用户指南 。 不需要了解 Telegram API;开发者提供了您所需的一切。 关键特性 能够自定义发送给订阅者的订单详情 您可以创建分层的订阅模型,例如铜、银、金。其中金订阅获得所有信号等。 通过 id、符号或评论过滤订单 包括执行订单的图表截图 在发送的截图上绘制已关闭的订单,以便额外核实 延迟发送新订单消息的可能性,以便在发送前对位置进行调整 订单详情完全透明: 新的市场订单*带截图 订单修改(止损、获利) 已关闭的订单*带截图 部分关闭的订单** 新的挂单 修改的挂单(进场价格) 挂单激活(作为新的市场订单附加) 已删除的挂单 历史订单报告
The product will copy all telegram signal to MT5 ( which you are member) , also it can work as remote copier.  Easy to set up, copy order instant, can work with almost signal formats, image signal,  s upport to translate other language to English Work with all type of channel or group, even channel have "Restrict Saving Content", work with  multi channel, multi MT5 Work as remote copier: with signal have ticket number, it will copy exactly via ticket number. Support to backtest signal. How to s
Helios Pulse
Jonathan Mboya Kinaro
Helios Pulse v1.03 — 实时概率交易面板,专为手动交易者打造 Helios Pulse 彻底改变您解读市场的方式。无需在多个指标窗口之间来回切换、纠结于相互矛盾的信号,您只需看一个清晰的答案:一个实时更新的概率百分比,展示当前市场的方向性偏移,逐笔跳动持续刷新。 这不是又一个信号箭头面板。Helios Pulse 是一个概率引擎,它衡量多个技术维度之间的一致程度,输出一个真正可信赖的确信度评分。您看到的不仅是方向,还有这个方向有多强——以及它正在实时增强还是减弱。 图表上的呈现 一个紧凑的深色主题面板嵌入您的图表,包含两张动态概率卡片——一张代表做多,一张代表做空。随着市场状况变化,卡片颜色强度从暗淡渐变为鲜明,让您在查看数字之前就能获得即时的视觉判断。清晰的判定标签显示当前状态:Strong Buy、Lean Long、Neutral、Lean Short 或 Strong Sell。 动量变化箭头显示概率正在上升还是下降,让您在确信度积聚或消散的瞬间捕捉到变化。峰值追踪功能记录当前交易时段两个方向的最高概率值。 当需要完整的图表视野时,将面板最小化为一条精简的状态
Anchor Trade Manager
Kalinskie Gilliam
5 (2)
Anchor: The EA Manager A coordination system for traders running multiple EAs. Anchor ensures only one EA can trade at a time, preventing conflicting positions and keeping your portfolio safer. Attach Anchor to any chart. Configure your EAs and their magic numbers. Anchor handles the rest. Built for portfolios. Built for discipline. Built for prop firms. The Problem Running multiple EAs on the same account creates risk. Two gold EAs can open opposite positions on the same candle. Three EA
HINN MagicEntry Extra
ALGOFLOW OÜ
4.71 (14)
HINN MAGIC ENTRY – the ultimate tool for entry and position management! Place orders by selecting a level directly on the chart! full description   ::  demo-version  :: 60-sec-video-description Key features: - Market, limit, and pending orders - Automatic lot size calculation - Automatic spread and commission accounting - Unlimited partitial take-profits  - Breakeven and trailing stop-loss and take-profit  functions - Invalidation leves - Intuitive, adaptive, and customizable interface - Works
Trader Evolution
Siarhei Vashchylka
5 (7)
" Trader Evolution " - A utility designed for traders who use wave and technical analysis in their work. One tab of the utility is capable of money management and opening orders, and the other can help in making Elliott wave and technical analysis. Manual (Be sure to read before purchasing) | Version for MT4 Advantages 1. Trading in a few clicks. Immediate and pending orders are available in the panel 2. Money management. The program automatically selects the appropriate lot size 3. Simplifies
Ultimate Extractor
Clifton Creath
5 (9)
Ultimate Extractor - Professional Trading Analytics for MT5 *****this is the local HTML version of Ultimate Extractor. !!!!!it is not compatible with Cloud!!!! For the online version please reach out to me directly****** Ultimate Extractor transforms your MetaTrader 5 trading history into actionable insights with comprehensive analytics, interactive charts, and real-time performance tracking. What It Does Automatically analyzes your MT5 trading history across all Expert Advisors and generates
Seconds Chart MT5
Boris Sedov
4.59 (17)
秒级图表 (Seconds Chart) - 一款专为 MetaTrader 5 设计的独特工具,用于创建秒级时间框架的图表。 通过 秒级图表 ,您可以构建以秒为单位的时间框架图表,获得标准分钟或小时图表无法提供的极致灵活性和分析精度。例如,时间框架 S15 表示每根蜡烛图持续15秒。您可以使用任何支持自定义交易品种的指标和EA交易系统。操作它们就像在标准图表上交易一样方便。 与标准工具不同, 秒级图表 让您能够在超短时间框架下进行高精度交易,无延迟干扰。 秒级图表的优势 支持 1至900秒 的时间框架图表。 基于内置的实时报价数据库, 即时加载 历史数据。 数据实时更新, 无延迟或滞后 。 可同时创建 多个秒级图表 。 秒级图表的理想应用场景 剥头皮交易 和高频交易。 精确的入场和出场时机。 在短时间框架下测试交易策略。 时间框架设置 默认设置包含以下时间框架: S1、S2、S3、S4、S5、S6、S10、S12、S15、S20、S30 。 您可轻松自定义时间框架组合,只需按升序列出 1至900秒 的数值且避免重复即可。 其他免费工具 快速交易管理器 ( Quick Trade Ma
实时扫描您的整个观察列表,发现极端K线。 Power Bar Scanner 同时监控您所有的交易品种,在出现极端价格K线的瞬间向您发出警报。无需再逐个翻看图表。在一个面板中查看所有机会。 适用于任何时间周期。Forex、指数、黄金、加密货币 - 全部集中在一个视图中。 工作原理 扫描器检查您 Market Watch 中的每个品种,寻找实体超过 N x ATR 的K线。当发现这样的K线时,该品种会亮起并显示方向(BUY/SELL)、ATR 比率以及信号出现在多少根K线之前。您可以一目了然地看到哪些品种当前处于活跃状态。 一键导航 点击扫描器中的任何品种名称,您的图表会立即切换到该品种。发现信号,点击它,分析它。无需手动切换品种,无需在图表标签中搜索。 可排序列 点击任何列标题,按品种、价格、信号、比率或时间排序。想先看最强的信号?按 Ratio 排序。想看最新的信号?按 Age 排序。再次点击可反转排序顺序。 与 Power Bar MT5 完美配合 扫描器发现机会。 Power Bar 指标 进行分析。两者结合使用:扫描器在您的观察列表中提醒您出现极端K线,然后点击该品种,让
Trade Manager DashPlus
Henry Lyubomir Wallace
5 (13)
DashPlus 是一款先进的交易管理工具,旨在提升您在 MetaTrader 5 平台上的交易效率和效果。它提供一整套功能,包括风险计算、订单管理、先进的网格系统、基于图表的工具和绩效分析。 主要功能 1. 恢复网格 实施一个平均和灵活的网格系统,以在不利的市场条件下管理交易。 允许设置战略性进出点,以优化交易恢复。 2. 叠加网格 通过在强劲的市场波动中增加仓位,最大化有利交易的潜在回报。 帮助您通过扩展获利交易来利用趋势市场。 3. 盈亏线 在图表上直接提供潜在利润和损失场景的可视化表示。 调整设置并拖动盈亏线,以在执行之前评估各种交易结果。 4. 篮子模式 简化同一交易品种的多仓位管理,将它们合并为一个聚合仓位。 基于平均价格,便于监控和应用止损、止盈以及其他订单修改。 5. 图表上的新闻 将预定的经济新闻事件整合到您的交易图表中。 帮助您随时掌握可能影响市场波动的即将发生的事件,从而更好地规划交易。 6. 警报 设置基于时间或价格的警报,通知会显示在 MT5 中,或通过 MT5 应用发送到您的移动设备。 对监控关键价格水平或重要的交易时段非常有用。 7. 绩效统计 提供详细的
Trade Manager DaneTrades
Levi Dane Benjamin
4.28 (29)
交易管理器可帮助您快速进入和退出交易,同时自动计算风险。 包括帮助您防止过度交易、报复性交易和情绪化交易的功能。 交易可以自动管理,账户绩效指标可以在图表中可视化。 这些功能使该面板成为所有手动交易者的理想选择,并有助于增强 MetaTrader 5 平台。多语言支持。 MT4版本  |  用户指南+演示 交易经理在策略测试器中不起作用。 如需演示,请参阅用户指南 风险管理 根据%或$自动调整风险 可选择使用固定手数或根据交易量和点自动计算手数 使用 RR、点数或价格设置盈亏平衡止损 追踪止损设置 最大每日损失百分比,在达到目标时自动平仓所有交易。 保护账户免遭过多提款并阻止您过度交易 最大每日损失(以美元为单位)在达到目标时自动关闭所有交易。 保护账户免遭过多提款并阻止您过度交易 一键实现所有交易的盈亏平衡 自动计算从手机/电话发送的交易的风险 OCO 在设置中可用 交易和头寸管理 通过设置每月、每周、每天、每小时或每分钟的最大交易次数,停止过度交易和报复性交易。 高级挂单管理。 调整何时关闭挂单的规则 追踪挂单 支持市价订单和挂单 每日最大利润目标(以美元为单位)以确保头寸并停止
Ultimate Trailing Stop EA MT5
BLAKE STEVEN RODGER
4.13 (8)
This EA Utility allows you to manage (with advanced filtering) unlimited open orders (manual or EA) with 16 trailing stop methods: fixed, percent, ATR Exit, Chandelier Exit, Moving Average, Candle High Low Exit, Bollinger Bands, Parabolic, Envelope, Fractal, Ichimoku Kijun-Sen, Alligator, Exit After X Minutes or Bars, RSI and Stochastic. The trailing stop can be either real or virtual, and you can exit fully or with a partial close percent on touch or bar close.  Moreover, you can add (override
Smart Stop Scanner – 多品种结构化止损扫描系统 概述 Smart Stop Scanner 为交易者提供跨市场的专业止损结构监控。系统基于真实市场结构、关键突破点以及价格行为逻辑,自动识别最有意义的止损区域,并在统一的、高度清晰、DPI 自适应面板中展示所有信息。 适用于 Forex、黄金、指数、金属、加密货币等多种资产。 止损如何计算 本系统并未使用传统指标或任意公式,而是通过纯价格行为识别 突破、更高高点、更低低点 等结构事件。 止损位置基于这些结构节点生成,因此更加真实、自然,并与实际市场行为紧密吻合。 核心功能亮点 • 多品种精准兼容 完整支持外汇、黄金、指数、金属、加密资产及其他工具,自动处理不同的点值和小数位。 • 即时结构识别 实时检测新的、失效的和当前有效的止损结构,并提供方向、形成时间、距离等关键信息。 • SL %ADR – 自适应止损质量评估 每个止损都会与该品种历史的结构性止损事件进行统计对比。 自适应颜色区间清晰显示止损是 极紧、紧、适中、宽、非常宽 。 基于真实波动率,而非固定阈值。 • Dist % – 实时止损距离
EasyTrade MT5
Alain Verleyen
5 (3)
Easy Trade – 智能、简洁且强大的交易管理工具 Easy Trade 是为 MetaTrader 用户打造的一体化交易管理解决方案,帮助您轻松掌控风险,实现流畅交易执行。 它是根据交易者的反馈从零开始开发的,简化了多品种交易的执行、监控和管理流程,无需繁琐的操作。 无论您是手动短线交易者,还是管理多个交易设置的小型投资组合,Easy Trade 都能让您专注于明智决策和稳定盈利。 ⸻ 为什么选择 Easy Trade? 精准风险管理:可选择固定手数或按百分比定义每笔交易的风险。实时显示风险与潜在收益。 篮子式跟踪止盈:追踪多笔交易的总利润,目标达成时自动锁定部分收益,适用于组合交易。 交易截图记录:每笔交易都可截图保存,方便日记记录、回顾与绩效分析。 定时自动平仓:可设定具体日期和时间自动关闭持仓,适合日终或周末前平仓。 界面可自定义:可调整按钮排序与大小、线条样式与颜色、缩放比例等,满足个人使用习惯。 ⸻ 主要功能(版本 1.0) 魔术号与策略标签: 使用注释标记轻松区分不同策略的交易,便于统计与复盘。 手数设置: 支持固定手数或基于止损与账户资金百分比的动态手
Trade Assistant 38 in 1
Makarii Gubaydullin
4.91 (23)
多功能工具:手数计算器,网格订单,风险回报比,交易管理器,供求区域,价格行为等等 演示版本   |   用户手册 交易助手   不能在策略测试器中工作 :您可以下载   此处的演示版本  来测试此 工具 。 联系我   如有任何问题  / 改进建议 / 发现错误 如需MT4版本,请访问 此处 简化、加速并自动化您的交易   流程 。通过此   仪表板 扩展标准终端功能。 交易面板  适用于任何交易品种:外汇、股票、指数、加密货币等。 1. 开立新交易 :手数 / 风险 / 风险回报比计算 :手动交易的风险管理 手数计算器(根据风险大小计算交易量) 风险计算器(根据手数大小计算风险金额) 风险回报   比率 网格订单:  + 动态距离选项,及拆分手数选项 订单激活触发器,+ 买入止损限价 / 卖出止损限价 虚拟止损,虚拟止盈(隐藏止损,隐藏止盈:经纪商不可见) 智能止损 / 入场价位:若K线收盘突破则避免虚假触发 隐藏订单(虚拟挂单) 计划订单:即使市场休市也可挂单交易(周末计划器) 额外多级止盈价位 具有不同ID的OCO(一单取消另一单)订单 图表上的交易可视化 + 调整 止损 /
The News Filter MT5
Leolouiski Gan
4.77 (22)
这个产品在新闻时间过滤所有的专家顾问和手动图表,因此您不必担心突然的价格波动会破坏您的手动交易设置或其他专家顾问输入的交易。此产品还带有完整的订单管理系统,可在任何新闻发布前处理您的持仓和挂单。一旦您购买了   The News Filter ,您将不再需要依赖以后的专家顾问内置的新闻过滤器,因为这个产品可以从此过滤它们所有。 新闻选择 新闻来源于Forex Factory的经济日历。 选择可以基于任何一种货币,如USD,EUR,GBP,JPY,AUD,CAD,CHF,NZD和CNY等。 选择也可以基于关键识别,例如Non-Farm (NFP),FOMC,CPI等。 能够选择新闻影响级别的筛选,从低、中、到高影响。 自动模式只选择与图表相关的新闻。 新闻来源每小时自动刷新,以确保最新的新闻数据。 为每个新闻影响级别提供单独的输入,以确定您要过滤掉的新闻发布前后的分钟数。 订单管理选项 在新闻发布前关闭未平仓头寸的选项,并在新闻发布后恢复它们。 在新闻发布前删除挂单的选项,并在新闻发布后恢复它们。 在新闻发布前移除止损和止盈水平的选项,并在新闻发布后恢复它们。 在新闻发布前移动止损和
Risk Manager for MT5
Sergey Batudayev
4.31 (16)
MT5 的 Expert Advisor 风险管理器是一个非常重要的程序,我认为对每个交易者来说都是必要的程序。 使用此 EA 交易,您将能够控制您交易账户中的风险。风险和利润控制可以以货币形式和百分比形式进行。 要让智能交易系统工作,只需将其附加到货币对图表并以存款货币或当前余额的百分比设置可接受的风险值。 PROMO BUY 1 GET 2 FREE -   https://www.mql5.com/en/blogs/post/754725 顾问功能 该风险经理将帮助您控制风险: - 交易 - 每天 - 一个星期 - 一个月 你也可以控制 1) 交易时允许的最大手数 2) 每天最大订单数 3) 每天最大利润 4) 设置 Equity 的获利了结 不仅如此,如果您在设置中指定自动设置,顾问还可以为您设置默认的止损和止盈。 顾问会在每个事件中附上警报,并向您解释删除订单的原因。比如你开了,你开了第6个订单,按照你的规则你每天只允许开5个订单,顾问会立即删除6个并说明原因。 例如,您开仓的手数比您最初向自己指示的手数大,顾问将删除订单并解释原因。例如,您每天赚取 5
EA Auditor
Stephen J Martret
5 (1)
EA AUDITOR - 购买前验证EA MetaTrader 5 唯一独立的EA与信号验证工具 每次都做出更明智的EA购买决策。 MQL5市场拥有一些由才华横溢的开发者打造的出色EA——这些策略能够改变您的交易。但市场中也存在内置历史读取器以伪造回测结果的EA、过度拟合策略、被操纵的信号,以及被虚假宣传为"AI驱动"或"机器学习"的EA,而实际上不过是贴了流行标签的基础指标。问题在于?付款之前几乎无法分辨真假。EA Auditor改变了这一现状。它独立审计任何回测、任何开发者发布的实盘信号,并将两者交叉验证——让优秀的EA脱颖而出,让问题EA在您冒险一分钱之前就被曝光。 为什么选择EA AUDITOR? 因为没有验证,再好的回测也毫无意义。 大多数EA卖家提供回测结果来展示其策
Cerberus Equity Watcher
Samuel Bandi Roccatello
5 (3)
Cerberus the Equity Watcher 是一种风险管理工具,可以持续监控您的账户资产并避免因错误的 EA 或您的情绪行为(如果您是全权交易者)导致的重大亏损。对于依赖 EA 的系统交易者来说,它非常有用,EA 可能包含错误,或者在意外的市场条件下可能表现不佳。 Cerberus 允许您设置最小净值和(可选)最大值,如果达到其中任何一个,则所有头寸都被平仓,所有挂单被关闭,所有 EA 被“杀死”。在展平所有位置后,将向用户手机发送通知,并在屏幕上显示一条清晰的消息。在“扁平化”之后, Cerberus 继续关注股权价值,并继续扼杀任何进一步的交易尝试,直到它被重新初始化。 Cerberus 执行的任何操作都清楚地显示在屏幕上,报告在“专家顾问”选项卡上,并向用户发送通知。为了避免用户错误,对用户输入的输入值和自动交易的当前状态进行了多次检查。 ****** 特征 最小和最大权益值可以以账户货币或初始权益的百分比设置 最大净值是可选的 如果达到最小/最大净值,则所有 EA 将独立于它们交易的符号被终止 第一次压扁后几秒钟进行双重检查 Cerberus 在拉平后也继续监控股权
作者的更多信息
WalkForwardOptimizer MT5
Stanislav Korotky
3.78 (9)
WalkForwardOptimizer library allows you to perform rolling and cluster walk-forward optimization of expert advisers (EA) in MetaTrader 5. To use the library include its header file WalkForwardOptimizer.mqh into your EA source code, add call provided functions as appropriate. Once the library is embedded into EA, you may start optimization according to the procedure described in the User guide . When it's finished, intermediate results are saved into a CSV file and some special global variables.
AutomaticZigZag
Stanislav Korotky
4.5 (2)
This is a non-parametric ZigZag providing 4 different methods of calculation. Upward edge continues on new bars while their `highs` are above highest `low` among previous bars, downward edge continues on next bars while their `lows` are below lowest `high` among previous; Gann swing: upward edge continues while `highs` and `lows` are higher than on the left adjacent bar, downward edge continues while `highs` and `lows` are lower than on the left adjacent bar. Inside bars (with lower `high` and
FREE
CustomVolumeDelta
Stanislav Korotky
5 (1)
This indicator displays volume delta (of either tick volume or real volume) encoded in a custom symbol, generated by special expert advisers, such as RenkoFromRealTicks . MetaTrader does not allow negative values in the volumes, this is why we need to encode deltas in a special way, and then use CustomVolumeDelta indicator to decode and display the deltas. This indicator is applicable only for custom instruments generated in appropriate way (with signed volumes encoded). It makes no sense to ap
FREE
VolumeDeltaM1 MT5
Stanislav Korotky
This indicator provides the analysis of tick volume deltas. It monitors up and down ticks and sums them up as separate volumes for buys and sells, as well as their delta volumes. In addition, it displays volumes by price clusters (cells) within a specified period of bars. This indicator is similar to VolumeDeltaMT5 , which uses almost the same algorithms but does not process ticks and therefore cannot work on M1. This is the reason for VolumeDeltaM1 to exist. On the other hand, VolumeDeltaMT5 ca
This is a demo version of a non-trading expert , which utilizes so called the custom symbols feature ( available in MQL as well ) to build renko charts based on historical quotes of selected standard symbol and to refresh renko in real-time according to new ticks. Also it translates real ticks to the renko charts, which allows other EAs and indicators to trade and analyze renko. Place the EA on a chart of a working instrument. The lesser timeframe of the source chart is, the more precise resulti
FREE
HZZM
Stanislav Korotky
4 (1)
This is an adaptive ZigZag based on modification of  HZZ indicator (original source code is available in this article ). Most important changes in this version: two additional indicator buffers added for zigzag evolution monitoring - they show cross signs at points where zigzag direction first changes; zigzag range (H) autodetection on day by day basis; time-dependent adjustment of zigzag range. Parameters: H - zigzag range in points; this parameter is similar to original HZZ, but it can take 0
FREE
WalkForwardDemo MT5
Stanislav Korotky
WalkForwardDemo is an expert adviser (EA) demonstrating how the built-in library WalkForwardOptimizer (WFO) for walk-forward optimization works. It allows you to easily optimize, view and analyze your EA performance and robustness in unknown trading conditions of future. You may find more details about walk-forward optimization in Wikipedia . Once you have performed optimization using WFO, the library generates special global variables (saved in an "archived" file with GVF-extension) and a CSV-f
FREE
ReturnAutoScale
Stanislav Korotky
5 (2)
The indicator calculates running total of linear weighted returns. It transforms rates into integrated and difference-stationary time series with distinctive buy and sell zones. Buy zones are shown in blue, sell zones in red. Parameters: period - number of bars to use for linear weighted calculation; default value - 96; smoothing - period for EMA; default value - 5; mode - an integer value for choosing calculation mode: 0 - long term trading; 1 - medium term trading; 2 - short term trading; defa
FREE
This script allows performing a walk-forward analysis of trading experts based on the data collected by the WalkForwardLight MT5 library. The script builds a cluster walk forward report and rolling walk forward reports that refine it, in the form of a single HTML page. This script is optional, as the library automatically generates the report immediate after the optimization in the tester is complete. However, the script is convenient because it allows using the same collected data to rebuild th
FREE
PointsVsBars
Stanislav Korotky
This indicator provides a statistical analysis of price changes (in points) versus time delta (in bars). It calculates a matrix of full statistics about price changes during different time periods, and displays either distribution of returns in points for requested bar delta, or distribution of time deltas in bars for requested return. Please, note, that the indicator values are always a number of times corresponding price change vs bar delta occurred in history. Parameters: HistoryDepth - numbe
FREE
Order Book, known also as Market Book, market depth, Level 2, - is a dynamically updated table with current volumes of orders to buy and to sell specific financial instument at price levels near Bid and Ask. MetaTrader 5 provides the means for receiving market book from your broker in real time. The expert OrderBook Recorder records market book changes and stores them in local files for further usage in indicators and expert adviser, including testing in the tester. The expert stores market book
FREE
OrderBook Utilities is a script, which performs several service operations on order book hob-files, created by OrderBook Recorder . The script processes a file for work symbol of the current chart. The file date is selected by means of the input parameter CustomDate (if it's filled in) or by the point where the script is dropped on the chart. Depending from the operation, useful information is written into the log, and optionally new file is created. The operation is selected by the input parame
FREE
Order Book, known also as Market Book, market depth, Level 2, - is a dynamically updated table with current volumes of orders to buy and to sell specific financial instument at price levels near Bid and Ask. MetaTrader 5 provides the means for receiving market book from your broker, but in real time only, without access to its history. This expert adviser OrderBook History Playback allows you to playback the market book events on the history using files, created by OrderBook Recorder . The exper
FREE
Comparator
Stanislav Korotky
4.75 (4)
This indicator compares the price changes during the specified period for the current symbol and other reference symbol. It allows to analyze the similar movements of highly correlated symbols, such as XAUUSD and XAGUSD, and find their occasional convergences and divergences for trading opportunities. The indicator displays the following buffers: light-green thick line - price changes of the current symbol for TimeGap bars; light-blue thin line - price changes of the reference symbol ( LeadSymbo
FREE
Year2Year
Stanislav Korotky
This indicator shows price changes for the same days in past years. D1 timeframe is required. This is a predictor indicator that finds D1 bars for the same days in past 8 years and shows their relative price changes on the current chart. Parameters: LookForward - number of days (bars) to show "future" price changes; default is 5; Offset - number of days (bars) to shift back in history; default is 0; ShowAverage - mode switch; true - show mean value for all 8 years and deviation bounds; false - s
FREE
SOMFX1Builder
Stanislav Korotky
5 (1)
If you like trading by candle patterns and want to reinforce this approach by modern technologies, this script is for you. In fact, it is a part of a toolbox, that includes a neural network engine implementing Self-Organizing Map (SOM) for candle patterns recognition, prediction, and provides you with an option to explore input and resulting data. The toolbox contains: SOMFX1Builder  - this script for training neural networks; it builds a file with generalized data about most characteristic pric
FREE
Mirror
Stanislav Korotky
This indicator predicts rate changes based on the chart display principle. It uses the idea that the price fluctuations consist of "action" and "reaction" phases, and the "reaction" is comparable and similar to the "action", so mirroring can be used to predict it. The indicator has three parameters: predict - the number of bars for prediction (24 by default); depth - the number of past bars that will be used as mirror points; for all depth mirroring points an MA is calculated and drawn on the ch
If you like trading crosses (such as AUDJPY, CADJPY, EURCHF, and similar), you should take into account what happens with major currencies (especially, USD and EUR) against the work pair: for example, while trading AUDJPY, important levels from AUDUSD and USDJPY may have an implicit effect. This indicator allows you to view hidden levels, calculated from the major rates. It finds nearest extremums in major quotes for specified history depth, which most likely form resistence or support levels, a
EvoLevels
Stanislav Korotky
The indicator displays most prominent price levels and their changes in history. It dynamically detects regions where price movements form attractors and shows up to 8 of them. The attractors can serve as resistance or support levels and outer bounds for rates. Parameters: WindowSize - number of bars in the sliding window which is used for detection of attractors; default is 100; MaxBar - number of bars to process (for performance optimization); default is 1000; when the indicator is called from
ExtraMovingPivots
Stanislav Korotky
This is an intraday indicator that uses conventional formulae for daily and weekly levels of pivot, resistance and support, but updates them dynamically bar by bar. It answers the question how pivot levels would behave if every bar were considered as the last bar of a day. At every point in time, it takes N latest bars into consideration, where N is either the number of bars in a day (round the clock, i.e. in 24h) or the number of bars in a week - for daily and weekly levels correspondingly. So,
Most of traders use resistance and support levels for trading, and many people draw these levels as lines that go through extremums on a chart. When someone does this manually, he normally does this his own way, and every trader finds different lines as important. How can one be sure that his vision is correct? This indicator helps to solve this problem. It builds a complete set of virtual lines of resistance and support around current price and calculates density function for spatial distributi
The indicator draws a histogram of important levels for several major currencies attached to the current cross rates. It is intended for using on charts of crosses. It displays a histogram calculated from levels of nearest extremums of related major currencies. For example, hidden levels for AUDJPY can be detected by analyzing extremums of AUD and JPY rates against USD, EUR, GBP, and CHF. All instruments built from these currencies must be available on the client. This is an extended version of
StatBars
Stanislav Korotky
The indicator provides a statistic histogram of estimated price movements for intraday bars. It builds a histogram of average price movements for every intraday bar in history, separately for each day of week. Bars with movements above standard deviation or with higher percentage of buys than sells, or vice versa, can be used as direct trading signals. The indicator looks up current symbol history and sums up returns on every single intraday bar on a specific day of week. For example, if current
PriceProbability
Stanislav Korotky
This is an easy to use signal indicator which shows and alerts probability measures for buys and sells in near future. It is based on statistical data gathered on existing history and takes into account all observed price changes versus corresponding bar intervals in the past. The statistical calculations use the same matrix as another related indicator - PointsVsBars. Once the indicator is placed on a chart, it shows 2 labels with current estimation of signal probability and alerts when signal
CCFpExtra
Stanislav Korotky
CCFpExtra is an extended version of the classic cluster indicator - CCFp. This is the MT4 version of indicator  CCFpExt available for MT5. Despite the fact that MT5 version was published first, it is MT4 version which was initially developed and tested, long before MT4 market was launched. Main Features Arbitrary groups of tickers or currencies are supported: can be Forex, CFDs, futures, spot, indices; Time alignment of bars for different symbols with proper handling of possibly missing bars, in
PriceProbabilities
Stanislav Korotky
This is a signal indicator for automatic trading which shows probability measures for buys and sells for each bar. It is based on statistical data gathered on existing history and takes into account all observed price changes versus corresponding bar intervals in the past. The core of the indicator is the same as in PriceProbablility indicator intended for manual trading. Unlike PriceProbability this indicator should be called from MQL4 Expert Advisors or used for history visual analysis. The in
FreqoMeterForecast
Stanislav Korotky
The main idea of this indicator is rates analysis and prediction by Fourier transform. Indicator decomposes exchange rates into main harmonics and calculates their product in future. You may use the indicator as a standalone product, but for better prediction accuracy there is another related indicator - FreqoMaster - which uses FreqoMeterForecast as a backend engine and combines several instances of FreqoMeterForecast for different frequency bands. Parameters: iPeriod - number of bars in the ma
FreqoMaster
Stanislav Korotky
The main idea of this indicator is rates analysis and prediction by Fourier transform. The indicator decomposes exchange rates into main harmonics and calculates their product in future. The indicator shows 2 price marks in history, depicting price range in the past, and 2 price marks in future with price movement forecast. Buy or sell decision and take profit size are displayed in a text label in the indicator window. The indicator uses another indicator as an engine for calculations - FreqoMet
ReturnAutoScaleMix
Stanislav Korotky
This is a very powerful indicator that provides a mix of three running totals of linear weighted returns. Each one is similar to a specific mode of ReturnAutoScale indicator. The result is a scaled superposition of three integrated and difference-stationary time series, each for different trading strategy. Indicator displays three lines: yellow - slow market returns, corresponds to mode 0 in ReturnAutoScale; blue - medium market returns, corresponds to mode 1 in ReturnAutoScale; red - fast marke
MovingFlatBreakout
Stanislav Korotky
This indicator monitors the market for a flat state and possible breakout. The flat state is detected as a predefined number of consecutive bars during which price fluctuates inside a small range. If one of the next bars closes outside the range, breakout is signaled. The indicator shows 3 lines: blue - upper bound of flat ranges AND consecutive breakout areas; red - lower bound of flat ranges AND consecutive breakout areas; yellow - center of flat ranges (NOT including breakout areas). When a b
筛选:
Mohamed Tharwat Hussein El Sherief
377
Mohamed Tharwat Hussein El Sherief 2024.02.27 06:50 
 

Hello,

I have traded Renko for many years manually without using EAs. Like many other traders, I faced the challenge when attempting to Backtest and/or optimize trading EAs based on custom symbols (Renko charts) in MT5. I have tested different Renko Generators EAs. I have generally struggled with these main points:

A-Backtesting results vary a lot.

B-The coders who created these EAs are not responsive and if they do respond, their replies are very short and do not address my concerns.

C- When applying Renko Generators on custom symbols, some Renko generators do not work or the backtesting results do not show 100 percent history quality.

For example: using third-party Tick Data providers to create a custom symbol for any pair and then creating a Renko custom symbol based on this imported tick data. Not all MT5 brokers offer tick data for previous years and thus we need to rely on imported tick data.

The result is that either the Renko Generator does not create a Renko custom symbol (because the source chart is a custom tick data chart) or it creates a custom symbol but the backtesting shows zero percent history quality. Regardless of how accurate and precise the Renko Generator is, there will always be limitations with MT5. It is inevitable as MT5 does not offer a custom-tailored solution for Renko bars. Any EA generator is simply trying to apply the concept of Renko on a time-based chart.

In a time chart, all data series (o/h/l/c) have to be manipulated by any Renko Generator. There are limits and issues. Stanislav (the creator of RenkoFromRealTicks) is very transparent about it in one of his articles. Read them to understand. This shortfall will apply to any Renko Generator you use (from Stanislav or others).

All right! So now starts my review of Stanislav Korotky Renko Generator (RenkoFromRealticks) EA.

1- Communication and support:

I give 5 stars out of 5 for the communication with Stanislav. I purchased his EA when it was version 1. There were so many backtracks done from my end and I had many questions to send to Stanislav. To be honest and straightforward, I am a very skeptical person by nature and I compare different products and always question the result.

It has been a couple of weeks and Stanislav was always responsive and updated his EA with a newer version to address a concern I have. He has also backtested two of my EAs and changed the code in one of them to make sure (from his view) that the backtesting is accurate. I have also sent him a third EA and some tick data and asked him to backtest it without changing the code and his results closely matched with mine.

I have never had such a communication channel with any other Renko Coder! Thank you, Stanislav for your support. I have also sensed you are a sincere coder who takes responsibility for his work and is very open with limitations (from MT5) without hiding or polishing them.

2-Applying RenkoFromRealTicks on Custom symbols: No issues at all. Let’s say you have a custom EURUSD chart built from tick data provided by a third party. You can apply RenkoFromRealTicks on it and it will generate the Renko bars. Some other Renko Generators do not! This is because they rely on one-minute data and the authors won't inform you.

3-Backtesting: Some Renko Generators have a special mode for backtesting. In other words, the user has to change the Renko size for reversal bars. (for example, Reno Reversal should be 200 percent of Renko bar). This is not wrong as this depends on the Author’s recommendations when backtesting. However, in the case of RenkoFromRealTicks, you do not need such a feature and you should not worry about (the artificial opening of a bar) affecting the backtest.

I have exhausted this concern with Stanislav! Besides, it is a lot nicer to see the authentic look of Renko Bars in the bactested chart. Also bear in mind, that some Renko Generators do not address this issue at all! Coders decline to inform their users if backtesting is synthetic and not real. So again: it depends on how the Renko generator is coded and what are the recommendations (if any) for Backtesting.

The recommendation from Stanislav is to choose (Bulk Ticks per box) in the Tick History Mode for the most accurate backtesting. Stanislav may need to update the description of the EA for Backtesting.

Some Renko Generators do not deal well with (compressed tick data)! Read this carefully! Some tick data providers offer a compressed version of their tick data to reduce the file size of tick data. That is great; sometimes you would get 99 percent quality instead of 100 percent.

A one percent difference is not that much when it comes to reducing file sizes on your PC. However, here is the issue: Some Renko generators do not handle well such compressed Data. They construct the bars in the wrong way affect your trading EA Backtesting and give you an unrealistic high profit factor.

But when it comes to RenkoFromReal Ticks, there was no issue at all. This Renko generator deals very well with either compressed or standard-sized data. There was no real concerning discrepancy when I backtested my trading EAs. The important thing is that you have a detailed log report to investigate the construction of Renko bars and the tick data you are using. I have also once downloaded the wrong format of ticks from one of the tick data providers. I downloaded a .csv file that was not meant for MT5. RealDataFrom Ticks EA generated a blank custom symbol and upon going through the log report, I noticed many ticks are being missed or are bad. I then downloaded the right format for MT5, and the EA worked like a charm.

However, when I used another Renko generator, the bars were still created and the trading EA got me an unrealistic high-profit factor. I realized then that RenkoFromRealTicks is a trustworthy Renko generator I should use.

C-History Quality: With RenkoFromRealTicks, I got 99 percent quality with the compressed data and 100 percent quality with standard-size data. When it comes to standard size tick data, I tested another commercial Renko generator and it was close to RenkoFromRealTicks EA but it shows history quality at Zero percent! This does not give me assurance the backtesting is good (even if the results are very close).

D-Online Trading: I have not tested it on online mode but I do not see any reason why it would not perform as expected. Usually, the issue of any Renko EA generator is in backtesting not in online mode.

E-takes a bit of time when constructing the renko bars: I believe this is because it is a genuine Renko generator that does build Renko from real ticks. I have similar MT4 Renko generators that take some time to construct Renko HST and FXT files from tick data. Besides, I was skeptical of other MT5 Renko generators that generate Renko bars on the fly! Or in a few seconds.

I hope I have given a comprehensive review of the product based on experience and knowledge.

Finally, I want to add that I did not have a reference point to compare the backtesting results I got from my trading EAs tested on Renko bars generated by RenkoFromRealTicks EA. I used a couple of EAs in MT4 and MT5 and was looking for an outlier here or there. The best way to make sure that any Renko Generator EA is offering the best backtesting results is to run an EA on a server for a month or so and compare the life trading results with the backtested ones. I have not done this yet.

My Recommendations for future development: (This depends on the users’ opinion and voting for such features)

1-I wish I see another EA from Stanislav (a different product with a different purchase) that offers Flexible Renko Construction. (i.e. changing the open and close offset by percentage). This way it will be a universal Renko builder to create Mean Renko or other exotic Renko bars.

The current EA offers Conventional and rail-to-rail (Point O Chart) Renko bars. The author would be able to code a new Renko generator if there is enough demand for it.

2-Option to build a Renko chart based on a percentage of the price. This will be great for stock trading. I am not fond of Renko based on ATR and I think the percentages will be a better option.

Thank you,

carlospelegrini
87
carlospelegrini 2022.09.29 17:45 
 

the only non-gap renko I found.. it works okay

Alexey Lushnikov
1797
Alexey Lushnikov 2022.04.15 14:58 
 

用户没有留下任何评级信息

回复评论