RenkoFromRealTicks

4.67

This non-trading expert utilizes so called custom symbols feature (available in MQL API as well) to build renko charts based on history of real ticks of selected standard symbol. RenkoFromRealTicks generates custom symbol quotes, thus you may open many charts to apply different EAs and indicators to the renko. It also transmits real ticks to update renko charts in real time.

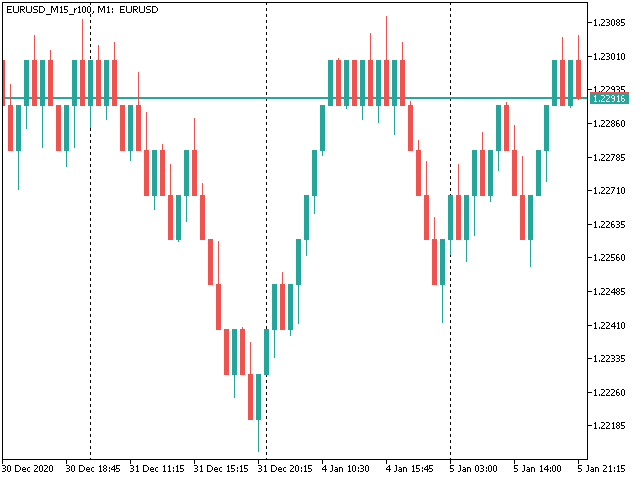
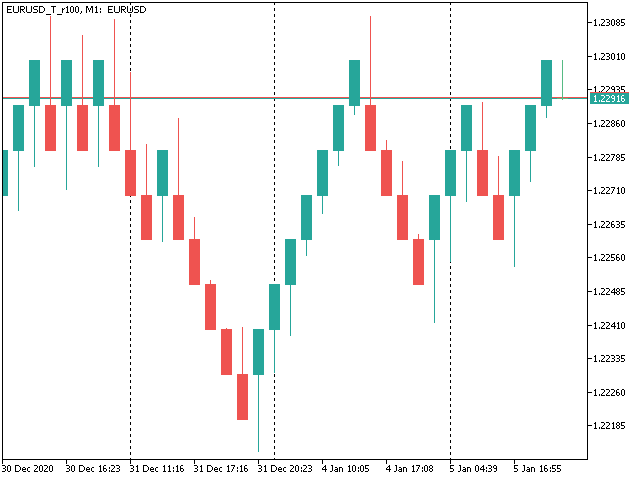
The generated renko chart uses M1 timeframe. It makes no sense to switch the renko chart to a timeframe other than M1. The start time of a "minute" bar does normally correspond to the start time of renko box. The end time of a such "minute" bar is dummy (MetaTrader does not allow for bars with different duration), instead you should look at start time of the next "minute" bar. Optionally, you may enable markup of the boxes by close time (see CloseTimeMode below).

After its placement on a chart, RenkoFromRealTicks downloads tick history and generates renko bars for the custom symbol. This may take a while and require additional space on the disk. EA shows a progress in the comment. When the process is finished, the comment looks like this:

RenkoChart(100pt): open EURUSD_T_r100 / 1000 bars

where 100pt is the requested box size in points, EURUSD_T_r100 is a customizable symbol name, 1000 is a number of generated boxes (if EA is running for the very first time, this is the total number of renko bars, but if it continues on results of a previous terminal session, the number of new boxes can be a few, because only most recent, missing boxes are generated).

You may build renko faster and with less resources using RenkoCharts. But RenkoFromRealTicks is more precise and feature-reach.


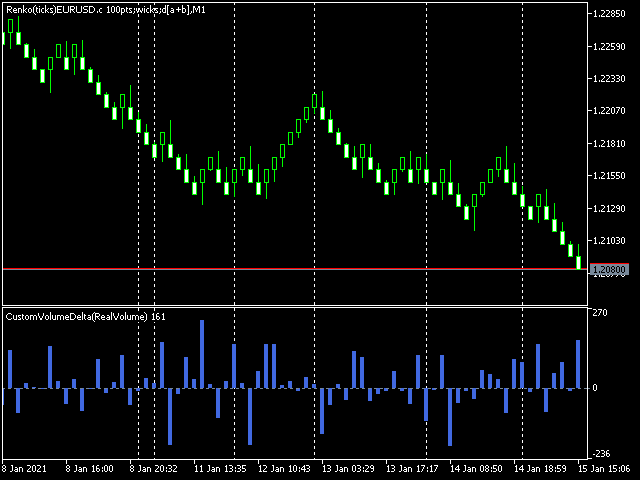
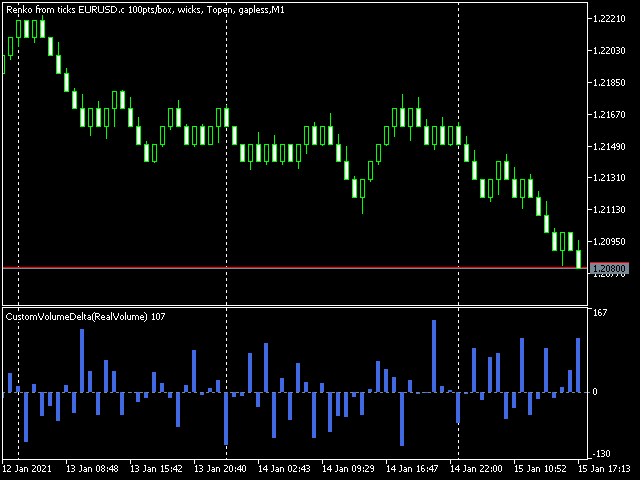
Unique feature - volume delta per box. The delta is encoded in a special way, because MetaTrader does not support negative volumes. This is why you need free CustomVolumeDelta indicator to view it.

Parameters

  • RenkoBoxSize - box size in points, by default - 100;
  • ShowWicks - enable/disable wicks on renko, by default - true;
  • EmulateOnLineChart - enable/disable ticks emulation on renko charts, by default - true; it updates indicators and other EAs on backtests and online;
  • OutputSymbolName - name of the custom symbol for renko, by default - empty string - then the name is formed as "Symbol_T_PrefixSizeSuffix", where Symbol - current work symbol, Prefix - "r" (renko) wicks are enabled or "b" (brick) if disabled, Size - RenkoBoxSize; optional Suffix - "c" for close time mode; "g" - for gapless renko type;
  • Reset - an option to enforce complete recalculation of entire renko chart, by default - false; after it is set to true and calculations are completed, it is recommended to reset it back to false in order to eliminate excessive recalculations on every terminal restart; this mode is helpful in rare cases, when generated renko chart contains an error for some reason; normally the option is disabled, because the EA continues calculation smartly from the most recent existing box;
  • RenkoType - selector of the box calculation algorithm: Conventional or Gapless (also known as non-gap, rail-to-rail, see examples in the pictures);
  • VolumeType - selector of the volumes per box calculations: Total Volume, or Delta Volume with either of 3 algorithms (Ask vs Bid, Ask + Bid, Tick Flags);
  • CloseTimeMode - when true, boxes are shown and formed at their close time; in this mode only 1 tick is generated per box, when box is added completely formed to a chart; by default - false, i.e. boxes are created at open time (the latest live "box" is updated continuously and is not actually a box until it's closed);
  • DropTicksOutsideBars - filter out incorrect ticks (outliers);
  • StartFrom - time where to start the tick history processing, 0 means very beginning;
  • StopAt - time where to stop, 0 means till current time;


Volume Delta Methods

In the method Ask vs Bid tick volumes are considered for buy if Ask price increases, and for sell if Bid decreases (please note, that on some accounts/symbols Bid changes more frequent than Ask, which introduces a negative bias; this is the platform specificity).

The method Ask+Bid analyses the changes of the average price (sum of Ask and Bid): move up - buy, move down - sell.

Tick Flags is based on buy/sell tick flags and applicable for exchanges only.

レビュー 4
Ryan L Johnson
6454
Ryan L Johnson 2026.05.13 17:59 
 

I remember Stanislav Korotky from way back in the heyday of mql4.com. He is a trading veteran. I've been using Stanislav's older and free RenkoTicks utility for several years but due to my current needs and recent MQL5/MT5 updates, I needed a new Renko utility. In general, I really liked the way that RenkoTicks worked so I purchased RenkoFromRealTicks. I should note that this my first purchase ever on mql5.com, and could potentially be my only purchase ever. Once I started writing EA's to run on custom charts, there was no turning back. One feature of RenkoFromRealTicks that manual traders will really like is how the current brick body prints with respect to the current bar open price. Other Renko utilities tend to print a giant current brick body that starts at the previous brick's close─until the current brick closes. In contrast thereto, RenkoFromRealTicks prints bricks more like a standard timeframe bar would print. In conclusion, Stan is the man and more so than Gann.

Mohamed Tharwat Hussein El Sherief
458
Mohamed Tharwat Hussein El Sherief 2024.02.27 06:50 
 

Hello,

I have traded Renko for many years manually without using EAs. Like many other traders, I faced the challenge when attempting to Backtest and/or optimize trading EAs based on custom symbols (Renko charts) in MT5. I have tested different Renko Generators EAs. I have generally struggled with these main points:

A-Backtesting results vary a lot.

B-The coders who created these EAs are not responsive and if they do respond, their replies are very short and do not address my concerns.

C- When applying Renko Generators on custom symbols, some Renko generators do not work or the backtesting results do not show 100 percent history quality.

For example: using third-party Tick Data providers to create a custom symbol for any pair and then creating a Renko custom symbol based on this imported tick data. Not all MT5 brokers offer tick data for previous years and thus we need to rely on imported tick data.

The result is that either the Renko Generator does not create a Renko custom symbol (because the source chart is a custom tick data chart) or it creates a custom symbol but the backtesting shows zero percent history quality. Regardless of how accurate and precise the Renko Generator is, there will always be limitations with MT5. It is inevitable as MT5 does not offer a custom-tailored solution for Renko bars. Any EA generator is simply trying to apply the concept of Renko on a time-based chart.

In a time chart, all data series (o/h/l/c) have to be manipulated by any Renko Generator. There are limits and issues. Stanislav (the creator of RenkoFromRealTicks) is very transparent about it in one of his articles. Read them to understand. This shortfall will apply to any Renko Generator you use (from Stanislav or others).

All right! So now starts my review of Stanislav Korotky Renko Generator (RenkoFromRealticks) EA.

1- Communication and support:

I give 5 stars out of 5 for the communication with Stanislav. I purchased his EA when it was version 1. There were so many backtracks done from my end and I had many questions to send to Stanislav. To be honest and straightforward, I am a very skeptical person by nature and I compare different products and always question the result.

It has been a couple of weeks and Stanislav was always responsive and updated his EA with a newer version to address a concern I have. He has also backtested two of my EAs and changed the code in one of them to make sure (from his view) that the backtesting is accurate. I have also sent him a third EA and some tick data and asked him to backtest it without changing the code and his results closely matched with mine.

I have never had such a communication channel with any other Renko Coder! Thank you, Stanislav for your support. I have also sensed you are a sincere coder who takes responsibility for his work and is very open with limitations (from MT5) without hiding or polishing them.

2-Applying RenkoFromRealTicks on Custom symbols: No issues at all. Let’s say you have a custom EURUSD chart built from tick data provided by a third party. You can apply RenkoFromRealTicks on it and it will generate the Renko bars. Some other Renko Generators do not! This is because they rely on one-minute data and the authors won't inform you.

3-Backtesting: Some Renko Generators have a special mode for backtesting. In other words, the user has to change the Renko size for reversal bars. (for example, Reno Reversal should be 200 percent of Renko bar). This is not wrong as this depends on the Author’s recommendations when backtesting. However, in the case of RenkoFromRealTicks, you do not need such a feature and you should not worry about (the artificial opening of a bar) affecting the backtest.

I have exhausted this concern with Stanislav! Besides, it is a lot nicer to see the authentic look of Renko Bars in the bactested chart. Also bear in mind, that some Renko Generators do not address this issue at all! Coders decline to inform their users if backtesting is synthetic and not real. So again: it depends on how the Renko generator is coded and what are the recommendations (if any) for Backtesting.

The recommendation from Stanislav is to choose (Bulk Ticks per box) in the Tick History Mode for the most accurate backtesting. Stanislav may need to update the description of the EA for Backtesting.

Some Renko Generators do not deal well with (compressed tick data)! Read this carefully! Some tick data providers offer a compressed version of their tick data to reduce the file size of tick data. That is great; sometimes you would get 99 percent quality instead of 100 percent.

A one percent difference is not that much when it comes to reducing file sizes on your PC. However, here is the issue: Some Renko generators do not handle well such compressed Data. They construct the bars in the wrong way affect your trading EA Backtesting and give you an unrealistic high profit factor.

But when it comes to RenkoFromReal Ticks, there was no issue at all. This Renko generator deals very well with either compressed or standard-sized data. There was no real concerning discrepancy when I backtested my trading EAs. The important thing is that you have a detailed log report to investigate the construction of Renko bars and the tick data you are using. I have also once downloaded the wrong format of ticks from one of the tick data providers. I downloaded a .csv file that was not meant for MT5. RealDataFrom Ticks EA generated a blank custom symbol and upon going through the log report, I noticed many ticks are being missed or are bad. I then downloaded the right format for MT5, and the EA worked like a charm.

However, when I used another Renko generator, the bars were still created and the trading EA got me an unrealistic high-profit factor. I realized then that RenkoFromRealTicks is a trustworthy Renko generator I should use.

C-History Quality: With RenkoFromRealTicks, I got 99 percent quality with the compressed data and 100 percent quality with standard-size data. When it comes to standard size tick data, I tested another commercial Renko generator and it was close to RenkoFromRealTicks EA but it shows history quality at Zero percent! This does not give me assurance the backtesting is good (even if the results are very close).

D-Online Trading: I have not tested it on online mode but I do not see any reason why it would not perform as expected. Usually, the issue of any Renko EA generator is in backtesting not in online mode.

E-takes a bit of time when constructing the renko bars: I believe this is because it is a genuine Renko generator that does build Renko from real ticks. I have similar MT4 Renko generators that take some time to construct Renko HST and FXT files from tick data. Besides, I was skeptical of other MT5 Renko generators that generate Renko bars on the fly! Or in a few seconds.

I hope I have given a comprehensive review of the product based on experience and knowledge.

Finally, I want to add that I did not have a reference point to compare the backtesting results I got from my trading EAs tested on Renko bars generated by RenkoFromRealTicks EA. I used a couple of EAs in MT4 and MT5 and was looking for an outlier here or there. The best way to make sure that any Renko Generator EA is offering the best backtesting results is to run an EA on a server for a month or so and compare the life trading results with the backtested ones. I have not done this yet.

My Recommendations for future development: (This depends on the users’ opinion and voting for such features)

1-I wish I see another EA from Stanislav (a different product with a different purchase) that offers Flexible Renko Construction. (i.e. changing the open and close offset by percentage). This way it will be a universal Renko builder to create Mean Renko or other exotic Renko bars.

The current EA offers Conventional and rail-to-rail (Point O Chart) Renko bars. The author would be able to code a new Renko generator if there is enough demand for it.

2-Option to build a Renko chart based on a percentage of the price. This will be great for stock trading. I am not fond of Renko based on ATR and I think the percentages will be a better option.

Thank you,

carlospelegrini
87
carlospelegrini 2022.09.29 17:45 
 

the only non-gap renko I found.. it works okay

おすすめのプロダクト
GDS Renko Anatomy Free Renko Structure and Movement Anatomy Indicator for MetaTrader 5 GDS Renko Anatomy is a free MetaTrader 5 indicator for traders who use Renko charts and want a clearer way to understand how brick-based movement is built. The indicator helps visualize Renko movement anatomy: structure, legs, pullbacks, pauses, continuation areas and weakening movement phases. It does not give buy or sell signals. It does not predict price movement. It is a visual context tool for manual Renk
GDS Renko Ghost Free Renko Market Memory Visualization Indicator for MetaTrader 5 GDS Renko Ghost is a free MetaTrader 5 indicator for traders who use Renko charts and want to study how similar Renko structures behaved in the past. The indicator visualizes historical Renko memory: similar past structures, continuation paths, consensus behavior and uncertainty zones. It does not give buy or sell signals. It does not predict price movement. It is a visual research and context tool for manual Renko
This MT5 indicator provides real-time updates of classic Renko charts. Renko charts focus on price movement, filtering out noise and highlighting trends. What are Renko candles? Renko charts display price movement using "bricks" of equal size, ignoring time. A new brick is drawn only when the price moves by a specified amount. They help visualize trends by removing time-based noise. Parameters - BrickSizePoints  (20): Renko brick size in points - HistoryDepthSec  (3600): Historical data to ini
FREE
Gino Renko
Stephane, Andr Valette
1 (1)
Another renko-based indicator. It returns different usable values ​​for an EA, and is directly displayed on the main chart. Its setting is very simple: The size of the renko The number of bars taken into account The falling color The color on the rise Returned values: Buffer 0 : Value of the middle Buffer 1 : Value of the Top Buffer 2 : Value of the Bottom Buffer 3 : Direction of renko (0.0 for top ; 1.0 for bottom) Buffer 4 : Ratio of the renko, for example, if it is twice, 3 times, ro more of
プロフェッショナル Renko チャート MT5 プロフェッショナル Renko チャート MT5 は、MetaTrader 5 用のシンプルで見やすい Renko チャートインジケーターです。Renko ブロックをインジケーターの別ウィンドウに表示し、必要に応じてメインの価格チャート上にも Renko ボックスを表示できます。 このインジケーターは、MetaTrader 5 内で使い慣れた Renko チャートスタイルを利用したいトレーダー向けに作られています。TradingView などの現代的なチャートプラットフォームで利用できる Renko チャート表示に近い視覚スタイルを目指しています。通常の時間ベースのローソク足を Renko ブロックに変換し、シンプルで分かりやすく実用的な形式で表示します。 複数の通常ローソク足によって、1つの Renko ブロックが形成される場合があります。プロフェッショナル Renko チャート MT5 は、メインの価格チャート上にも Renko ボックスを表示でき、各 Renko ブロックを形成するために何本の通常ローソク足が使用されたかも表示でき
SFP Hunter — Swing Failure Pattern SFP Hunter is a MetaTrader 5 indicator that automatically detects Swing Failure Patterns (SFP) on any symbol and timeframe. The indicator identifies single-candle stop-hunt reversals where price wicks beyond a prior swing high or low and closes back inside on the same candle, signalling a potential reversal from that level. How the Pattern Works A Swing Failure Pattern occurs when price briefly breaches a prior swing high or swing low — triggering the stop orde
MetaTrader 5 (MT5) 用ワールドセッションクロック ワールドセッションクロックは、MetaTrader 5 用のプロフェッショナルなマーケットセッションクロックで、世界の取引セッションをリアルタイムで視覚的に表示します。 トレーダーは、手動での時間計算やタイムゾーン調整を行うことなく、市場の開始、終了、セッションの重複を迅速に把握できます。 この製品は、24時間表示のアナログ時計、デジタル時間表示、セッションアーク、およびオプションのチャートセッションゾーンを、日々の取引に最適な、すっきりとした軽量インターフェースに統合しています。 主な機能 リアルタイム世界市場セッションクロック ウェリントン、シドニー、東京、ロンドン、ニューヨークのセッションに対応 GMT/UTCの自動処理 サマータイムに完全対応 セッションアークとオプションのチャートゾーン(長方形または垂直線) 将来のセッションの視覚化(事前に描画) 時計とデジタル表示のドラッグ可能なアンカーポイント クリーンなオブジェクトベースの描画(インジケーター、バッファなし) あらゆるEAまたはイン
See exactly how close your account is to your prop firm's daily-loss and max-drawdown floors - live, on the chart, with the real rule math of each firm. Most traders track their daily limit with mental math, and the daily-loss breach is the most common way evaluations end. Breach Radar draws the actual floors: - Daily-loss bar: the exact floor level, the dollar distance remaining, and the percent of today's budget already used - Max-drawdown bar: static or trailing (including trailing that loc
FREE
Renko Builder GLX1
Eranga Thilina Dhanushka Gallage
GLX1 Renko Builder   Expert Advisor (EA) can create the Renko bar charts on any symbol. The Renko charts are generated as real-time custom symbol charts which can be further used for technical analysis with any MT5 compatible indicator.  Find the free   GLX1 Renko Euro   Expert Advisor from here.  https://www.mql5.com/en/market/product/115074 Included Features: Truly responsive Renko Charting on a custom symbol chart Accurate automatic live chart update Ability to attach any MT5 indicator Abi
Exp5 Duplicator
Vladislav Andruschenko
4.78 (9)
Duplicator for MetaTrader 5 — 1つの端末内で動作するプロフェッショナルなポジション複製システム MetaTrader 5 ですでに開かれているポジションを自動で複製し、総ボリュームを拡張し、独自のロット設定を適用しながら、複製ポジションを明確なルールで管理したいトレーダーのための信頼性の高い Expert Advisor です。 手動売買、アルゴリズム売買、そして既存ポジションをより柔軟に管理したい場面に適した実用的なツールです。 Duplicator for MT5 は独自の売買戦略で新規ポジションを開くものではありません。役割は、MetaTrader 5 口座内にすでに存在しているポジションを監視し、指定した条件に従ってその複製を作成することです。複製回数、ロットサイズ、Stop Loss、Take Profit、コメント、追加の管理条件まで細かく設定できます。 異なるプラットフォーム間のコピーではなく、 同じ MetaTrader 5 端末内で ポジションを正確に複製したい場合、この MT5 版 Duplicator はその目的のために作られていま
Indicador "MR BEAST - Detectador de Mejores Spikes" para el Índice BOOM1000 (M1) El indicador "MR BEAST - Detectador de Mejores Spikes" es una herramienta especializada y altamente precisa diseñada exclusivamente para operar en el índice CRASH 1000, con un enfoque específico en el marco temporal de 1 minuto (M1). Desarrollado por el reconocido trader Mr. Beast, este indicador ha sido meticulosamente diseñado para identificar únicamente los mejores spikes, permitiendo a los operadores capitalizar
DAILY OH/OL SDEV QUANT MODEL - STATISTICAL TRADING WITH PRECISION RISK MANAGEMENT TRADE WITH MATHEMATICAL CERTAINTY - KNOW YOUR EXACT STOP-LOSS AND TAKE-PROFIT BEFORE YOU ENTER This indicator analyzes 5,000+ days of price history to give you: Exact entry levels (sigma bands locked at daily open) Exact stop-loss distance (from M
Advanced CRT Indicator MT5 — Candle Range Theory Tool Advanced CRT Indicator MT5 is a professional analysis tool that automates Candle Range Theory. It identifies consolidation ranges, breakout levels, Fair Value Gaps (FVG), and profit targets, with a real-time dashboard and alerts. Overview - Multi-timeframe candle range detection   - Automatic breakout levels with buffer settings   - Fair Value Gap identification and tracking   - Up to three customizable target levels (Risk:Reward ratios)  
Renko Chart
Marcin Konieczny
3.56 (9)
This indicator allows to display Renko charts in the indicator window. Renko charts show only price movements that are bigger than the specified box size. It helps to eliminate noise and allows to focus on main trends. Time is not a factor here. Only price movements are taken into account. That's why Renko chart is not synchronized with the main chart it is attached to. Indicator works in two modes: CLOSE - only close prices are taken into account while building the chart HIGH_LOW - only high/l
FREE
GDS Renko Pip ST Chart - Pip-Based Renko Chart Indicator for MetaTrader 5 GDS Renko Pip ST Chart is a pip-based Renko chart indicator for MetaTrader 5. It helps traders build and study cleaner Renko price movement using a practical fixed pip or point-based brick structure. This tool is designed as a Renko chart foundation for manual analysis. It does not predict the market, does not generate buy or sell signals and does not decide whether a trade should be opened. Renko EDGE EA Golden Delta | A
GDS Renko Matrix - Free Multi-Scale Renko Overview Indicator for MetaTrader 5 GDS Renko Matrix is a free multi-scale Renko overview indicator for MetaTrader 5. It helps traders monitor Renko structure, direction and chart context in a compact matrix-style view. The purpose of this tool is to provide a faster visual overview of Renko behavior without turning the chart into a signal system. It does not predict the market and does not generate buy or sell signals. Renko EDGE EA Golden Delta | Alg
FREE
ED Precision Reversal Pro
Egbert Gerhald Janse Van Rensburg
Designed for Gain & Pain Markets ED Precision Reversal Pro has been designed with Gain and Pain markets as a key focus. These markets can produce strong directional movements, rapid price extensions and sudden reversals. The indicator is designed to monitor overextended market conditions and identify potential reversal areas where its configured BUY or SELL conditions are met. It can be used on: Gain Markets Pain Markets XAUUSD (Gold) Forex pairs Indices Other MetaTrader 5 instruments Gain & Pai
Smart SuperTrend Scalping Signals Pro is a MetaTrader 5 indicator designed for traders who want a clean visual trend-following system directly on the chart. Instead of displaying the traditional SuperTrend as a line, the indicator colors the actual price candles based on the current market condition. Green candles indicate bullish SuperTrend conditions, red candles indicate bearish SuperTrend conditions, and gray candles indicate sideways or weak-trend conditions. The indicator also includes a s
The ATR Indicator Based on Heiken Ashi is a unique volatility analysis tool that combines the Average True Range (ATR) with Heiken Ashi candlestick calculations to provide a smoother and more reliable measure of market volatility. Unlike the traditional ATR, which uses standard candlesticks, this indicator applies the Heiken Ashi formula to filter out market noise and deliver a clearer volatility signal. Key Features: • ATR Calculation Based on Heiken Ashi Candlesticks – Offers a more stable v
FREE
Power Candles Strategy Scanner - 自動最適化型マルチシンボル設定ファインダー パワーキャンドル・ストラテジー・スキャナーは 、パワーキャンドル・インジケーターを駆動するのと全く同じ自己最適化エンジンを、マーケットウォッチに登録されているすべての銘柄に対して並行して実行します。1つのパネルで、現在統計的に取引可能な銘柄、各銘柄で勝率の高い戦略、最適なストップロス/テイクプロフィットの組み合わせが表示され、新たなシグナルが発生した瞬間に通知が届きます。 このツールは、Stein Investmentsのエコシステムの一部です。  18種類以上のツールをすべて閲覧し、AIを活用したセットアップの推奨を受け取り、  https://stein.investments でコミュニティに参加しましょう 市場動向を網羅。銘柄ごとに3,000件以上の自動最適化。2種類のアラート。ワンクリックでチャートを切り替えて即座にアクション。 なぜこれが必要なのか 多くのマルチ銘柄スキャナーは、 価格の動き (ボラティリティ、変動率、銘柄ごとのRSI)を表示するだけです。それ
GDS Renko Structure Free Renko Structure Indicator for MetaTrader 5 GDS Renko Structure is a free MetaTrader 5 indicator for traders who use Renko charts and want a clearer way to read market structure, movement phases and brick-based behavior. The indicator helps visualize how Renko structure is forming on the chart: movement legs, pauses, continuation areas, pullback behavior and structural shifts. It does not give buy or sell signals. It does not predict price movement. It is a visual context
The Expert Advisor is used to create Renko chart, realtime updates, easy for technical analysis. Backtest your strategy with all indicators with Renko chart in MetaTrader 5. Parameters Box Size : input the number of box size. Show Wicks : if true , draw a candle with high/low. History Start: input the date to creat first candle. Maximum Bars: limit number of bars on renko chart How to use Attach the Expert Advisor to a chart (timeframe M1), for which you want to create a renko. Input box size a
Precision Instant
Jerson Daryl Herrera Arroyo
FREE TRY P.I.P.S FREE FOR 10 DAYS PRUEBA P.I.P.S GRATIS POR 10 DIAS EN: Download now and get a free 10-day trial license . Full features, demo account, no credit card needed. ES: Descarga ahora y obtén una licencia de prueba gratis por 10 días . Todas las funciones, cuenta demo, sin tarjeta de crédito. 10 DAYS 10 DIAS DEMO ONLY SOLO DEMO FULL ACCESS ACCESO COMPLETO NO CARD SIN TARJETA SEND A MESSAGE TO REQUEST YOUR FREE TRIAL ENVIA UN MENSAJE PARA SOLICITAR TU PRUEBA GRATIS P.I
This SMT (Smart Money Technique) divergence indicator identifies discrepancies in price movement between two different trading symbols, helping traders detect potential market reversals. This tool compares the price action of two correlated assets, such as two currency pairs or indices, to spot divergences where one asset's price moves in the opposite direction of the other. For example, while one symbol may be making higher highs, the other might be making lower highs, signaling a divergence. T
FREE
Heikin Ashi candlesticks are a powerful tool for traders, offering a clear and smooth visualization of market trends. Unlike traditional candlesticks, they filter out market noise, providing a cleaner view of the market's direction and strength, which helps traders make more informed decisions. The Hull Heikin Ashi Smoothed indicator from Minions Labs takes this a step further by integrating the Hull Moving Average for enhanced smoothing and precision. This indicator not only simplifies trend id
Advanced 4xZeovo MT5 Indicator (MetaTrader 5)   Product Description  4xZeovo is a powerful trading indicator system monitoring 24/7 financial markets. Metatrader5 tool designed to find the best buying/selling opportunities and notifies the user.    Making life easy for traders in helping with the two most difficult decisions with the use of advanced innovate trading indicators aiming to encourage users to hold the winning positions and take profit at the best times.    Equipped with a unique tra
Indicador "MR BEAST - Detectador de Mejores Spikes" para el Índice CRASH 300(M1) El indicador "MR BEAST - Detectador de Mejores Spikes" es una herramienta especializada y altamente precisa diseñada exclusivamente para operar en el índice CRASH 1000, con un enfoque específico en el marco temporal de 1 minuto (M1). Desarrollado por el reconocido trader Mr. Beast, este indicador ha sido meticulosamente diseñado para identificar únicamente los mejores spikes, permitiendo a los operadores capitalizar
Indicador "MR BEAST - Detectador de Mejores Spikes" para el Índice CRASH 500(M1) El indicador "MR BEAST - Detectador de Mejores Spikes" es una herramienta especializada y altamente precisa diseñada exclusivamente para operar en el índice CRASH 1000, con un enfoque específico en el marco temporal de 1 minuto (M1). Desarrollado por el reconocido trader Mr. Beast, este indicador ha sido meticulosamente diseñado para identificar únicamente los mejores spikes, permitiendo a los operadores capitalizar
Trend Direction ADX indicator Trend Direction ADX is part of a serie of indicators used to characterize market conditions. Almost any strategy only work under certain market conditions. Therefore it is important to be able to characterize market conditions at any time: trend direction, trend strength, volatility, etc.. Trend Direction ADX is an indicator to be used to characterize trend direction: trending up trending down ranging Trend Direction ADX is based on ADX standard indicator. Tre
GDS Renko Adaptive - Adaptive Renko Chart Indicator for MetaTrader 5 GDS Renko Adaptive is a free adaptive Renko chart indicator for MetaTrader 5. It helps traders observe price movement through a more flexible Renko structure instead of relying only on one fixed brick-size view. The purpose of this tool is to support manual Renko analysis by making structure, movement rhythm and changing market conditions easier to observe. It does not predict the market and does not generate buy or sell signal
このプロダクトを購入した人は以下も購入しています
Trade Assistant MT5
Evgeniy Kravchenko
4.43 (216)
取引 ごとのリスクの 計算、新規注文 の 簡単 な 設置、部分的 な 決済機能 を 持 つ 注文管理、 7 種類 のトレーリングストップなど 、便利 な 機能 を 備 えています 。 追加の資料と説明書 インストール手順   -   アプリケーションの手順   -   デモアカウント用アプリケーションの試用版 ライン機能 チャート上にオープニングライン、ストップロス、テイクプロフィットを表示します。この機能により、新規注文を簡単に設定することができ、注文を出す前にその特徴を確認することができます。   リスク計算 リスク計算機能は、設定されたリスクとストップロス注文のサイズを考慮して、新規注文のボリュームを計算します。ストップロスの大きさを自由に設定できると同時に、設定したリスクを守ることができます。 Lot calc ボタン - リスク 計算 を 有効 / 無効 にします 。 Risk フィールドでは 、必要 なリスクの 値 を 0 から 100 までのパーセンテージまたは 預金通貨 で 設定 します 。 設定」 タブで 、 リスク 計算 の 種類 を 選択 します :「 $ 通
Trade Manager EAへようこそ。これは、取引をより直感的、正確、そして効率的にするために設計された究極の リスク管理ツール です。これは単なるオーダー実行ツールではなく、包括的な取引計画、ポジション管理、リスク管理のためのソリューションです。初心者から上級者、迅速な実行を必要とするスキャルパーまで、Trade Manager EAはあらゆるニーズに対応し、為替、指数、商品、暗号通貨などさまざまな市場で柔軟に対応します。 Trade Manager EAを使用すると、複雑な計算が過去のものになります。市場を分析し、エントリーポイント、ストップロス、テイクプロフィットのレベルをチャート上のラインでマークし、リスクを設定するだけで、Trade Managerが最適なポジションサイズを即座に計算し、SLとTPをピップ、ポイント、口座通貨でリアルタイムに表示します。すべての取引が簡単かつ効果的に管理されます。 主な機能: ポジションサイズ計算機 :定義されたリスクに基づいて取引サイズを瞬時に決定します。 簡単な取引計画 :エントリー、ストップロス、テイクプロフィットを設定するためのド
================================================================================ POC BREAKOUT - V20.72. Full Professional Grade Toolkit ================================================================================ POC Breakout is a full MetaTrader 5 trading dashboard for discretionary traders who want breakout signals, Point of Control (POC) context, volume profiles, order flow, market structure, news, alerts, and advanced trade planning in one professional workspace. Attached directly to you
Local Trade Copier EA MT5
Juvenille Emperor Limited
4.94 (149)
Local Trade Copier EA MT5 は、同一の Windows PC または Windows VPS 上で稼働する複数の MetaTrader 5 口座間で、取引をコピーおよび管理するための高速で柔軟なトレードコピーツールです。 ローカルでの取引同期に加え、Receiver 側でロットサイズ、リスク管理、取引フィルター、シンボルマッピング、取引管理、口座保護を個別に設定できます。 Transmitter と Receiver のターミナルは約 1分 で設定でき、同一ブローカーまたは異なるブローカーの口座間で、手動取引や EA による取引をコピーできます。適切な条件下では、ローカルの MetaTrader ターミナル間で取引情報を 0.5秒未満 で同期できます。実際の約定速度は、ブローカーのレイテンシー、ネットワーク状況、PC/VPS の性能、ターミナルの負荷によって異なります。 ご購入前に無料デモをお試しください Local Trade Copier EA MT5 の完全機能版無料デモ を、MT5 デモ口座で 1回につき4時間 テストできます。 Local Trad
Telegram to MT5 Multi-Channel Copier   は、Telegram チャンネルのトレードシグナルを MetaTrader 5 へ自動コピーします。ボット不要、ブラウザ拡張不要、手動コピー不要。Telegram にシグナルが届くと、EA が数秒であなたのターミナルに注文を出します。 さらに、チャンネルをコピーする前に、内蔵バックテスターでそのチャンネルがあなたの口座でどう動いたかを確認できます。 製品は 2 つのコンポーネントで構成されます:Telegram チャンネルを監視する Windows アプリと、MT5 ターミナルでシグナルを執行する本 EA です。MT4 版もあります   こちら . セットアップガイドとアプリのダウンロード:   https://www.mql5.com/en/blogs/post/768988 Telegramのシグナルチャンネルをバックテストする方法 をご覧ください。 現在の価格は今後値上げされます。 仕組み アプリはあなた自身の Telegram アカウントで接続するため、フォローしているすべてのチャンネル、グループ、ト
TradePanel MT5
Alfiya Fazylova
4.88 (170)
Trade Panelは多機能なトレーディングアシスタントです。アプリには手動取引用の50以上のトレーディング機能が搭載されており、ほとんどの取引作業を自動化することができます。 アプリの説明書: https://www.mql5.com/en/blogs/post/756482 デモ口座用アプリの試用版: https://www.mql5.com/en/blogs/post/750865 アプリのインストール方法: https://www.mql5.com/en/blogs/post/756239 アプリをビジュアルモードでテストする方法: https://www.mql5.com/en/blogs/post/770277 VPSのMetaTraderにアプリをインストールする方法: https://www.mql5.com/en/blogs/post/770190 取引。 ワンクリックで取引操作を行うことができます: リスクを自動計算して指値注文やポジションを開く。 複数の注文やポジションをワンクリックで開く。 注文のグリッドを開く。 保留中の注文やポジションをグループごとに閉じる
自分の取引ルールで Telegram のシグナルをコピー Telegram to MT5 Signal Trader は、Telegram の公開・非公開チャンネルやグループから、テキスト形式の取引シグナルを MetaTrader 5 へ自動でコピーします。1つのデスクトップアプリで複数の配信者と MT5 口座を管理し、 配信者ごとにリスクと取引設定を個別に指定 できます。 シグナルのコピーに Telegram ボットや API 設定は必要ありません。 電話番号または QR コードでご自身の Telegram アカウントにログインし、すでに参加しているチャンネルやグループを選ぶだけです。ボットの作成や、Telegram API トークン、API ID、API hash の入力は不要です。 ポジションサイズを選び、複数の利確水準に分けて決済し、建値へのストップ移動やトレーリングストップを自動化できます。配信者のシグナルを受け取りながら、実際の取引方法は自分で管理できます。 本製品は、この MT5 エキスパートアドバイザ(EA)と、必須の Windows 連携アプリで構成されます。 インス
Farmed Hedge Yield Farming | All Markets (Manual - Hybrid - Semi/Automated EA) VERIFIED TRADING RESULTS - Farmed Hedge Yield Axi Copy:  https://www.mql5.com/en/signals/2356376 - Farmed Hedge Yield Exn Copy:   https://www.mql5.com/en/signals/2356404 - Farmed Hedge Yield V Copy:  https://www.mql5.com/en/signals/2357156 IMPORTANT NOTICE: FarmedHedge is a MANUAL-FOCUSED TRADING UTILITY ,not a fully automated EA. Results shown on this Signal include manual trades and overall strategic management.
Exp COPYLOT CLIENT for MT5
Vladislav Andruschenko
3.97 (35)
MetaTrader 5 用のプロフェッショナル取引コピー機 MetaTrader 向けの高速・高性能・信頼性の高い 取引コピー機 です。 COPYLOT は、MT4 と MT5 のターミナル間で Forex 取引をコピーでき、 Hedge 口座と Netting 口座の両方に対応しています。 COPYLOT MT5 版の対応構成: - MT5 Hedge → MT5 Hedge - MT5 Hedge → MT5 Netting - MT5 Netting → MT5 Hedge - MT5 Netting → MT5 Netting - MT4 → MT5 Hedge - MT4 → MT5 Netting MT4 版 完全な説明 + DEMO + PDF 購入方法 インストール方法 ログファイルの取得方法 テストと最適化の方法 Expforex のすべての製品 MT4 ターミナルへのコピーも可能です(MT4 → MT4、MT5 → MT4): COPYLOT CLIENT for MT4 COPYLOT は、2台、3台、さらには10台のターミナル間で同時に動作できる、プロフェッ
Signal TradingView to MT5 Pro Automator TradingViewとMetaTrader 5間の即時プロフェッショナル実行 TradingViewのシグナル(アラート)とMT5での実際の約定を繋ぐ、最も強固なコミュニケーションブリッジで、取引戦略を自動化します。スピード、柔軟性、そして完璧なリスク管理を求めるトレーダー向けに設計されたこのExpert Advisorは、あらゆるアラートメッセージを正確な成行または指値注文に変換します。 強みと利点 ユニバーサルパーシングエンジン(独自技術): あらゆるアラート形式からデータを自動的に認識し、抽出できる高度なテクノロジー。単一の固定フォーマットに制限されることはありません。システムはシンボル(銘柄)、アクション、価格、SL(ストップロス)、TP(テイクプロフィット)を自動的に理解します。 リアルタイム実行: レイテンシ(遅延)を最小限に抑えるよう最適化された、1秒未満の超高速ポーリング技術。シグナルを受信してから数ミリ秒以内に注文が実行されます。 機関投資家レベルのリスク管理: 以下に基づく自動かつ正確
MT5 to Telegram Signal Provider は、Telegramのチャット、チャンネル、またはグループに 指定された シグナルを送信することができる、完全にカスタマイズ可能な簡単なユーティリティです。これにより、あなたのアカウントは シグナルプロバイダー になります。 競合する製品とは異なり、DLLのインポートは使用していません。 [ デモ ] [ マニュアル ] [ MT4版 ] [ Discord版 ] [ Telegramチャンネル ]  New: [ Telegram To MT5 ] セットアップ ステップバイステップの ユーザーガイド が利用可能です。 Telegram APIの知識は必要ありません。必要な全ては開発者から提供されます。 主な特長 購読者に送信する注文の詳細をカスタマイズする機能 例えば、Bronze、Silver、Goldといった階層型のサブスクリプションモデルを作成できます。Goldサブスクリプションでは、すべてのシグナルが提供されます。 id、シンボル、またはコメントによって注文をフィルターできます 注文が実行されたチャート
Premium Trade Manager - コーチ内蔵型トレードパネル Premium Trade Manager は、AIトレーディングコーチをあなたのチャートの中に置き、その下に完全な執行エンジンを備えたツールです。いつも通りにトレードをセットアップし、あなた専任のAIトレーディングコーチ Max にそのセットアップをそのまま読み取らせて、発注前に率直な見解を伝えてもらいましょう。ストップの幅が規律あるアプローチに合っているか、リスクサイズは適切か、高影響のニュースイベントが数分後に迫っていないか、プロップファームの制限に近づいていないか。その下には、クリックの後をすべて処理するエンジンが備わっています。ワンクリックのリスクサイズ計算による発注、チャート上でドラッグして組み立て、発注後も動かせるプラン、最大4段階の分割利確、7種類のトレール方式、リアルタイムのプロップファームコンプライアンス、ニュースガード、そしてコストを自ら採点するスプレッド機能。判断はあなたが下す。Max がもう一度確認する。後のことはすべてパネルが担う。 購入前に実際に触れて試せます。 ブラウザ上でライブ
HINN MAGIC ENTRY – the ultimate tool for entry and position management! SIMPLE. FASTEST. INTUITIVE. MAX AUTOMATED. Place orders by selecting a level directly on the chart! full description   ::  demo-version  :: 60-sec-video-description Key features: - Market, limit, and pending orders - Automatic lot size calculation - Automatic spread and commission accounting - Unlimited partitial take-profits  - Breakeven and trailing stop-loss and take-profit  functions - Invalidation leves - Intuitive, a
EA Overfitter
Stephen J Martret
5 (1)
That backtest looks great. But will it still be making money tomorrow, next week, next month? EA Overfitter re-runs your EA on 100 price histories it has never seen. One score tells you if the edge is real. A backtest tells you what an EA did on one price history — the one that happened to occur. What you cannot tell from it is how much of that result was the strategy and how much was the particular path. EA Overfitter answers that. It builds up to 100 synthetic price histories your EA has n
Footprint Chart Pro — Professional OrderFlow EA for MetaTrader 5 Version 6.34 | Professional tool for real traders | Institutional-Grade Visualization DEMO USERS - PLEASE SELECT EVERY TICK / REAL TICK WHEN TESTING AND YOU HAVE DOWNLOADED HISTORICAL DATA. IF YOU SEE A WAITING SCREEN AND IT IS NOT DOWNLOADING, IT MEANS YOU HAVE LOW HISTORICAL DATA. TRY 1 MIN AND 5 MIN FIRST ON 1 DAY DATA. ONE DAY DATA SHOULD BE THE NEWEST AND MOST CURRENT DATE. PLEASE WAIT UNTIL THE MARKET HAS ROLLED OVER PERIOD.
EA Slipstream
Stephen J Martret
5 (1)
Your backtest filled every order at the price it asked for. Your account does not. EA Slipstream measures what execution costs your EA, using your own fills, slippages and spreads to show you the true performance of your EA. A backtest prices every trade at the level the EA named. In live trading a pending order fills at whatever price is available when it triggers, a stop closes wherever the market is when it is hit, and the spread at that moment is whatever the account was quoting. The differ
Trade Manager は、リスクを自動的に計算しながら、取引を迅速に開始および終了するのに役立ちます。 過剰取引、復讐取引、感情的な取引を防止する機能が含まれています。 取引は自動的に管理され、アカウントのパフォーマンス指標はグラフで視覚化できます。 これらの機能により、このパネルはすべてのマニュアル トレーダーにとって理想的なものとなり、MetaTrader 5 プラットフォームの強化に役立ちます。多言語サポート。 MT4バージョン  |  ユーザーガイド + デモ Trade Manager はストラテジー テスターでは機能しません。 デモについてはユーザーガイドをご覧ください。 危機管理 % または $ に基づくリスクの自動調整 固定ロットサイズを使用するか、ボリュームとピップに基づいた自動ロットサイズ計算を使用するオプション RR、Pips、または価格を使用した損益分岐点ストップロス設定トレーリングストップロス設定 目標に達したときにすべての取引を自動的に終了するための 1 日あたりの最大損失 (%)。 過度のドローダウンからアカウントを保護し、オーバートレードを防ぎます
MT5 用 Dynamic Fibonacci Grid Dashboard の最新バージョンを紹介します。 数多くの新機能を搭載したこの新しいダッシュボードは、トレード体験を一新し、市場や価格アクションをまったく新しい視点から見ることができます。複数のタイムフレームと複数のシンボルを同時に分析することで、新たな可能性を発見できます。手動トレードやポジション管理のための使いやすいインターフェース、そしてあらかじめ設定された自動売買戦略を適用するための拡張機能を備えています。さらに、DFGはストラテジーテスター内でトレーディングシミュレーターとして完全に機能し、過去データを使用してさまざまな市場環境を再現できます。ビジュアルモードで手動トレードを練習したり、高速モードで自動売買戦略をテストしたりすることが可能です。 主な特徴 • Dynamic Fibonacci Bands の概念に基づく、複数タイムフレームおよび複数シンボルの高度なテクニカル分析。 リアルタイム市場監視ダッシュボードにより、これまでにない効率性を体験できます。M1、M5、M15、H1 のチャートから得られる複雑な
Trade Indicator Assistant   is a powerful MT5 utility designed to turn indicators into automated trading systems. Its main feature is the ability to automatically detect an indicator’s   BUY and SELL signal buffers , without requiring you to know the buffer numbers, search through indicator settings, or modify the indicator source code. Bonus Indicator:   After purchasing Trade Indicator Assistant, contact me to receive   Trade Signal Pro   completely free as a bonus indicator. [Download Demo V
Grid Manual MT5
Alfiya Fazylova
4.73 (22)
「Grid Manual」は、注文のグリッドを操作するための取引パネルです。 ユーティリティはユニバーサルで、柔軟な設定と直感的なインターフェイスを備えています。 それは、損失を平均化する方向だけでなく、利益を増やす方向でも注文のグリッドで機能します。 トレーダーは注文のグリッドを作成して維持する必要はありません。 すべてが「Grid Manual」によって行われます。 注文を開くだけで十分であり、「Grid Manual」は注文のグリッドを自動的に作成し、非常に閉じるまでそれに付随します。 完全な説明とデモバージョン ここ。 ユーティリティの主な機能と機能 ユーティリティは、モバイル端末から開かれた注文を含め、あらゆる方法で開かれた注文を処理します。 「制限」と「停止」の2種類のグリッドで機能します。 グリッド間隔の計算には、固定と動的(ATRインジケーターに基づく)の2つの方法で機能します。 オープンオーダーグリッドの設定を変更できます。 チャート上の各注文グリッドの損益分岐点を表示します。 各注文グリッドの利益率を表示します。 ワンクリックでグリッドから収益性の高い注文を閉じるこ
DrawDown Limiter
Haidar Lionel Haj Ali
5 (22)
DrawDown Limiter v5.0 — 高度な口座保護コントローラー DrawDown Limiter v5.0 は、取引口座を監視し、設定されたリスク、利益、ニュース、スケジュール、ロールオーバー、またはポジション数の制限に達した際に自動的に対応する、クライアント側で動作する口座保護コントローラーです。 1つの専用チャートから、 手動取引、自動売買戦略、複数のExpert Advisor、指値・逆指値注文、保有ポジション を監視できます。口座全体を保護することも、Magic Numberを使用して特定のEAまたは複数のEAのみを監視することもできます。 DrawDown Limiter の目的は、単にドローダウンを表示することではありません。 設定した取引ルールを積極的に適用し 、保護条件が有効である限り、そのルールを継続的に実行することを目的としています。 DrawDown Limiter v5.0 は、損失額だけを監視するのではなく、戦略がいつ取引を継続できるのか、どのエクスポージャーを維持できるのか、いつ取引を停止すべきか、そして自動売買環境をいつ安全に再開できるのかま
Seconds Chart - MetaTrader 5で秒足チャートを作成するユニークなツールです。 Seconds Chart を使用すると、秒単位のタイムフレームでチャートを構築でき、標準的な分足や時間足チャートでは得られない柔軟性と分析精度を実現します。例えば、 S15 は15秒足を表します。カスタムシンボルをサポートしているインジケーターやEAをすべて使用できます。標準的なチャートと同様に便利に操作できます。 標準的なツールとは異なり、 Seconds Chart は超短期のタイムフレームでも高い精度と遅延なく作業できるように設計されています。 Free Demo: Seconds Chart v2.29 Demo.ex5 無料デモをダウンロードしてご自身でお確かめください: 完全機能版 - すべての機能が利用可能 24時間テスト - 精度と利便性を評価するのに十分な時間 デモ口座のみ - ほとんどのブローカーで簡単に開設可能 GBPCADチャートのみ - ほとんどの端末で利用可能 これらの制限はデモ版のみに適用されます。製品版は、あらゆる口座タイプ(リアル、デモ、コンテス
Trade Dashboard simplifies how you open, manage, and control your trades, with built-in lot size calculation. It allows you to execute trades, manage risk, and control positions directly on the chart, with tools such as partial close, breakeven, and trailing stop. Designed to reduce manual work and help you stay focused on your trading decisions. A demo version is available for testing. Detailed explanations of features are provided within the MQL5 platform. Installation instructions are include
The product will copy all telegram signal to MT5 ( which you are member) , also it can work as remote copier.  Easy to set up, copy order instant, can work with almost signal formats, image signal,  s upport to translate other language to English Work with all type of channel or group, even channel have "Restrict Saving Content", work with  multi channel, multi MT5 Work as remote copier: with signal have ticket number, it will copy exactly via ticket number. Support to backtest signal. How to s
Your EAs cannot see each other, but Anchor can. Anchor gives you one place to coordinate your EAs, manage risk, and decide when trading is allowed. It works alongside the trading bots you already use without any changes to them. The Problem One EA opens a trade. Then another starts trading. The next thing you know, you wake up to multiple grids built across your account. Each EA may be doing exactly what it was designed to do, but together they can place far more risk on your account than you in
Averager FULL
Vladislav Andruschenko
4.64 (14)
MetaTrader 5 用 Averager — プロフェッショナルな平均化とポジションシリーズ管理システム ドローダウンに入ったポジションを平均化し、さらにトレンド方向・逆トレンド方向の両方に追加エントリーできる強力な Expert Advisor です。 これは単なる平均化ツールではありません。取引シリーズ全体の平均価格、共通の利益目標、そしてポジション管理を柔軟にコントロールするための実践的な管理システムです。 Averager は、独立した自動売買戦略ではありません。すでに開かれている取引を監視し、平均化、追加エントリー、共通のトレーリングストップによってポジションシリーズ全体を管理するための専用ツールです。 手動取引を行うトレーダー、自分自身のシグナルを使うトレーダー、または他の売買システムと組み合わせて使いたいトレーダーに向けて設計されています。損失側に動いたポジションや発展中のポジションを、ひとつの明確な仕組みで管理したい方に最適です。 MT4 バージョン | 完全説明 + DEMO + PDF | 購入方法 | インストール方法 | ログファイルの取得方法 | テス
FUTURES ORDERFLOW FOOTPRINT CHART Professional OrderFlow EA for MetaTrader 5 Version 1.01| Professional tool for real traders | Institutional-Grade Visualization STRATEGY TESTER USERS - PLEASE SELECT EVERY REAL TICK WHEN TESTING AND YOU HAVE DOWNLOADED HISTORICAL DATA. IF YOU SEE A WAITING SCREEN AND IT IS NOT DOWNLOADING, IT MEANS YOU HAVE LOW HISTORICAL DATA. TRY 1 MIN AND 5 MIN FIRST ON 1 DAY DATA. ONE DAY DATA SHOULD BE THE NEWEST AND MOST CURRENT DATE. PLEASE WAIT UNTIL THE MARKET HAS ROL
The Expert Advisor will help you forward all alert from  MetaTrader 5 to Telegram channel/ group.  All alert must save to folder <Data folder>MQL5\Files\Alerts\ , text file with format *.txt and screenshot with format *.gif or *.png. Parameters: - Telegram Bot Token: - create bot on Telegram and get token. - Telegram Chat ID:  - input your Telegram user ID,  group / channel ID - Forward Alert: - default true, to forward alert. - Send message as caption of Screenshot: - default false, set true t
The product is used to trade base on any Alert signal in MT5 Easy to setup, simple format with custom keyword All option to management orders as trailing stop, breakeen, partial close, time filter, news filter ... Option to auto open grid orders How to setup and guide: Let read all details about setup and download indicator for auto get   Alert Signal   here Do not buy if you even can not install demo EA to your VPS ( some VPS block download EA from mql5 market) We always bring customers high q
作者のその他のプロダクト
WalkForwardOptimizer MT5
Stanislav Korotky
3.78 (9)
WalkForwardOptimizer library allows you to perform rolling and cluster walk-forward optimization of expert advisers (EA) in MetaTrader 5. To use the library include its header file WalkForwardOptimizer.mqh into your EA source code, add call provided functions as appropriate. Once the library is embedded into EA, you may start optimization according to the procedure described in the User guide . When it's finished, intermediate results are saved into a CSV file and some special global variables.
AutomaticZigZag
Stanislav Korotky
4.5 (2)
This is a non-parametric ZigZag providing 4 different methods of calculation. Upward edge continues on new bars while their `highs` are above highest `low` among previous bars, downward edge continues on next bars while their `lows` are below lowest `high` among previous; Gann swing: upward edge continues while `highs` and `lows` are higher than on the left adjacent bar, downward edge continues while `highs` and `lows` are lower than on the left adjacent bar. Inside bars (with lower `high` and
FREE
This indicator displays volume delta (of either tick volume or real volume) encoded in a custom symbol, generated by special expert advisers, such as RenkoFromRealTicks . MetaTrader does not allow negative values in the volumes, this is why we need to encode deltas in a special way, and then use CustomVolumeDelta indicator to decode and display the deltas. This indicator is applicable only for custom instruments generated in appropriate way (with signed volumes encoded). It makes no sense to ap
FREE
ADXS
Stanislav Korotky
5 (3)
Ever wondered why standard ADX is made unsigned and what if it would be kept signed? This indicator gives the answer, which allows you to trade more efficient. This indicator calculates ADX values using standard formulae, but excludes operation of taking the module of ADX values, which is forcedly added into ADX for some reason. In other words, the indicator preserves natural signs of ADX values, which makes it more consistent, easy to use, and gives signals earlier than standard ADX. Strictly s
This is a demo version of a non-trading expert , which utilizes so called the custom symbols feature ( available in MQL as well ) to build renko charts based on historical quotes of selected standard symbol and to refresh renko in real-time according to new ticks. Also it translates real ticks to the renko charts, which allows other EAs and indicators to trade and analyze renko. Place the EA on a chart of a working instrument. The lesser timeframe of the source chart is, the more precise resulti
FREE
This indicator provides the analysis of tick volume deltas. It calculates tick volumes for buys and sells separately, and their delta on every bar, and displays volumes by price clusters (cells) within a specified bar (usually the latest one). This is a limited substitution of market delta analysis based on real volumes, which are not available on Forex. The indicator displays the following data in its sub-window: light-blue histogram - buy (long) volumes; orange histogram - sell (short) volumes
Order Book, known also as Market Book, market depth, Level 2, - is a dynamically updated table with current volumes of orders to buy and to sell specific financial instument at price levels near Bid and Ask. MetaTrader 5 provides the means for receiving market book from your broker, but in real time only, without access to its history. This expert adviser OrderBook History Playback allows you to playback the market book events on the history using files, created by OrderBook Recorder . The exper
FREE
Order Book, known also as Market Book, market depth, Level 2, - is a dynamically updated table with current volumes of orders to buy and to sell specific financial instument at price levels near Bid and Ask. MetaTrader 5 provides the means for receiving market book from your broker in real time. The expert OrderBook Recorder records market book changes and stores them in local files for further usage in indicators and expert adviser, including testing in the tester. The expert stores market book
FREE
OrderBook Utilities is a script, which performs several service operations on order book hob-files, created by OrderBook Recorder . The script processes a file for work symbol of the current chart. The file date is selected by means of the input parameter CustomDate (if it's filled in) or by the point where the script is dropped on the chart. Depending from the operation, useful information is written into the log, and optionally new file is created. The operation is selected by the input parame
FREE
SOMFX1Builder
Stanislav Korotky
5 (1)
If you like trading by candle patterns and want to reinforce this approach by modern technologies, this script is for you. In fact, it is a part of a toolbox, that includes a neural network engine implementing Self-Organizing Map (SOM) for candle patterns recognition, prediction, and provides you with an option to explore input and resulting data. The toolbox contains: SOMFX1Builder  - this script for training neural networks; it builds a file with generalized data about most characteristic pric
FREE
WalkForwardDemo is an expert adviser (EA) demonstrating how the built-in library WalkForwardOptimizer (WFO) for walk-forward optimization works. It allows you to easily optimize, view and analyze your EA performance and robustness in unknown trading conditions of future. You may find more details about walk-forward optimization in Wikipedia . Once you have performed optimization using WFO, the library generates special global variables (saved in an "archived" file with GVF-extension) and a CSV-f
FREE
HZZM
Stanislav Korotky
4 (1)
This is an adaptive ZigZag based on modification of  HZZ indicator (original source code is available in this article ). Most important changes in this version: two additional indicator buffers added for zigzag evolution monitoring - they show cross signs at points where zigzag direction first changes; zigzag range (H) autodetection on day by day basis; time-dependent adjustment of zigzag range. Parameters: H - zigzag range in points; this parameter is similar to original HZZ, but it can take 0
FREE
This indicator provides a statistical analysis of price changes (in points) versus time delta (in bars). It calculates a matrix of full statistics about price changes during different time periods, and displays either distribution of returns in points for requested bar delta, or distribution of time deltas in bars for requested return. Please, note, that the indicator values are always a number of times corresponding price change vs bar delta occurred in history. Parameters: HistoryDepth - numbe
FREE
This script allows performing a walk-forward analysis of trading experts based on the data collected by the WalkForwardLight MT5 library. The script builds a cluster walk forward report and rolling walk forward reports that refine it, in the form of a single HTML page. This script is optional, as the library automatically generates the report immediate after the optimization in the tester is complete. However, the script is convenient because it allows using the same collected data to rebuild th
FREE
Comparator
Stanislav Korotky
4.75 (4)
This indicator compares the price changes during the specified period for the current symbol and other reference symbol. It allows to analyze the similar movements of highly correlated symbols, such as XAUUSD and XAGUSD, and find their occasional convergences and divergences for trading opportunities. The indicator displays the following buffers: light-green thick line - price changes of the current symbol for TimeGap bars; light-blue thin line - price changes of the reference symbol ( LeadSymbo
FREE
The indicator calculates running total of linear weighted returns. It transforms rates into integrated and difference-stationary time series with distinctive buy and sell zones. Buy zones are shown in blue, sell zones in red. Parameters: period - number of bars to use for linear weighted calculation; default value - 96; smoothing - period for EMA; default value - 5; mode - an integer value for choosing calculation mode: 0 - long term trading; 1 - medium term trading; 2 - short term trading; defa
FREE
This indicator shows price changes for the same days in past years. D1 timeframe is required. This is a predictor indicator that finds D1 bars for the same days in past 8 years and shows their relative price changes on the current chart. Parameters: LookForward - number of days (bars) to show "future" price changes; default is 5; Offset - number of days (bars) to shift back in history; default is 0; ShowAverage - mode switch; true - show mean value for all 8 years and deviation bounds; false - s
FREE
This indicator predicts rate changes based on the chart display principle. It uses the idea that the price fluctuations consist of "action" and "reaction" phases, and the "reaction" is comparable and similar to the "action", so mirroring can be used to predict it. The indicator has three parameters: predict - the number of bars for prediction (24 by default); depth - the number of past bars that will be used as mirror points; for all depth mirroring points an MA is calculated and drawn on the ch
If you like trading crosses (such as AUDJPY, CADJPY, EURCHF, and similar), you should take into account what happens with major currencies (especially, USD and EUR) against the work pair: for example, while trading AUDJPY, important levels from AUDUSD and USDJPY may have an implicit effect. This indicator allows you to view hidden levels, calculated from the major rates. It finds nearest extremums in major quotes for specified history depth, which most likely form resistence or support levels, a
The indicator displays most prominent price levels and their changes in history. It dynamically detects regions where price movements form attractors and shows up to 8 of them. The attractors can serve as resistance or support levels and outer bounds for rates. Parameters: WindowSize - number of bars in the sliding window which is used for detection of attractors; default is 100; MaxBar - number of bars to process (for performance optimization); default is 1000; when the indicator is called from
This is an intraday indicator that uses conventional formulae for daily and weekly levels of pivot, resistance and support, but updates them dynamically bar by bar. It answers the question how pivot levels would behave if every bar were considered as the last bar of a day. At every point in time, it takes N latest bars into consideration, where N is either the number of bars in a day (round the clock, i.e. in 24h) or the number of bars in a week - for daily and weekly levels correspondingly. So,

Most of traders use resistance and support levels for trading, and many people draw these levels as lines that go through extremums on a chart. When someone does this manually, he normally does this his own way, and every trader finds different lines as important. How can one be sure that his vision is correct? This indicator helps to solve this problem. It builds a complete set of virtual lines of resistance and support around current price and calculates density function for spatial distributi
The indicator draws a histogram of important levels for several major currencies attached to the current cross rates. It is intended for using on charts of crosses. It displays a histogram calculated from levels of nearest extremums of related major currencies. For example, hidden levels for AUDJPY can be detected by analyzing extremums of AUD and JPY rates against USD, EUR, GBP, and CHF. All instruments built from these currencies must be available on the client. This is an extended version of
The indicator provides a statistic histogram of estimated price movements for intraday bars. It builds a histogram of average price movements for every intraday bar in history, separately for each day of week. Bars with movements above standard deviation or with higher percentage of buys than sells, or vice versa, can be used as direct trading signals. The indicator looks up current symbol history and sums up returns on every single intraday bar on a specific day of week. For example, if current
This is an easy to use signal indicator which shows and alerts probability measures for buys and sells in near future. It is based on statistical data gathered on existing history and takes into account all observed price changes versus corresponding bar intervals in the past. The statistical calculations use the same matrix as another related indicator - PointsVsBars. Once the indicator is placed on a chart, it shows 2 labels with current estimation of signal probability and alerts when signal
CCFpExtra is an extended version of the classic cluster indicator - CCFp. This is the MT4 version of indicator  CCFpExt available for MT5. Despite the fact that MT5 version was published first, it is MT4 version which was initially developed and tested, long before MT4 market was launched. Main Features Arbitrary groups of tickers or currencies are supported: can be Forex, CFDs, futures, spot, indices; Time alignment of bars for different symbols with proper handling of possibly missing bars, in
This is a signal indicator for automatic trading which shows probability measures for buys and sells for each bar. It is based on statistical data gathered on existing history and takes into account all observed price changes versus corresponding bar intervals in the past. The core of the indicator is the same as in PriceProbablility indicator intended for manual trading. Unlike PriceProbability this indicator should be called from MQL4 Expert Advisors or used for history visual analysis. The in
The main idea of this indicator is rates analysis and prediction by Fourier transform. Indicator decomposes exchange rates into main harmonics and calculates their product in future. You may use the indicator as a standalone product, but for better prediction accuracy there is another related indicator - FreqoMaster - which uses FreqoMeterForecast as a backend engine and combines several instances of FreqoMeterForecast for different frequency bands. Parameters: iPeriod - number of bars in the ma
The main idea of this indicator is rates analysis and prediction by Fourier transform. The indicator decomposes exchange rates into main harmonics and calculates their product in future. The indicator shows 2 price marks in history, depicting price range in the past, and 2 price marks in future with price movement forecast. Buy or sell decision and take profit size are displayed in a text label in the indicator window. The indicator uses another indicator as an engine for calculations - FreqoMet
This is a very powerful indicator that provides a mix of three running totals of linear weighted returns. Each one is similar to a specific mode of ReturnAutoScale indicator. The result is a scaled superposition of three integrated and difference-stationary time series, each for different trading strategy. Indicator displays three lines: yellow - slow market returns, corresponds to mode 0 in ReturnAutoScale; blue - medium market returns, corresponds to mode 1 in ReturnAutoScale; red - fast marke
フィルタ:
Ryan L Johnson
6454
Ryan L Johnson 2026.05.13 17:59 
 

I remember Stanislav Korotky from way back in the heyday of mql4.com. He is a trading veteran. I've been using Stanislav's older and free RenkoTicks utility for several years but due to my current needs and recent MQL5/MT5 updates, I needed a new Renko utility. In general, I really liked the way that RenkoTicks worked so I purchased RenkoFromRealTicks. I should note that this my first purchase ever on mql5.com, and could potentially be my only purchase ever. Once I started writing EA's to run on custom charts, there was no turning back. One feature of RenkoFromRealTicks that manual traders will really like is how the current brick body prints with respect to the current bar open price. Other Renko utilities tend to print a giant current brick body that starts at the previous brick's close─until the current brick closes. In contrast thereto, RenkoFromRealTicks prints bricks more like a standard timeframe bar would print. In conclusion, Stan is the man and more so than Gann.

Mohamed Tharwat Hussein El Sherief
458
Mohamed Tharwat Hussein El Sherief 2024.02.27 06:50 
 

Hello,

I have traded Renko for many years manually without using EAs. Like many other traders, I faced the challenge when attempting to Backtest and/or optimize trading EAs based on custom symbols (Renko charts) in MT5. I have tested different Renko Generators EAs. I have generally struggled with these main points:

A-Backtesting results vary a lot.

B-The coders who created these EAs are not responsive and if they do respond, their replies are very short and do not address my concerns.

C- When applying Renko Generators on custom symbols, some Renko generators do not work or the backtesting results do not show 100 percent history quality.

For example: using third-party Tick Data providers to create a custom symbol for any pair and then creating a Renko custom symbol based on this imported tick data. Not all MT5 brokers offer tick data for previous years and thus we need to rely on imported tick data.

The result is that either the Renko Generator does not create a Renko custom symbol (because the source chart is a custom tick data chart) or it creates a custom symbol but the backtesting shows zero percent history quality. Regardless of how accurate and precise the Renko Generator is, there will always be limitations with MT5. It is inevitable as MT5 does not offer a custom-tailored solution for Renko bars. Any EA generator is simply trying to apply the concept of Renko on a time-based chart.

In a time chart, all data series (o/h/l/c) have to be manipulated by any Renko Generator. There are limits and issues. Stanislav (the creator of RenkoFromRealTicks) is very transparent about it in one of his articles. Read them to understand. This shortfall will apply to any Renko Generator you use (from Stanislav or others).

All right! So now starts my review of Stanislav Korotky Renko Generator (RenkoFromRealticks) EA.

1- Communication and support:

I give 5 stars out of 5 for the communication with Stanislav. I purchased his EA when it was version 1. There were so many backtracks done from my end and I had many questions to send to Stanislav. To be honest and straightforward, I am a very skeptical person by nature and I compare different products and always question the result.

It has been a couple of weeks and Stanislav was always responsive and updated his EA with a newer version to address a concern I have. He has also backtested two of my EAs and changed the code in one of them to make sure (from his view) that the backtesting is accurate. I have also sent him a third EA and some tick data and asked him to backtest it without changing the code and his results closely matched with mine.

I have never had such a communication channel with any other Renko Coder! Thank you, Stanislav for your support. I have also sensed you are a sincere coder who takes responsibility for his work and is very open with limitations (from MT5) without hiding or polishing them.

2-Applying RenkoFromRealTicks on Custom symbols: No issues at all. Let’s say you have a custom EURUSD chart built from tick data provided by a third party. You can apply RenkoFromRealTicks on it and it will generate the Renko bars. Some other Renko Generators do not! This is because they rely on one-minute data and the authors won't inform you.

3-Backtesting: Some Renko Generators have a special mode for backtesting. In other words, the user has to change the Renko size for reversal bars. (for example, Reno Reversal should be 200 percent of Renko bar). This is not wrong as this depends on the Author’s recommendations when backtesting. However, in the case of RenkoFromRealTicks, you do not need such a feature and you should not worry about (the artificial opening of a bar) affecting the backtest.

I have exhausted this concern with Stanislav! Besides, it is a lot nicer to see the authentic look of Renko Bars in the bactested chart. Also bear in mind, that some Renko Generators do not address this issue at all! Coders decline to inform their users if backtesting is synthetic and not real. So again: it depends on how the Renko generator is coded and what are the recommendations (if any) for Backtesting.

The recommendation from Stanislav is to choose (Bulk Ticks per box) in the Tick History Mode for the most accurate backtesting. Stanislav may need to update the description of the EA for Backtesting.

Some Renko Generators do not deal well with (compressed tick data)! Read this carefully! Some tick data providers offer a compressed version of their tick data to reduce the file size of tick data. That is great; sometimes you would get 99 percent quality instead of 100 percent.

A one percent difference is not that much when it comes to reducing file sizes on your PC. However, here is the issue: Some Renko generators do not handle well such compressed Data. They construct the bars in the wrong way affect your trading EA Backtesting and give you an unrealistic high profit factor.

But when it comes to RenkoFromReal Ticks, there was no issue at all. This Renko generator deals very well with either compressed or standard-sized data. There was no real concerning discrepancy when I backtested my trading EAs. The important thing is that you have a detailed log report to investigate the construction of Renko bars and the tick data you are using. I have also once downloaded the wrong format of ticks from one of the tick data providers. I downloaded a .csv file that was not meant for MT5. RealDataFrom Ticks EA generated a blank custom symbol and upon going through the log report, I noticed many ticks are being missed or are bad. I then downloaded the right format for MT5, and the EA worked like a charm.

However, when I used another Renko generator, the bars were still created and the trading EA got me an unrealistic high-profit factor. I realized then that RenkoFromRealTicks is a trustworthy Renko generator I should use.

C-History Quality: With RenkoFromRealTicks, I got 99 percent quality with the compressed data and 100 percent quality with standard-size data. When it comes to standard size tick data, I tested another commercial Renko generator and it was close to RenkoFromRealTicks EA but it shows history quality at Zero percent! This does not give me assurance the backtesting is good (even if the results are very close).

D-Online Trading: I have not tested it on online mode but I do not see any reason why it would not perform as expected. Usually, the issue of any Renko EA generator is in backtesting not in online mode.

E-takes a bit of time when constructing the renko bars: I believe this is because it is a genuine Renko generator that does build Renko from real ticks. I have similar MT4 Renko generators that take some time to construct Renko HST and FXT files from tick data. Besides, I was skeptical of other MT5 Renko generators that generate Renko bars on the fly! Or in a few seconds.

I hope I have given a comprehensive review of the product based on experience and knowledge.

Finally, I want to add that I did not have a reference point to compare the backtesting results I got from my trading EAs tested on Renko bars generated by RenkoFromRealTicks EA. I used a couple of EAs in MT4 and MT5 and was looking for an outlier here or there. The best way to make sure that any Renko Generator EA is offering the best backtesting results is to run an EA on a server for a month or so and compare the life trading results with the backtested ones. I have not done this yet.

My Recommendations for future development: (This depends on the users’ opinion and voting for such features)

1-I wish I see another EA from Stanislav (a different product with a different purchase) that offers Flexible Renko Construction. (i.e. changing the open and close offset by percentage). This way it will be a universal Renko builder to create Mean Renko or other exotic Renko bars.

The current EA offers Conventional and rail-to-rail (Point O Chart) Renko bars. The author would be able to code a new Renko generator if there is enough demand for it.

2-Option to build a Renko chart based on a percentage of the price. This will be great for stock trading. I am not fond of Renko based on ATR and I think the percentages will be a better option.

Thank you,

carlospelegrini
87
carlospelegrini 2022.09.29 17:45 
 

the only non-gap renko I found.. it works okay

Alexey Lushnikov
1797
Alexey Lushnikov 2022.04.15 14:58 
 

ユーザーは評価に対して何もコメントを残しませんでした

レビューに返信