KT Renko Live Charts MT5

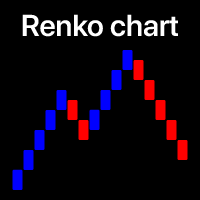
KT Renko Live Chart 工具可在 MT5 平台中生成 Renko 图表,这些图表可用于技术分析、实盘交易或策略研究。该工具所创建的 Renko 图支持大多数自定义指标和自动化交易专家顾问(EA)。

完全兼容我们的 Renko Patterns 指标和 Renko Patterns EA。


功能特点

  • 一款简单明了的 Renko 图表工具,在 MT5 上创建 Renko 图表,无需复杂设置。
  • 支持大多数自定义指标和 EA,可实现 100% 自动化交易。
  • 可在策略测试器中对 Renko 图进行回测,提升策略开发效率。 
  • 可启用或关闭 Renko 的影线显示功能。

输入参数

  • Renko 砖块大小(点): 输入用于生成 Renko 图的砖块/箱体大小(单位为点)。
  • 显示影线: 启用或关闭 Renko 图的影线显示。

故障排查

问: Renko 图没有接收到新的行情数据。

答: 请关闭主图和离线图,重新启动 MetaTrader,再次生成图表。


问: 生成的图表显示不完整或变形。
答: 请确保主图表中有足够的历史数据,数据量应与设定的砖块大小匹配。


问:为什么在 Renko 图上看不到交易持仓?
答: MT5 将 Renko 图视为独立品种。您可以正常加载指标或 EA,但持仓只能在原始图表中显示。

推荐产品
Gino Renko
Stephane, Andr Valette
1 (1)
Another renko-based indicator. It returns different usable values ​​for an EA, and is directly displayed on the main chart. Its setting is very simple: The size of the renko The number of bars taken into account The falling color The color on the rise Returned values: Buffer 0 : Value of the middle Buffer 1 : Value of the Top Buffer 2 : Value of the Bottom Buffer 3 : Direction of renko (0.0 for top ; 1.0 for bottom) Buffer 4 : Ratio of the renko, for example, if it is twice, 3 times, ro more of
Professional Renko Chart MT5 Professional Renko Chart MT5 是一款简洁的 MetaTrader 5 Renko 图表指标,用于在独立的指标窗口中显示 Renko 砖块,并可选择直接在主价格图表上显示 Renko 方框。 该指标适合希望在 MetaTrader 5 中使用熟悉 Renko 图表风格的交易者,其视觉效果类似于 TradingView 等现代图表平台中的 Renko 图表显示方式。它可以将普通的基于时间的K线转换为 Renko 砖块,并以简单、清晰、实用的格式显示结果。 多个普通图表K线可能会形成一个 Renko 砖块。Professional Renko Chart MT5 还可以在主价格图表上显示 Renko 方框,并显示每个 Renko 砖块由多少根普通K线形成。 该指标不是智能交易系统 EA。它不会开仓、平仓或管理交易。它只是一个用于图表显示和市场分析的可视化工具。它可用于手动分析、Renko 图表阅读、趋势观察、价格波动过滤以及市场结构分析。 主要功能 在独立的 MT5 指标窗口中显示 Renko 砖块 Ren
Swing Failure Hunter
Shingidzano Lesetedi
SFP Hunter — Swing Failure Pattern SFP Hunter is a MetaTrader 5 indicator that automatically detects Swing Failure Patterns (SFP) on any symbol and timeframe. The indicator identifies single-candle stop-hunt reversals where price wicks beyond a prior swing high or low and closes back inside on the same candle, signalling a potential reversal from that level. How the Pattern Works A Swing Failure Pattern occurs when price briefly breaches a prior swing high or swing low — triggering the stop orde
Renko Plus
Eadvisors Software Inc.
With Renko Plus you can use the features in the Indicator functionality, just add it to the Metatrader5 chart.             The Renko chart is a type of chart, developed by the Japanese, that is constructed using price movement rather than standardized prices and time intervals like most charts. It is believed to be named after the Japanese word for bricks, "renga", as the graphic looks like a series of bricks.             A new brick is created when the price moves a specified pri
GDS Renko Mirror MT5 Multi-Scale Renko Structure Comparison for MetaTrader 5 GDS Renko Mirror MT5 is a premium Renko context indicator for MetaTrader 5. It helps traders compare Renko market structure across different brick sizes and read whether movement looks clean, noisy, aligned or fragmented. The purpose of Mirror is not to generate buy or sell signals. The purpose is to help the trader understand how the same market movement appears through different Renko scales before making a manual dec
Advanced CRT Indicator MT5 — Candle Range Theory Tool Advanced CRT Indicator MT5 is a professional analysis tool that automates Candle Range Theory. It identifies consolidation ranges, breakout levels, Fair Value Gaps (FVG), and profit targets, with a real-time dashboard and alerts. Overview - Multi-timeframe candle range detection   - Automatic breakout levels with buffer settings   - Fair Value Gap identification and tracking   - Up to three customizable target levels (Risk:Reward ratios)  
MetaTrader 5 (MT5) 世界交易时钟 世界交易时钟是一款专为 MetaTrader 5 设计的专业市场交易时钟,可实时可视化显示全球交易时段。 它帮助交易者快速识别市场开盘、收盘和交易时段重叠,无需手动计算时间或调整时区。 该产品将 24 小时模拟时钟、数字时间显示、交易时段弧线和可选的图表交易时段区域整合到一个简洁轻便的界面中,专为日常交易而设计。 主要功能 实时世界市场交易时钟 支持惠灵顿、悉尼、东京、伦敦和纽约交易时段 自动处理 GMT/UTC 时间 完全支持夏令时 交易时段弧线以及可选的图表区域(矩形或垂直线) 未来交易时段可视化(提前绘制) 时钟和数字显示的可拖动锚点 简洁的基于对象的绘图(无指标,无缓冲区) 可安全地与任何 EA 或指标一起使用 自动化与准确性 时钟和交易时段弧线自动与本地时间同步 图表交易时段区域自动与经纪商服务器时间同步 正确处理跨午夜的交易时段 无需手动偏移或重新校准 图表位置 世界交易时钟目前已针对主图表窗口的使用进行了优化,交易时段区域直接与价格走势对齐。 未来版本计划添加专用的子窗口仪表盘模式(
Gino Renko EA
Stephane, Andr Valette
Here is an EA based on the Renko indicator, it can be used with currencies, commodities, and forex. Just associate it with the corresponding graph. The indicator used for the EA is available here, but it is not necessary for its operation, they are 2 independent products: https://www.mql5.com/fr/market/product/87852?source=Site +Market+MT5+Indicator+Search+Rating006%3agino+renko Personally I don't like renko like EA, and I haven't done any tests to find out which configuration is the best. Th
Advanced 4xZeovo MT5 Indicator (MetaTrader 5)   Product Description  4xZeovo is a powerful trading indicator system monitoring 24/7 financial markets. Metatrader5 tool designed to find the best buying/selling opportunities and notifies the user.    Making life easy for traders in helping with the two most difficult decisions with the use of advanced innovate trading indicators aiming to encourage users to hold the winning positions and take profit at the best times.    Equipped with a unique tra
This SMT (Smart Money Technique) divergence indicator identifies discrepancies in price movement between two different trading symbols, helping traders detect potential market reversals. This tool compares the price action of two correlated assets, such as two currency pairs or indices, to spot divergences where one asset's price moves in the opposite direction of the other. For example, while one symbol may be making higher highs, the other might be making lower highs, signaling a divergence. T
FREE
DAILY OH/OL SDEV QUANT MODEL - STATISTICAL TRADING WITH PRECISION RISK MANAGEMENT TRADE WITH MATHEMATICAL CERTAINTY - KNOW YOUR EXACT STOP-LOSS AND TAKE-PROFIT BEFORE YOU ENTER This indicator analyzes 5,000+ days of price history to give you: Exact entry levels (sigma bands locked at daily open) Exact stop-loss distance (from M
Power Candles 策略扫描器——自优化多符号设置查找器 Power Candles策略扫描器 采用与Power Candles指标相同的自优化引擎,可同时扫描您“市场观察”中的所有交易品种。一个面板即可显示当前哪些品种在统计上具备交易价值、每种策略的最佳应用方向、最优止损/止盈组合,并在新信号触发时立即向您发送提醒。 本工具是 Stein Investments 生态系统的一部分 - 18+ 款工具,加上 Max,您的一对一 AI 交易导师。  随时在线,深入了解每一款指标,在您需要梳理思路的那一刻就在那里。  立即认识他: https://stein.investments 您的全面市场监控。每个交易品种超过3,000次自动优化。2种警报类型。一键切换图表并采取行动。 为何您需要此工具 大多数多标的扫描器仅展示价格 波动 。每只股票的波动率、百分比变化、RSI。您仍需自行摸索正确的策略、合适的止损位以及理想的入场阈值。Power Candles策略扫描器针对每只股票自动解答这些问题,仅在数学验证过的交易设置中触发实际入场信号时才会向您发出提示。这就是全部卖点。 自动
GDS Renko Matrix - Free Multi-Scale Renko Overview Indicator for MetaTrader 5 GDS Renko Matrix is a free multi-scale Renko overview indicator for MetaTrader 5. It helps traders monitor Renko structure, direction and chart context in a compact matrix-style view. The purpose of this tool is to provide a faster visual overview of Renko behavior without turning the chart into a signal system. It does not predict the market and does not generate buy or sell signals. What Renko Matrix Shows Renko char
FREE
**MT5 → Telegram & Discord Auto Post Bot** Want to automate your trading and stop wasting time on manual posting? This bot is for you. **What does it do?** It connects directly to MetaTrader 5 and automatically posts to Telegram & Discord: ️ Open trades ️ Closed trades ️ SL / TP levels ️ Profit and loss ️ Real-time signals **Advantages:** • Fully automated process • No delay – posts in real time • Perfect for signal groups and channels • Increases trust and transparency • Works
Mario Order Blocks
Sandeep Kumar Tiwary
Mario Order Block Indicator Overview The Professional Order Block Indicator is an advanced technical analysis tool that automatically identifies and displays institutional order blocks on your chart. Based on smart money concepts, this indicator helps traders identify high-probability support and resistance zones where institutional traders have placed significant orders. Key FeaturesAutomatic Order Block Detection Identifies bullish and bearish order blocks based on pivot point analysis Uses so
Reversal Pattern AI MT5
Stanislav Konin
5 (2)
Reversal Pattern AI — an absolute breakthrough in the world of indicator development, combining artificial intelligence algorithms, multi-level market analysis, and classical methods of technical analysis. It not only detects reversal patterns but also evaluates market inefficiencies, generating highly accurate trading signals. Thanks to a hybrid model that uses price action analysis, Volumes, Volatility, VWAP, and Volume AVG %, the indicator easily adapts to any market conditions.              
Smart SuperTrend Scalping Signals Pro is a MetaTrader 5 indicator designed for traders who want a clean visual trend-following system directly on the chart. Instead of displaying the traditional SuperTrend as a line, the indicator colors the actual price candles based on the current market condition. Green candles indicate bullish SuperTrend conditions, red candles indicate bearish SuperTrend conditions, and gray candles indicate sideways or weak-trend conditions. The indicator also includes a s
O Alpha B3 Renko Trader  é um robô especialista para negociação no Bovespa B3  (miniíndice e minidólar) que une a análise de candlesticks do gráfico Renko (calculado internamente, sem imagens gráficas) com a estratégia Alpha B3 . O robô permite configurar, para os sinais de entrada, o tamanho do brick do gráfico Renko, bem como um número de candlesticks para análise. Além disso, você deve configurar os stops fixos, em pontos. O robô permite também a configuração de funções, tais como número de c
GDS Renko Anatomy Free Renko Structure and Movement Anatomy Indicator for MetaTrader 5 GDS Renko Anatomy is a free MetaTrader 5 indicator for traders who use Renko charts and want a clearer way to understand how brick-based movement is built. The indicator helps visualize Renko movement anatomy: structure, legs, pullbacks, pauses, continuation areas and weakening movement phases. It does not give buy or sell signals. It does not predict price movement. It is a visual context tool for manual Renk
FREE
GDS Renko Pip ST Chart - Pip-Based Renko Chart Indicator for MetaTrader 5 GDS Renko Pip ST Chart is a pip-based Renko chart indicator for MetaTrader 5. It helps traders build and study cleaner Renko price movement using a practical fixed pip or point-based brick structure. This tool is designed as a Renko chart foundation for manual analysis. It does not predict the market, does not generate buy or sell signals and does not decide whether a trade should be opened. What Pip ST Chart Does Renko ch
FREE
HLC bar MT5 Wyckoff
Eduardo Da Costa Custodio Santos
創建 MT5 的指標“HLC_bar_MT5 Wyckoff”是為了方便交易時的分析。 HLC Bar 由 Richard Wyckoff 使用,目前廣泛用於“VSA”操作。 Wyckoff 發現使用 High、Low 和 Close 使圖表更清晰、更易於分析。 指標“HLC_bar_MT5 Wyckoff”允許: # 改變條寬; # 保持條形相同的顏色; # 並突出顯示以相同價格開盤和收盤的柱。 顏色和寬度很容易在設置中修改 要使用該指標,只需將其拖到圖表上即可。 當與成交量一起使用時,威科夫將 HLC 圖表稱為條形圖。 他們試圖隱藏這些信息多年,但現在每個人都可以訪問這些信息,並可以使用此類圖表改進他們的操作。 HLC bar MT5 Wyckoff Chart 可用於任何市場和任何圖表時間,使操作員更加舒適。
This indicator uses a mathematical calculation algorithm . This algorithm calculates the remainder between the updated model and the actual values and produces the possible progress of the graph on the graph. It is not a super prophet in trading, but it is very good for the trader when entering the market and to analyze it before entering. Applicable for all currencies. Данный индикатор использует алгоритм математических вычислений . Данный алгоритм вычисляет остаток между обновленной моделью и
Overview Cardwell Range Analyze reads the market through an RSI range regime, inspired by Andrew Cardwell's RSI rules, combined with a trend filter. It adds higher timeframe confirmation and an ADX filter to avoid weak, sideways markets. When momentum and trend agree, the indicator prints a Buy or Sell signal and draws a complete trade plan on the chart: Entry, Stop Loss and three Take Profit targets, with shaded risk and reward zones. A compact dashboard summarizes the market state at a glance.
FREE
See exactly how close your account is to your prop firm's daily-loss and max-drawdown floors - live, on the chart, with the real rule math of each firm. Most traders track their daily limit with mental math, and the daily-loss breach is the most common way evaluations end. Breach Radar draws the actual floors: - Daily-loss bar: the exact floor level, the dollar distance remaining, and the percent of today's budget already used - Max-drawdown bar: static or trailing (including trailing that loc
FREE
All about time and price by ICT. This indicator provides a comprehensive view of ICT killzones, Silver Bullet times, and ICT Macros, enhancing your trading experience.  In those time windows price either seeks liquidity or imbalances and you often find the most energetic price moves and turning points. Features: Automatic Adaptation: The ICT killzones intelligently adapt to the specific chart you are using. For Forex charts, it follows the ICT Forex times: In EST timezone: Session: Asia: 20h00-0
CCI Fixed Dual
Edoardo Centorame
什么是 CCI FIXED DUAL CCI FIXED DUAL 是一个专业级 Trend Direction Filter,旨在精准识别: 市场的主导方向 走势的结构质量 主趋势与加速阶段之间的一致性 它不是一个直接入场指标。 它不是一个传统振荡器。 它是一个市场环境工具,旨在帮助交易者决定何时交易以及何时不交易,从而大幅减少市场噪音和判断错误。 CCI FIXED DUAL 的基本理念 CCI FIXED DUAL 所基于的原则简单但强大: 一个信号只有在与市场结构一致时才有价值。 因此,该指标: 不使用单一数值 不会对价格做出冲动反应 不会刻意寻找反转点 而是建立在以下基础之上,构建出一种层级化的趋势解读: 基于 Typical Price 的 CCI 不同速度的 LWMA 移动平均线 短期 中期 和长期之间的动态比较 因此,其结果是对市场方向的一种稳定 干净 且可靠的表达。 指标的技术结构: CCI FIXED DUAL 由四个主要部分组成,全部显示在独立窗口中。 1 CCI magenta 线 这是指标的信息基础。 衡量典型价格的偏离程度 提供应用平滑处理的原始材料 它并不
Overview Partial Trailing Stop EA is an advanced trade management Expert Advisor for MetaTrader 5 that automatically locks in profits by performing partial position closures when price retraces from its maximum favorable movement (peak profit level) . Unlike a traditional trailing stop that closes the entire position, this EA allows you to scale out gradually. When the market moves in your favor, the EA continuously tracks the highest (for Buy trades) or lowest (for Sell trades) price reached. I
Auto Channel Trader
Ross Adam Langlands Nelson
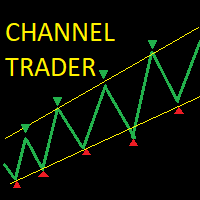
The Auto Channel Trader creates a channel by plotting a line along the high points and low points of the chart, the EA then makes long trades near the bottom of the channel and short trades near the top of the channel. The channel is created by finding high points for the top line and low points for the bottom line, these points are shown with arrows. A line of best fit is then plotted through these points and extended until the end of the chart.  The length of the channel is determined by the M
Trend Bands 5
Leonid Basis
Bands are a form of technical analysis that traders use to plot trend lines that are two standard deviations away from the simple moving average price of a security. The goal is to help a trader know when to enter or exit a position by identifying when an asset has been overbought or oversold. This indicator will show upper and lover bands. You can change input parameters nPeriod and  nMethod to calculate those bands for each timeframe. Aqua clouds represent up or down trends.
GDS Renko Ghost Free Renko Market Memory Visualization Indicator for MetaTrader 5 GDS Renko Ghost is a free MetaTrader 5 indicator for traders who use Renko charts and want to study how similar Renko structures behaved in the past. The indicator visualizes historical Renko memory: similar past structures, continuation paths, consensus behavior and uncertainty zones. It does not give buy or sell signals. It does not predict price movement. It is a visual research and context tool for manual Renko
FREE
该产品的买家也购买
Trade Assistant MT5
Evgeniy Kravchenko
4.43 (214)
它有助于计算每笔交易的风险,容易安装新的订单,具有部分关闭功能的订单管理, 7 种类型的追踪止损和其他有用的功能。   附加材料和说明 安装说明   -   应用程序说明   -   模拟账户应用程序的试用版 线条功能  - 在图表上显示开仓线、止损线、止盈线。 有了这个功能,就可以很容易地设置一个新的订单,并在开仓前看到它的附加特性。   风险管理  - 风险计算功能在考虑到设定的风险和止损单的大小的情况下,计算新订单的成交量。它允许你设置任何大小的止损,同时观察设定的风险。 批量计算按钮 - 启用 / 禁用风险计算。 在 " 风险 " 一栏中设置必要的风险值,从 0 到 100 的百分比或存款的货币。 在 " 设置 " 选项卡上选择风险计算的变量: $ 货币, % 余额, % 资产, % 自由保证金, % 自定义, %AB 前一天, %AB 前一周, %AB 前一个月。   R/TP 和 R/SL - 设置止盈和止损的关系。 这允许你设置相对于损失的利润大小。 例如, 1 : 1 - 这决定了 TP = SL 的大小。 2 : 1 - 这意味着 TP 是 SL 的两倍。 RR -
欢迎来到 Trade Manager EA——这是一个终极风险管理工具,旨在使交易变得更直观、精准和高效。它不仅仅是一个下单工具,而是一个用于无缝交易计划、仓位管理和风险控制的全面解决方案。不论您是新手交易员、资深交易员,还是需要快速执行的剥头皮交易员,Trade Manager EA 都可以满足您的需求,适用于外汇、指数、大宗商品、加密货币等各种市场。 借助 Trade Manager EA,复杂的计算已成过去。只需分析市场,在图表上用水平线标记入场、止损和止盈,设置您的风险水平,Trade Manager 就会立即计算出理想的头寸规模,并实时显示以点、账户货币计价的止损和止盈。每笔交易都得以轻松管理。 主要功能: 头寸规模计算器 :根据定义的风险瞬间确定交易规模。 简单的交易计划 :在图表上用可拖动的水平线直接计划交易,设置入场、止损和止盈。 实时显示 SL 和 TP :以账户货币、点或分显示止损和止盈,便于分析。 高级保护工具 盈亏平衡选项 : 基本盈亏平衡 :当您的交易达到设定水平时自动保护利润。 多级盈亏平衡 :设置多达 4 个级别以逐步保护利润。 尾随止损选项 : 基本尾随
Local Trade Copier EA MT5
Juvenille Emperor Limited
4.97 (143)
通过 Local Trade Copier EA MT5 获得非常快速的交易复制体验。它的简单1分钟设置,使您可以在同一台Windows计算机或Windows VPS上在多个MetaTrader终端之间复制交易,具有闪电般快速的复制速度,低于0.5秒。 无论您是初学者还是专业交易者, Local Trade Copier EA MT5 都提供了广泛的选项,可根据您的特定需求进行自定义。对于任何希望增加利润潜力的人来说,这都是终极解决方案。 今天就尝试一下,看看为什么它是市场上最快、最简单的贸易复印机! 提示: 您可以在您的模拟账户中下载并试用 Local Trade Copier EA MT5 模拟版: 这里 将下载的免费演示文件粘贴到您的 MT5 >> 文件 >> 打开数据文件夹 >> MQL5 >> 专家文件夹并重新启动您的终端。  免费演示版本每次可在 4 小时内发挥全部功能,仅限演示帐户。 要重置试用期,请转至 MT5 >> 工具 >> 全局变量 >> Control + A >> 删除。 请仅在非关键模拟账户上执行此操作,不要在挑战道具公司账户中执行此操作。 如果您无法
TradePanel MT5
Alfiya Fazylova
4.88 (162)
交易面板是一款多功能交易助手。该应用包含超过50种手动交易功能,并允许您自动执行大多数交易任务。 在购买之前,您可以在演示账户上测试演示版本。下载用于演示账户的试用版应用程序: https://www.mql5.com/zh/blogs/post/762579 。 完整说明 这里 。 贸易. 只需单击一下即可执行交易操作: 打開掛單和頭寸,並自動計算風險。 一鍵打開多個訂單和頭寸。 打開訂單網格。 按組別關閉掛單和頭寸。 反轉頭寸方向(關閉買入>打開賣出,關閉賣出>打開買入)。 鎖定頭寸(通過開啟缺少的頭寸,使買入和賣出頭寸的數量相等)。 一鍵部分關閉所有頭寸。 將所有頭寸的止盈和止損設置在同一價格水平。 將所有頭寸的止損設置在盈虧平衡水平。 開倉時,可使用以下功能: 在多個訂單或倉位之間分配計算出的數量(在單擊一次時開啟多個訂單和倉位)。 在開啟訂單前在圖表上可視化交易水平。 僅在當前點差不超過設定值時才開啟倉位。 止盈和止損之間的自動比例。 虛擬止損和止盈。 自動將止損和止盈的大小增加為當前點差的大小。 基於ATR指標讀數計算止盈和止損。 設置掛單的到期日期。 為掛單設置追蹤(掛單
测试版发布 Telegram to MT5 Signal Trader 即将进入正式的 Alpha 版本。一些功能仍在开发中,您可能会遇到一些小错误。如果您遇到问题,请反馈,您的意见将帮助我们改进软件。 Telegram to MT5 Signal Trader 是一款强大的工具,能够将 Telegram 频道或群组的交易信号自动复制到您的 MetaTrader 5 账户。 支持公开和私人频道,可将多个信号提供者连接至一个或多个 MT5 账户。软件优化、高效、稳定,精准控制每笔复制交易。 界面简洁,仪表盘美观,图表交互性佳,导航直观。您可以管理多个信号账户,自定义每个提供者的设置,并实时监控所有操作。 系统需求 由于 MQL 限制,EA 需要配合 PC 端应用与 Telegram 通信。 安装程序可通过官方 安装指南 获取。 核心功能 多提供者支持: 从多渠道复制信号至多个 MT5 帐户 高级信号识别: 关键词、模式和标签全面自定义 逐提供者控制: 可启用/禁用特定信号类型、平仓策略等 灵活风险管理: 固定手数、固定金额、余额/权益百分比、部分平仓设置 可定制 SL/TP: 覆盖信号
================================================================================ POC BREAKOUT - V20.72. Full Professional Grade Toolkit ================================================================================ POC Breakout is a full MetaTrader 5 trading dashboard for discretionary traders who want breakout signals, Point of Control (POC) context, volume profiles, order flow, market structure, news, alerts, and advanced trade planning in one professional workspace. Attached directly to you
Farmed Hedge Yield Farming | All Markets (Manual - Hybrid - Semi/Automated EA) MULTI-ASSET SUPPORT Trade any asset available on your broker - Forex: Major, Minor, Exotic pairs - Crypto: BTC, ETH, XRP, SOL, BNB - Stocks: Apple, Tesla, Amazon, Google, etc. - Commodities: Gold, Silver, Oil, Gas - Indices: US30, NAS100, SPX500, DAX40 - Any CFD your broker offers VERIFIED TRADING RESULTS - Farmed Hedge Yield Axi Copy:  https://www.mql5.com/en/signals/2356376 - Farmed Hedge Yield Exn Copy:   https:/
Exp COPYLOT CLIENT for MT5
Vladislav Andruschenko
3.97 (35)
适用于 MetaTrader 5 的专业交易复制器 快速、专业、稳定可靠的 交易复制器 ,适用于 MetaTrader 。 COPYLOT 可在 MT4 和 MT5 终端之间复制 Forex 交易,并支持 Hedge 和 Netting 账户。 COPYLOT 的 MT5 版本支持: - MT5 Hedge → MT5 Hedge - MT5 Hedge → MT5 Netting - MT5 Netting → MT5 Hedge - MT5 Netting → MT5 Netting - MT4 → MT5 Hedge - MT4 → MT5 Netting MT4 版本 完整说明 + DEMO + PDF 如何购买 如何安装 如何获取日志文件 如何测试和优化 Expforex 的所有产品 您也可以将交易复制到 MT4 终端(MT4 → MT4,MT5 → MT4): COPYLOT CLIENT for MT4 COPYLOT 是一款专业的交易和持仓复制器,可同时与 2、3 甚至 10 个终端协同工作。 支持从 模拟账户和投资者账户 复制,也支持同时在多个终端上运行。 您可以使
Trade copier MT5
Alfiya Fazylova
4.59 (49)
Trade Copier 是一种专业实用程序,旨在复制和同步交易账户之间的交易。 复制发生从供应商的帐户/终端到收件人的帐户/终端,安装在同一台计算机或 vps 上。 促销活动 - 如果您已经购买了“Trade copier MT5”,您可以免费获取“Trade copier MT4”(用于 MT4 > MT5 和 MT4 < MT5 的复制)。欲了解更多详细条款,请通过私人消息与我们联系! 在购买之前,您可以在演示帐户上测试演示版本。 演示 这里 。 完整说明 这里 。 主要功能和优点: 支持复制MT5>MT5、MT4>MT5、MT5>MT4,包括МТ5 netting账户。 供应商和收件人模式在同一产品中实现。 简单直观的界面,允许您直接从图表中实时控制复制。 连接中断或终端重新启动时不会丢失设置和位置。 允许您选择要复制的符号,也可以替换接收者的符号,例如 EURUSD> USDJPY。 支持回拷贝。 能够仅复制某些订单。 允许您设置开仓交易价格的最大差异和最大时间延迟。 正确复制部分订单关闭的执行。 计算复制手数的几种方法。 同步止盈和止损。有几种方法可以计算它们的位置。 支持

YuClusters
Yury Kulikov
4.93 (43)
Attention: You can view the program operation in the free version  YuClusters DEMO .  YuClusters is a professional market analysis system. The trader has unique opportunities to analyze the flow of orders, trade volumes, price movements using various charts, profiles, indicators, and graphical objects. YuClusters operates on data based on Time&Sales or ticks information, depending on what is available in the quotes of a financial instrument. YuClusters allows you to build graphs by combining da
Anchor Trade Manager
Kalinskie Gilliam
5 (5)
Anchor: The EA Manager Run your full EA portfolio without conflicts, without stacked risk, and without watching every chart yourself. Anchor coordinates up to 64 Expert Advisors on a single account, including daily loss protection built for prop firm rules. Attach Anchor to any chart. Type your EA names and magic numbers in one line. Click OK. Anchor begins coordinating immediately. Built for portfolios. Built for prop firms. Built for discipline. The Problem Running multiple EAs on the same acc
Footprint Chart Pro — Professional OrderFlow EA for MetaTrader 5 Version 6.34 | Professional tool for real traders | Institutional-Grade Visualization DEMO USERS - PLEASE SELECT EVERY TICK / REAL TICK WHEN TESTING AND YOU HAVE DOWNLOADED HISTORICAL DATA. IF YOU SEE A WAITING SCREEN AND IT IS NOT DOWNLOADING, IT MEANS YOU HAVE LOW HISTORICAL DATA. TRY 1 MIN AND 5 MIN FIRST ON 1 DAY DATA. ONE DAY DATA SHOULD BE THE NEWEST AND MOST CURRENT DATE. PLEASE WAIT UNTIL THE MARKET HAS ROLLED OVER PERIOD.
Trade Manager DaneTrades
Levi Dane Benjamin
4.28 (29)
交易管理器可帮助您快速进入和退出交易,同时自动计算风险。 包括帮助您防止过度交易、报复性交易和情绪化交易的功能。 交易可以自动管理,账户绩效指标可以在图表中可视化。 这些功能使该面板成为所有手动交易者的理想选择,并有助于增强 MetaTrader 5 平台。多语言支持。 MT4版本  |  用户指南+演示 交易经理在策略测试器中不起作用。 如需演示,请参阅用户指南 风险管理 根据%或$自动调整风险 可选择使用固定手数或根据交易量和点自动计算手数 使用 RR、点数或价格设置盈亏平衡止损 追踪止损设置 最大每日损失百分比,在达到目标时自动平仓所有交易。 保护账户免遭过多提款并阻止您过度交易 最大每日损失(以美元为单位)在达到目标时自动关闭所有交易。 保护账户免遭过多提款并阻止您过度交易 一键实现所有交易的盈亏平衡 自动计算从手机/电话发送的交易的风险 OCO 在设置中可用 交易和头寸管理 通过设置每月、每周、每天、每小时或每分钟的最大交易次数,停止过度交易和报复性交易。 高级挂单管理。 调整何时关闭挂单的规则 追踪挂单 支持市价订单和挂单 每日最大利润目标(以美元为单位)以确保头寸并停止
Welcome to ENTRY IN THE ZONE WITH SMC MULTI TIMEFRAME Entry In The Zone with  SMC Multi Timeframe  is a professional trading indicator built on Smart Money Concepts (SMC), combining market structure analysis with a No Repaint BUY / SELL signal system in a single indicator. It helps traders understand market structure more clearly, identify key price zones, and focus on higher-quality trading opportunities. By combining Multi-Timeframe Analysis, Points of Interest (POIs), and real-time signals, t
Telegram to MT5 Multi-Channel Copier 可自动将您 Telegram 频道中的交易信号直接复制到 MetaTrader 5。无需机器人,无需浏览器扩展,无需手动复制。您在 Telegram 上收到信号,EA 会在几秒钟内在您的终端上开仓。 本产品包含两个组件:一个监听您 Telegram 频道的 Windows 应用程序,以及在您的 MT5 终端上执行信号的 EA。同时也提供 MT4 版本。 设置指南和应用程序下载: https://www.mql5.com/en/blogs/post/768988 工作原理 Windows 应用程序使用您自己的 API 凭据连接到 Telegram,而不是机器人。这意味着它可以读取您订阅的任何频道、群组或话题,包括私人和 VIP 频道。检测到信号后,它会进行解析并发送给 EA。EA 根据您的经纪商解析交易品种名称,基于您的风险设置计算手数,然后开仓。 整个过程都是自动的。您无需守在电脑前。 打开应用程序并登录 Telegram(仅第一次)。 选择要监听的频道或话题。 按下 Start。EA 会处理其余的一切。 支持的
EA Auditor
Stephen J Martret
5 (4)
EA Auditor is an independent analysis tool for traders evaluating Expert Advisors and trading signals on MetaTrader 5. It audits backtest reports, reviews posted developer signals, and cross-verifies the two against each other to help traders assess strategies before committing capital. The MQL5 market offers a wide range of Expert Advisors from many developers, with varying approaches, quality, and transparency. EA Auditor provides a consistent, data-driven framework for reviewing them, answer
Seconds Chart MT5
Boris Sedov
4.61 (18)
秒级图表 (Seconds Chart) - 一款专为 MetaTrader 5 设计的独特工具,用于创建秒级时间框架的图表。 通过 秒级图表 ,您可以构建以秒为单位的时间框架图表,获得标准分钟或小时图表无法提供的极致灵活性和分析精度。例如,时间框架 S15 表示每根蜡烛图持续15秒。您可以使用任何支持自定义交易品种的指标和EA交易系统。操作它们就像在标准图表上交易一样方便。 与标准工具不同, 秒级图表 让您能够在超短时间框架下进行高精度交易,无延迟干扰。 免费演示版: Seconds Chart v2.29 Demo.ex5 下载免费演示版,亲自体验: 功能齐全 - 所有功能均可使用 24小时测试 - 足够评估准确性和便利性 仅限模拟账户 - 大多数经纪商均可轻松开立 仅限GBPCAD图表 - 大多数终端均可使用 这些限制仅适用于演示版。完整版适用于任何账户类型(真实、演示、竞赛)和任何图表(XAUUSD、EURUSD 等),无任何限制。 如何安装演示版 通过上方链接下载演示文件 打开MetaTrader -> 文件 -> 打开数据文件夹 -> MQL5 -> Experts 将下
MetaTrader 5 专业交易面板 —— 图表与键盘一键交易的高效控制中心 一款面向主动交易者的专业 Trading Panel,可让您比标准 MetaTrader 操作方式更快、更直观地完成开仓、平仓、修改、管理与控制。 这不是一个普通的小工具,而是一个为高频手动操作、仓位管理、挂单控制与利润管理而设计的完整交易工作台。 通过这套面板,您可以直接在图表上一键执行交易,通过键盘快速触发核心操作,并借助自动参数计算、图形提示、信息标签以及可视化管理功能,大幅减少重复性操作,让整个交易流程更加流畅、高效且专业。 使用我们的交易面板,您可以直接从图表上一键下单,执行交易操作的速度可比标准 MetaTrader 控件快约 30 倍。 全新高级版本现已推出: 使用 VirtualTradePad PRO SE 升级您的交易流程 — 适用于 MetaTrader 5 和 MetaTrader 4 的新一代专业交易面板。 MT4 版本 | 完整说明 + DEMO + PDF | 如何购买 | 如何安装 | 如何获取日志文件 | 如何测试与优化 | Expforex 的所有产品 为什么交易者会
Trade Dashboard MT5
Fatemeh Ameri
4.95 (131)
疲于复杂的订单下达和手动计算?Trade Dashboard 是您的解决方案。凭借其用户友好的界面,订单下达变得轻而易举,只需点击一下,您就可以开设交易、设置止损和止盈水平、管理交易手数,并计算风险回报比,让您只需专注于您的策略。告别手动计算,使用 Trade Dashboard 简化您的交易体验。 立即下载演示版本 。 您可以在这里找到仪表盘功能和特性的详细信息 。 加入 Telegram 频道 。 购买后请给我发消息以获取支持。如果您需要添加更多功能,可以在产品的评论区留下您的想法,我愿意听取任何建议,希望您能在使用我的产品时获得最佳体验 。 这是 MT4 版本。 风险管理:使用 Trade Dashboard,可以将您的风险设置为账户余额或权益的百分比,或将风险设置为总金额。在图表上直观地定义您的止损,让工具准确计算每个货币对的适当手数。该工具还可以根据您期望的风险回报比自动设置止盈水平。它甚至可以在手数计算中涵盖佣金和点差费用。此外,您的止损和止盈可以转变为虚拟水平,隐藏于经纪商。通过 Trade Dashboard 的高级风险管理功能,掌控风险,保护您的资本。 交易线
EasyInsight AIO MT5
Alain Verleyen
4.92 (12)
EASY Insight AIO – 全能智能交易一站式解决方案 概述 想象一下,您可以在几秒钟内扫描整个市场——外汇、黄金、加密货币、指数,甚至股票——无需手动筛选图表、繁琐安装或配置指标。 EASY Insight AIO 是您专为 AI 交易打造的即装即用数据导出工具。它将整个市场快照一次性输出为简洁的 CSV 文件,直接支持 ChatGPT、Claude、Gemini、Perplexity 等各类 AI 平台的即时分析。 无需窗口切换,无需图表叠加,也没有任何杂乱。只需纯净、结构化的数据自动导出,让您专注于基于数据的高效决策,无需再盯盘耗时。 为什么选择 EASY Insight AIO? 真正的一体化 • 无需设置,无需安装指标,无图表叠加。只需安装、运行并导出——就是这么简单。 多资产全覆盖 • 扫描分析外汇、金属、加密货币、指数、股票——您的券商所能提供的一切市场。 AI 专属数据导出 • 高度结构化、针对 AI 优化的 CSV 文件,直接适配主流智能工具和平台。 完整导出内容: • 三个可选周期的货币强度分析 • 净多头头寸变化体现市场情绪 • 成交量变化、
HINN Lazy Trader
ALGOFLOW OÜ
5 (1)
LIMITED SUMMER SALE -40% ! ONLY $470 insead of $790!  Maximum real discount! ONLY UNTIL 08/22 The core idea: using the user interface, you configure the parameters the chart must meet before entering a position (or positions), choose which entry models to use, and set the rules for when trading and planning should end. Lazy Trader  handles the rest: it  takes over all the routine chart watching and execution! full description  :: 3 key videos [1] ->  [2]   ->  [3] What can it do? - Understand
Quant AI Agents
Ho Tuan Thang
5 (1)
Quant AI Agents are independent trading Expert Advisors. Instead of trading using a fixed strategy like other conventional EAs, Quant AI Agents   is a   multi-agent AI trading framework   that turns natural-language strategy prompts into live.  WANT THE SAME RESULTS AS MY LIVE SIGNAL?   Use the exact same brokers I do:   IC MARKETS , IC TRADING   .  Unlike the centralized stock market, Forex has no single, unified price feed.  Every broker sources liquidity from different providers, creating un
FUTURES ORDERFLOW FOOTPRINT CHART Professional OrderFlow EA for MetaTrader 5 Version 1.01| Professional tool for real traders | Institutional-Grade Visualization STRATEGY TESTER USERS - PLEASE SELECT EVERY REAL TICK WHEN TESTING AND YOU HAVE DOWNLOADED HISTORICAL DATA. IF YOU SEE A WAITING SCREEN AND IT IS NOT DOWNLOADING, IT MEANS YOU HAVE LOW HISTORICAL DATA. TRY 1 MIN AND 5 MIN FIRST ON 1 DAY DATA. ONE DAY DATA SHOULD BE THE NEWEST AND MOST CURRENT DATE. PLEASE WAIT UNTIL THE MARKET HAS ROL
The product will copy all telegram signal to MT5 ( which you are member) , also it can work as remote copier.  Easy to set up, copy order instant, can work with almost signal formats, image signal,  s upport to translate other language to English Work with all type of channel or group, even channel have "Restrict Saving Content", work with  multi channel, multi MT5 Work as remote copier: with signal have ticket number, it will copy exactly via ticket number. Support to backtest signal. How to s
Timeless Charts
Samuel Manoel De Souza
5 (7)
Timeless Charts is an all-in-one trading utility for professional traders. It combines custom chart types such as Seconds Charts and Renko with advanced order flow analysis using Footprints , Clusters , Volume Profiles , VWAP studies, and anchored analysis tools for deeper market insight. Trading and position management are handled directly from the chart through an integrated trade management panel , while Market Replay and Virtual Accounts provide environments for practicing trading skills and
ManHedger MT5
Peter Mueller
4.83 (6)
THIS EA IS A SEMI-AUTO EA, IT NEEDS USER INPUT. Manual & Test Version Please TEST this product before BUYING  and watch my video about it. The price of the ManHedger will increase to 250$ after 20 copies sold. Contact me for user support or bug reports or if you want the MT4 version! MT4 Version  I do not guarantee any profits or financial success using this EA. With this Expert Advisor, you can: Implement your own Zone Recovery strategy to capitalize on trending markets. Create Grid trading s
The News Filter MT5
Leolouiski Gan
4.78 (23)
这个产品在新闻时间过滤所有的专家顾问和手动图表,因此您不必担心突然的价格波动会破坏您的手动交易设置或其他专家顾问输入的交易。此产品还带有完整的订单管理系统,可在任何新闻发布前处理您的持仓和挂单。一旦您购买了   The News Filter ,您将不再需要依赖以后的专家顾问内置的新闻过滤器,因为这个产品可以从此过滤它们所有。 新闻选择 新闻来源于Forex Factory的经济日历。 选择可以基于任何一种货币,如USD,EUR,GBP,JPY,AUD,CAD,CHF,NZD和CNY等。 选择也可以基于关键识别,例如Non-Farm (NFP),FOMC,CPI等。 能够选择新闻影响级别的筛选,从低、中、到高影响。 自动模式只选择与图表相关的新闻。 新闻来源每小时自动刷新,以确保最新的新闻数据。 为每个新闻影响级别提供单独的输入,以确定您要过滤掉的新闻发布前后的分钟数。 订单管理选项 在新闻发布前关闭未平仓头寸的选项,并在新闻发布后恢复它们。 在新闻发布前删除挂单的选项,并在新闻发布后恢复它们。 在新闻发布前移除止损和止盈水平的选项,并在新闻发布后恢复它们。 在新闻发布前移动止损和
Equity Protect Pro:全方位账户保护专家,让您的交易更安心 如果您正在寻找账户保护、净值保护、投资组合保护、多策略保护、利润保护、利润收割、交易安全、风控程序、自动风控、自动清仓、条件清仓、定时清仓、动态清仓、跟踪止损、一键关闭、一键清仓、一键还原等功能,Equity Protect Pro 就是您要找的程序。 它配置简单,当到达预设条件时,可关闭所有图表,同时支持关闭信号订阅(这意味着所有交易程序也将停止运行)。此时,将不再有新订单产生,最后再关闭所有订单,有效防止意外损失,让您在交易过程中高枕无忧。 Equity Protect Pro (Technical Manual) Equity Protect Pro Demo Version for yo u to test   Equity Protect Pro MT4 Demo.ex4        Equity Protect Pro MT5 Demo.ex5 Equity Protect Pro 拥有 14 个核心功能,它们都是独立运行的。您可以根据您的交易策略,选择合适的功能组合使用。这些功能默认为关闭状态,
Trader Evolution
Siarhei Vashchylka
5 (7)
" Trader Evolution " - A utility designed for traders who use wave and technical analysis in their work. One tab of the utility is capable of money management and opening orders, and the other can help in making Elliott wave and technical analysis. Manual (Be sure to read before purchasing) | Version for MT4 Advantages 1. Trading in a few clicks. Immediate and pending orders are available in the panel 2. Money management. The program automatically selects the appropriate lot size 3. Simplifies
EA Performance Tracker
Russell Leeon Tan
5 (3)
EA Performance Tracker (AESTracker) A clean, modern dashboard that shows exactly how your trades and EAs are performing — right on your chart. It reads your full account history automatically and breaks down the numbers by magic number / strategy. Display only — it does not place any trades. What it shows - Account header: live Balance, Equity, and Open (floating) P/L - Profit summary: gross profit, net profit, and the exact commission & swap deducted - Key stats: win rate, profit factor, exp
作者的更多信息
ACB Breakout Arrows MT5
KEENBASE SOFTWARE SOLUTIONS
3.5 (2)
ACB Breakout Arrows 指标通过检测特殊的突破形态,提供市场中的关键入场信号。该指标持续扫描图表中的价格动量,在价格出现重大变动前,提前提供精确的入场信号。 点击此处获取多品种多周期扫描器 - ACB Breakout Arrows MT5 扫描器 主要特点 指标自动提供止损和止盈价格。 内置多周期扫描仪仪表盘,可追踪所有时间周期的突破信号。 适用于日内交易者、波段交易者和剥头皮交易者。 优化算法提升信号精度。 特别设置的快速盈利线用于无亏损移动或短线目标。 支持胜率、盈亏比、平均利润等绩效分析指标。 无重绘,信号可靠。 交易确认 - 可使用 ACB Trade Filter 指标 来过滤低概率的交易信号。 强烈买入: 向上箭头 + 绿色柱状图 + 多头趋势。 强烈卖出: 向下箭头 + 红色柱状图 + 空头趋势。 当柱状图为灰色且趋势为震荡时,应避免交易。 (可选) -  使用  KT 支撑阻力水平指标  避免在重要支撑/阻力位附近入场。这类交易可能迅速变成亏损。 “一个成功交易者的目标是做出最好的交易。金钱只是附属。” —— 亚历山大·埃尔德 输入参数 历史
KT Support and Resistance Levels MT5
KEENBASE SOFTWARE SOLUTIONS
5 (1)
KT Auto Support Resistance Levels:适用于 MetaTrader 4/5 的多周期支撑阻力、智能区域与水平仪表盘 摆动高点、Pivot 枢轴点、订单块、前期高低点。每个交易者标记市场的方式都不太一样,最后承受代价的往往是图表本身。把太多方法堆在同一张图上,它就不再是一张清晰的地图,而会变成噪音。 KT Auto Support Resistance Levels 正是为了解决这个问题而设计。它会同时扫描月线、周线、日线以及当前周期,然后自动把真正重要的水平直接绘制到您的 MetaTrader 图表上。当图表开始变得拥挤时,只需点击一次,就可以把这些水平合并成干净的 Smart Zones。实时面板还会持续显示价格上方和下方最近的水平,让您不必在图表上来回寻找。 可以把它看作一位永远不会疲惫的图表分析师,始终帮您标记关键位置。 它能为您做什么 从多个经过验证的来源寻找并绘制水平:摆动点、Pivot 枢轴点、前期价格以及订单块中点,覆盖多个时间周期。 当您想要更简洁的图表时,可以把彼此接近的水平合并成清晰的 Smart Zones。 保持一个实时面板,显示
KT Support and Resistance Levels
KEENBASE SOFTWARE SOLUTIONS
KT Auto Support Resistance Levels:适用于 MetaTrader 4/5 的多周期支撑阻力、智能区域与水平仪表盘 摆动高点、Pivot 枢轴点、订单块、前期高低点。每个交易者标记市场的方式都不太一样,最后承受代价的往往是图表本身。把太多方法堆在同一张图上,它就不再是一张清晰的地图,而会变成噪音。 KT Auto Support Resistance Levels 正是为了解决这个问题而设计。它会同时扫描月线、周线、日线以及当前周期,然后自动把真正重要的水平直接绘制到您的 MetaTrader 图表上。当图表开始变得拥挤时,只需点击一次,就可以把这些水平合并成干净的 Smart Zones。实时面板还会持续显示价格上方和下方最近的水平,让您不必在图表上来回寻找。 可以把它看作一位永远不会疲惫的图表分析师,始终帮您标记关键位置。 它能为您做什么 从多个经过验证的来源寻找并绘制水平:摆动点、Pivot 枢轴点、前期价格以及订单块中点,覆盖多个时间周期。 当您想要更简洁的图表时,可以把彼此接近的水平合并成清晰的 Smart Zones。 保持一个实时面板,显示
ACB Trade Filter MT5
KEENBASE SOFTWARE SOLUTIONS
ACB Trade Filter indicator provides a way to filtering out the low probability trading entries in a trading strategy. The indicator uses a sophisticated filtration algorithm based on the market sentiment and trend. The MT4 version of the same indicator is available here ACB Trade Filter MT4 Applications Works great with our indicator ACB Breakout Arrows MT5 Filter out low probability signals from any indicator. Avoid over-trading and minimize the losses. Trade in the direction of market sentime
KT Auto Fibo MT5
KEENBASE SOFTWARE SOLUTIONS
5 (1)
KT Auto Fibo根据当前的趋势方向自动绘制斐波那契回撤水平。最高点和最低点是根据图表上可用的最大值和最小值自动选择的。您可以通过缩放和滚动图表来相应地调整斐波那契水平。 模式 自动:  根据图表区域自动绘制斐波那契水平。 手动: 仅绘制一次斐波那契水平,之后您可以手动调整锚点。 使用方法: 帮助您合理预测未来的获利目标。 结合支撑/阻力位或趋势线使用时,具有较强的反转可能性。 在趋势市场中提供低风险的入场机会。 输入参数 自动:  无需人为干预即可绘制斐波那契回撤水平。 手动:  仅绘制一次斐波那契回撤水平,之后可以手动拉伸锚点。 显示未回撤区域: 在图表上显示或隐藏尚未被价格回撤触及的区域。 其余输入项为直观设置,无需额外解释。
FREE
如果您进行外汇交易,了解货币强弱和货币对相关性等详细信息,可以让您的交易更上一层楼。通过相关性分析,您可以将风险减半,而强弱分析将帮助您最大化利润。 本指标通过结合货币强弱分析和货币对相关性,提供了一种混合的方法,帮助选择最合适的货币对进行交易。 如何使用货币强弱分析 假设您的交易策略在AUD/JPY上提供了买入机会,但通过KT货币强弱分析发现JPY比AUD更强。那么,这笔交易很可能以亏损告终。有了这个指标,您可以轻松避免此类亏损。 如何使用货币对相关性 假设您的交易策略同时在NZD/USD和GBP/JPY上提供了卖出机会。通过KT货币对相关性功能,您发现这两个货币对的相关性达到77%。  由于这些货币对高度相关,同时交易它们只会加倍您的风险。如果在NZD/USD上出现亏损,GBP/JPY上的交易也很有可能出现亏损。 功能特点 快速识别最强和最弱货币,用以验证交易策略生成的交易机会。 通过避免交易高度相关的货币对,将风险降低一半甚至三分之一。 当某个货币成为最强或最弱时,接收警报通知。 通过货币金字塔分析强弱报告,将货币按强到弱进行排序。 详细了解货币强弱分析 货币强弱分析通
KT Heiken Ashi Smoothed MT4
KEENBASE SOFTWARE SOLUTIONS
KT Heiken Ashi Smoothed 是标准 Heiken Ashi 的平滑版本,同时在趋势反转处绘制买卖箭头,方便即时捕捉信号。凭借这种直观而即时的可视化,交易者能在快节奏的市场中快速做出判断。 当状态由空头转为多头时绘制买入箭头。 当状态由多头转为空头时绘制卖出箭头。 支持手机推送、邮件、声音与弹窗等多通道提醒,确保第一时间获知变动。 Heiken Ashi Smoothed 究竟是什么? 它通过双移动平均对标准 Heiken Ashi 进行二次平滑,过滤虚假信号与噪声。尽管会带来些许滞后,但能清晰揭示摆动点与新兴趋势,让原本肉眼难以分辨的价格动态变得一目了然。利用这些信息,交易者可相应地优化进出场、调整仓位、完善风控,以在外汇、商品乃至指数市场中把握先机。 应用场景 该指标适用于外汇、商品和股票等多种市场。以下五种核心用法可以帮助寻找交易机会和确认行情: 纯蓝色蜡烛且无下影线:显示强劲上升趋势。 纯红色蜡烛且无上影线:显示强劲下降趋势。 趋势拐点常伴随实体极小、上下影线较长的蜡烛,可视为转势信号。
KT Trend Magic MT5
KEENBASE SOFTWARE SOLUTIONS
KT Trend Magic shows the trend depiction on chart using the combination of market momentum and volatility. A smoothing coefficient is used to smooth out the noise from the signal.It can be used to find out the new entries or confirm the trades produced by other EA or indicator. Features Drag n drop MTF scanner which scans for the new signals across multiple time-frames. Find new entries in the trend direction. Improve the accuracy of other indicators when used in conjunction. Can be used as a d
FREE
KT MA Crossover MT5
KEENBASE SOFTWARE SOLUTIONS
KT MA Crossover 指标根据所选的移动平均线交叉绘制买入和卖出箭头。此外,它还会生成相应的提醒通知,并为每个连续信号显示 MFE(最大有利偏移)值,帮助交易者更好地了解潜在利润区域。 移动平均交叉策略是全球交易者广泛采用的一种经典技术分析方法。通常包含一条快速和一条慢速的移动平均线,根据交叉的方向来确定买入或卖出的交易信号。 买入信号 - 快速均线向上穿越慢速均线。 卖出信号 - 快速均线向下穿越慢速均线。 功能特点 每项均线参数都可完全自定义设置。 每个连续信号都会显示对应的 MFE 值。 代码轻量,占用系统资源极少。 包含所有 MetaTrader 系统提示和警报。 缺点  移动平均线是一种滞后性指标,主要依赖历史数据。在盘整行情中,均线交叉信号可能显得较为随机,容易产生假信号。因此,交易者在实际应用中需要根据自身判断灵活处理这些信号。 输入参数 历史K线数量:  用于计算信号的历史K线数量。 ----- 选择用于计算快慢移动平均的周期和方法 ----- 显示均线:  在图表上显示或隐藏移动平均线(不影响交叉信号)。 绘制利润线: 显示或隐藏 MFE 曲线。 
FREE
KT Pin Bar MT5
KEENBASE SOFTWARE SOLUTIONS
KT Pin Bar identifies the pin bar formation which is a type of price action pattern which depicts a sign of reversal or rejection of the trend. When combined with support and resistance, BRN and other significant levels, Pin Bar pattern proved to be a very strong sign of reversal. Basically, a pin bar is characterized by a small body relative to the bar length which is closed either in upper or lower 50% part of its length. They have very large wicks and small candle body. A pin bar candlestic
FREE
ACB Trade Filter MT4
KEENBASE SOFTWARE SOLUTIONS
5 (1)
The ACB Trade Filter indicator provides a solution for filtering out the low probability trading setups in a trading strategy. The indicator uses a sophisticated filtration algorithm based on the market sentiment and trend. Applications Works great with our indicator " ACB Breakout Arrows ". Filter out low probability signals from any indicator. Avoid overtrading and minimize the losses. Trade in the direction of market sentiment and trend. Avoid the choppiness in the market. How to use Only L
KT Volatility Oscillator MT5
KEENBASE SOFTWARE SOLUTIONS
KT波动率振荡器通过数学公式分析过去和当前的市场数据,以振荡器的形式显示结果。振荡器中波浪的增长和减弱分别对应于资产的高波动性和低波动性。  简单来说,波动率就是衡量资产在一定时间内价格波动幅度的指标。没有波动性,市场上的价格变化将非常有限,交易者也将难以从价格波动中获利。 外汇市场中波动率的应用 在外汇市场中利用波动率,可以帮助你更有效地进行交易,同时让你的预期更加符合实际情况。  高波动性 基于趋势的交易系统在高波动市场中表现出色,因为价格波动幅度大,趋势持续时间长,直到出现趋势反转。 如果突破发生在高波动期间,突破系统可以从市场中获得更多的点数收益。 低波动性 均值回归系统在低波动性环境下表现良好,因为市场有回归均值的特性。 基于通道的系统在市场盘整期,即低波动阶段,能够更加有效地发挥作用。 非方向性指标 KT波动率振荡器是一种非方向性指标,不与市场的牛市或熊市趋势直接相关。波动性的上升可能出现在牛市或熊市两种情形下。  输入参数 波动率周期:   一个整数值,用于设定计算的周期。 文本信息:   在图表上显示或隐藏信息文本。 ----- 警报设置 ----- 声音警报
FREE
KT Auto Fibo
KEENBASE SOFTWARE SOLUTIONS
KT Auto Fibo根据当前的趋势方向自动绘制斐波那契回撤水平。最高点和最低点是根据图表上可用的最大值和最小值自动选择的。您可以通过缩放和滚动图表来相应地调整斐波那契水平。 模式 自动:  根据图表区域自动绘制斐波那契水平。 手动: 仅绘制一次斐波那契水平,之后您可以手动调整锚点。 使用方法: 帮助您合理预测未来的获利目标。 结合支撑/阻力位或趋势线使用时,具有较强的反转可能性。 在趋势市场中提供低风险的入场机会。 输入参数 自动:  无需人为干预即可绘制斐波那契回撤水平。 手动:  仅绘制一次斐波那契回撤水平,之后可以手动拉伸锚点。 显示未回撤区域: 在图表上显示或隐藏尚未被价格回撤触及的区域。 其余输入项为直观设置,无需额外解释。
FREE
KT Heiken Ashi Smoothed MT5
KEENBASE SOFTWARE SOLUTIONS
KT Heiken Ashi Smoothed 是标准 Heiken Ashi 的平滑版本,同时在趋势反转处绘制买卖箭头,方便即时捕捉信号。凭借这种直观而即时的可视化,交易者能在快节奏的市场中快速做出判断。 当状态由空头转为多头时绘制买入箭头。 当状态由多头转为空头时绘制卖出箭头。 支持手机推送、邮件、声音与弹窗等多通道提醒,确保第一时间获知变动。 Heiken Ashi Smoothed 究竟是什么? 它通过双移动平均对标准 Heiken Ashi 进行二次平滑,过滤虚假信号与噪声。尽管会带来些许滞后,但能清晰揭示摆动点与新兴趋势,让原本肉眼难以分辨的价格动态变得一目了然。利用这些信息,交易者可相应地优化进出场、调整仓位、完善风控,以在外汇、商品乃至指数市场中把握先机。 应用场景 该指标适用于外汇、商品和股票等多种市场。以下五种核心用法可以帮助寻找交易机会和确认行情: 纯蓝色蜡烛且无下影线:显示强劲上升趋势。 纯红色蜡烛且无上影线:显示强劲下降趋势。 趋势拐点常伴随实体极小、上下影线较长的蜡烛,可视为转势信号。
KT Trend Magic
KEENBASE SOFTWARE SOLUTIONS
KT Trend Magic shows the trend depiction on chart using the combination of market momentum and volatility. A smoothing coefficient is used to smooth out the noise from the signal.It can be used to find out the new entries or confirm the trades produced by other EA/Indicators. Usage Drag n drop MTF scanner which scans for the new signals across multiple time-frames. Find new entries in the trend direction. Improve the accuracy of other indicators when used in conjunction. Can be used as a dynami
FREE
KT Round Numbers MT5
KEENBASE SOFTWARE SOLUTIONS
KT Round Numbers plots the round number levels which are also commonly known as psychological levels in the Forex world. In the context of Forex trading, round number levels are those levels in which there are two or more zeroes at the end. They are named as 00 levels on the chart. Some traders also consider the halfway points as a valid round number level. They are named as 50 levels on the chart. Use of round number levels in trading Round number levels work as strong support and resistance
FREE
KT Volatility Oscillator
KEENBASE SOFTWARE SOLUTIONS
KT波动率振荡器通过数学公式分析过去和当前的市场数据,以振荡器的形式显示结果。振荡器中波浪的增长和减弱分别对应于资产的高波动性和低波动性。  简单来说,波动率就是衡量资产在一定时间内价格波动幅度的指标。没有波动性,市场上的价格变化将非常有限,交易者也将难以从价格波动中获利。 外汇市场中波动率的应用 在外汇市场中利用波动率,可以帮助你更有效地进行交易,同时让你的预期更加符合实际情况。  高波动性 基于趋势的交易系统在高波动市场中表现出色,因为价格波动幅度大,趋势持续时间长,直到出现趋势反转。 如果突破发生在高波动期间,突破系统可以从市场中获得更多的点数收益。 低波动性 均值回归系统在低波动性环境下表现良好,因为市场有回归均值的特性。 基于通道的系统在市场盘整期,即低波动阶段,能够更加有效地发挥作用。 非方向性指标 KT波动率振荡器是一种非方向性指标,不与市场的牛市或熊市趋势直接相关。波动性的上升可能出现在牛市或熊市两种情形下。  输入参数 波动率周期:   一个整数值,用于设定计算的周期。 文本信息:   在图表上显示或隐藏信息文本。 ----- 警报设置 ----- 声音警报
FREE
KT Pin Bar
KEENBASE SOFTWARE SOLUTIONS
KT Pin Bar identifies the pin bar formation which is a type of price action pattern which depicts a sign of reversal or rejection of the trend. When combined with support and resistance, BRN and other significant levels, Pin Bar pattern proved to be a very strong sign of reversal. Basically, a pin bar is characterized by a small body relative to the bar length which is closed either in upper or lower 50% part of its length. They have very large wicks and small candle body. A pin bar candlestic
FREE
KT MA Crossover MT4
KEENBASE SOFTWARE SOLUTIONS
KT MA Crossover 指标根据所选的移动平均线交叉绘制买入和卖出箭头。此外,它还会生成相应的提醒通知,并为每个连续信号显示 MFE(最大有利偏移)值,帮助交易者更好地了解潜在利润区域。 移动平均交叉策略是全球交易者广泛采用的一种经典技术分析方法。通常包含一条快速和一条慢速的移动平均线,根据交叉的方向来确定买入或卖出的交易信号。 买入信号 - 快速均线向上穿越慢速均线。 卖出信号 - 快速均线向下穿越慢速均线。 功能特点 每项均线参数都可完全自定义设置。 每个连续信号都会显示对应的 MFE 值。 代码轻量,占用系统资源极少。 包含所有 MetaTrader 系统提示和警报。 缺点  移动平均线是一种滞后性指标,主要依赖历史数据。在盘整行情中,均线交叉信号可能显得较为随机,容易产生假信号。因此,交易者在实际应用中需要根据自身判断灵活处理这些信号。 输入参数 历史K线数量:  用于计算信号的历史K线数量。 ----- 选择用于计算快慢移动平均的周期和方法 ----- 显示均线:  在图表上显示或隐藏移动平均线(不影响交叉信号)。 绘制利润线: 显示或隐藏 MFE 曲线。 
FREE
KT Round Numbers MT4
KEENBASE SOFTWARE SOLUTIONS
KT Round Numbers plots the round number levels which are also commonly known as psychological levels in the Forex world. In the context of Forex trading, round number levels are those levels in which there are two or more zeroes at the end. They are named as 00 levels on the chart. Some traders also consider the halfway points as a valid round number level. They are named as 50 levels on the chart. Use of round number levels in trading Round number levels work as strong support and resistance
FREE
ACB Breakout Arrows
KEENBASE SOFTWARE SOLUTIONS
4.15 (34)
ACB Breakout Arrows 指标通过识别一种特殊的突破形态,为交易者提供关键的入场信号。该指标持续扫描图表中某一方向上趋于稳定的动能,并在主要行情启动之前给出准确的进场信号。  点击此处获取多品种、多周期扫描仪 - ACB Breakout Arrows MT4 专用扫描仪 主要功能 指标自动提供止损和止盈位置。 配备 MTF 多周期扫描仪面板,可跟踪所有时间周期的突破信号。 适用于日内交易者、波段交易者和剥头皮交易者。 采用优化算法,提高信号准确性。 提供特殊目标线,用于设置快速平仓点或无损平移位(Quick Profit Line)。 包括胜率、成功率、平均收益等表现分析指标。 不重绘,信号一旦出现即保持不变。 交易确认 -  建议结合使用 ACB Trade Filter 指标 以过滤低质量信号。 强买入: 上箭头 + 绿色柱状图 + 多头趋势。 强卖出: 下箭头 + 红色柱状图 + 空头趋势。 避免交易 :当柱状图为灰色且趋势为震荡时。 (可选) -  建议使用 KT  支撑与阻力位指标  来避免在关键支撑/阻力区域附近开仓。此类交易可能迅速转为亏损,造成不必
KT Momentum Arrows
KEENBASE SOFTWARE SOLUTIONS
KT Momentum Arrows 指标基于瞬时突破计算,它结合了价格波动方向中的带宽偏离和新兴波动率。这是一种对动量变化反应灵敏的技术指标,适合在趋势开始阶段发出交易信号。 当价格收于上轨之上时,生成买入信号;当价格收于下轨之下时,生成卖出信号。 该指标使用一个“幅度系数”作为输入参数,同时影响带宽偏离和波动率计算。建议根据不同品种和时间周期仔细选择和优化该系数值以获得最佳效果。 主要特点 信号不重绘! 非常适合动量交易者的进场工具。 性能分析功能:胜率、盈亏比、平均收益等数据可视化展示。 适用于日内交易者、波段交易者和剥头皮交易者。 输入参数 历史K线数量:  用于指标计算的K线数量。 幅度系数:  用于调节带宽偏离和波动率的单一系数。 性能分析:  显示或隐藏性能分析,包括利润趋势线。  提醒设置:  支持弹窗、邮件、推送和声音提醒。 其余参数无需额外解释,简单明了。
KT COG Advanced MT4
KEENBASE SOFTWARE SOLUTIONS
1 (1)
KT COG is an advanced implementation of the center of gravity indicator presented by John F. Ehlers in the May 2002 edition of Technical Analysis of Stocks & Commodities magazine. It's a leading indicator which can be used to identify the potential reversal points with the minimum lag. The COG oscillator catches the price swings quite effectively. MT5 version of the same indicator is available here KT COG Advanced MT5 Calculation of COG The COG indicator is consist of the two lines. The main l
KT Psar Arrows
KEENBASE SOFTWARE SOLUTIONS
KT Psar Arrows使用标准的抛物线转向指标(Parabolic SAR)在图表上绘制箭头。当蜡烛的最高点触及SAR时绘制看涨箭头;当蜡烛的最低点触及SAR时绘制看跌箭头。信号在实时生成,无需等待K线收盘。  特点 对于想要基于抛物线SAR指标开发交易策略的交易者来说,这是一个非常有用的工具。  可以用于寻找市场中的转折点。 支持自定义PSAR参数输入。 提供所有MT4的提醒功能。 注意事项:抛物线SAR是一个滞后且严格机械化的指标。每一笔潜在交易都应该通过明确定义的规则进行筛选。     输入参数 PSAR步长:输入步长值。 PSAR最大值:输入最大值。 显示PSAR点:显示/隐藏PSAR点。即使不显示PSAR点,箭头功能也能正常工作。 其余输入项均为直观设置,无需特别说明。
KT Ichimoku Trader
KEENBASE SOFTWARE SOLUTIONS
1 (1)
KT Ichimoku Trader is a fully automated expert advisor that offers five popular trading strategies based on the Ichimoku indicator. Each strategy has it's own entry and exit method without any interference to other strategies. The Ichimoku system can be applied to all major currency pairs and metals. However, we found that it performs reasonably well mainly on two pairs.   MT5 Version is available here  https://www.mql5.com/en/market/product/35043 Features Trade up to 5 famous trading strategi
KT COG Robot
KEENBASE SOFTWARE SOLUTIONS
KT COG Robot is a fully automated Expert Advisor based on the KT COG Indicator . The COG indicator was originally presented by John F. Ehlers in the May 2002 edition of Technical Analysis of Stocks & Commodities magazine. The EA fires a long trade when COG line cross above the signal line and a short trade is fired when the COG line cross below the signal line.  Adaptive Filtration Our adaptive filtration algorithm combines the original COG formula with the major trend direction and market acce
ACB Breakout Arrows EA
KEENBASE SOFTWARE SOLUTIONS
这是一款基于我们自定义指标 “ACB Breakout Arrows” 的全自动化智能交易系统。入场基于一种常见的双向突破模式,可通过外部参数“Signal Sensitivity”来调节入场信号的强度。 交易确认机制 ACB Breakout Arrows EA 可通过另一个自定义指标 ACB Trade Filter 来过滤不理想的入场信号,提高交易准确性。 强烈买入: 向上箭头 + 绿色柱状图 + 多头趋势。 强烈卖出: 向下箭头 + 红色柱状图 + 空头趋势。 当柱状图为灰色并且趋势为震荡时,EA 将避免交易。 EA 会在后台加载所有相关指标和依赖项,指标不会显示在图表上。 主要功能亮点 长期以来的呼声终于实现,现在您可以通过我们 ACB Breakout Arrows 指标 实现完全自动化交易。 ACB Trade Filter 也已集成在 EA 中,用于模拟完整的交易系统。 无需额外下载,所有指标和依赖都内嵌在 EA 中。 可直接从指标中提取止损和止盈目标。 通过内置过滤器(如交易时段、MMI、Vortex、波动率、市场状态等)进一步提升性能。 提供三阶段的部分平仓
KT Asian Breakout
KEENBASE SOFTWARE SOLUTIONS
4 (1)
KT Asian Breakout carefully analyzes the range-bound market during the Asian session and then fires a long or short trade after doing some preassessment based on its inbuilt technical analysis module. The executed orders are closed within a day before the completion of the next day session. The inbuilt technical analysis module checks for the session range and compares it with the last 20 days price movement. If it finds any erratic price movement within the session, the orders are not executed
KT London Breakout
KEENBASE SOFTWARE SOLUTIONS
First thirty minutes are essential for a trading session. The early reaction of traders and market players sets a path for the rest of the day. KT London Breakout EA takes advantage of this phenomenon, and after analyzing the first thirty minutes of London session, it places two bidirectional pending orders. One of pending order is eventually canceled after realizing the market direction with certainty. It has been strictly tested and developed for EUR/JPY using 30-Min Time Frame. You can expe
MACD Divergence Seeker
KEENBASE SOFTWARE SOLUTIONS
KT MACD Divergence Seeker trades the regular and hidden divergence signals generated by our free indicator named KT MACD Divergence indicator. Trading the standalone divergences can be a risky affair that's why the KT MACD Divergence Seeker combines the standard divergence signals with an advanced analysis module to exploit the price inefficiencies on some FX pairs. What is the Divergence exactly? As a general conception if the price is making higher highs, then macd should also be making hig
筛选:
Phs Francis
28
Phs Francis 2024.10.11 00:34 
 

用户没有留下任何评级信息

KEENBASE SOFTWARE SOLUTIONS
59706
来自开发人员的回复 Nitin Raj 2024.10.11 12:37
Dear Phs Francis, Thank you for your feedback. I truly appreciate you bringing this to my attention. I’m sorry to hear that your experience with the product has been frustrating. To clarify, EAs can indeed work on custom Renko charts, but you are correct in pointing out a key detail—manual input of the symbol name is required in the EA settings. By default, many EAs try to fetch the symbol from the chart window, which may display names like EURUSD_10_PIPS(Renko chart) that don’t exist on your broker's server. This is where manually inputting the correct symbol name becomes crucial. I completely understand that this should have been better explained in the product description, and I apologize for the oversight. I’ll make sure this information is communicated moving forward, and I’d be happy to assist you personally in setting it up if needed. Your satisfaction is important to me, and I’m committed to making sure the product works as expected for you. Best regards,
Nitin
sunnychow
9043
sunnychow 2024.04.23 15:42 
 

用户没有留下任何评级信息

Osama Echchakery
21033
Osama Echchakery 2023.11.28 19:01 
 

用户没有留下任何评级信息

Manea Marian
1105
Manea Marian 2022.09.20 10:58 
 

用户没有留下任何评级信息

ti4no
14
ti4no 2022.03.21 22:00 
 

用户没有留下任何评级信息

popendekl
45
popendekl 2022.02.23 13:55 
 

用户没有留下任何评级信息

clovismr
96
clovismr 2022.02.21 15:12 
 

用户没有留下任何评级信息

S JENKINS
566
S JENKINS 2022.01.27 01:37 
 

用户没有留下任何评级信息

4xtrader2009
536
4xtrader2009 2021.09.24 22:30 
 

用户没有留下任何评级信息

Vanderocha
14
Vanderocha 2021.08.02 20:40 
 

用户没有留下任何评级信息

AltosT
90
AltosT 2021.07.18 06:35 
 

用户没有留下任何评级信息

scottonamission
34
scottonamission 2021.06.26 22:53 
 

用户没有留下任何评级信息

KEENBASE SOFTWARE SOLUTIONS
59706
来自开发人员的回复 Nitin Raj 2021.07.20 17:41
That is not a bug. MT5 considers the Renko chart as a separate custom symbol. That's why one-click trading doesn't work, and trade levels don't show up on the Renko chart.
Evgeny Belyaev
92375
Evgeny Belyaev 2021.06.14 00:16 
 

用户没有留下任何评级信息

KEENBASE SOFTWARE SOLUTIONS
59706
来自开发人员的回复 Nitin Raj 2021.06.16 10:31
Thanks, Evgeny :)
Dener Jose De Souza
200
Dener Jose De Souza 2021.05.14 18:07 
 

用户没有留下任何评级信息

mariofo
21
mariofo 2021.03.27 14:40 
 

用户没有留下任何评级信息

27138469
24
27138469 2021.02.27 22:01 
 

用户没有留下任何评级信息

Wan Ping Fei
1690
Wan Ping Fei 2020.12.19 14:16 
 

用户没有留下任何评级信息

回复评论