OrderBook Utilities

OrderBook Utilities is a script, which performs several service operations on order book hob-files, created by OrderBook Recorder.

The script processes a file for work symbol of the current chart. The file date is selected by means of the input parameter CustomDate (if it's filled in) or by the point where the script is dropped on the chart. Depending from the operation, useful information is written into the log, and optionally new file is created.

The operation is selected by the input parameter Operation:

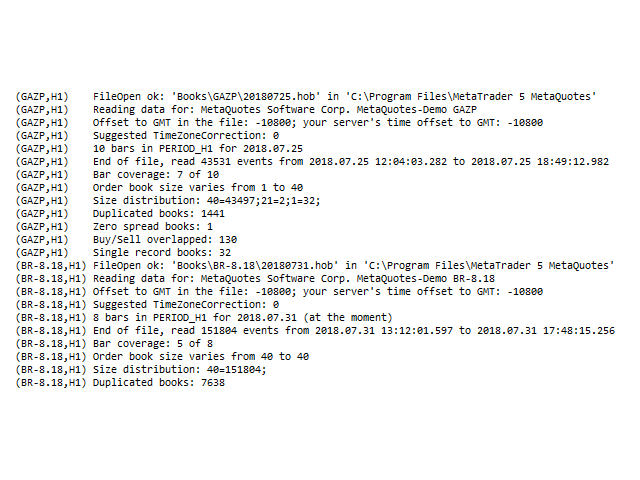
  • Check - verify all records for validity; incorrect books can be received from the terminal quite often, for many reasons; potential errors, which the script is capable of fixing, are listed below; Check operation does not fix the problems, but outputs common information to the log; to view details, enable PrintDetails mode; except for the errors, the operation outputs statistics on books with zero spread and books with overlapped Bid and/or Ask levels; please find examples on the Comments tab;
  • Fix - correct the file by eliminating problematic records (entire book event is removed); critical errors or suspicious data are deleted (see classification below); the fixed version is saved in a file with the same date but double extension.hob.fix;
  • Pack - minify the file; can be useful for sending the file to someone else, and minimizing network traffic; minified file is saved with.hop extension;
  • Unpack - restore a hob-file from minified hop-file;
  • Export - save entire archive as csv-file; can be useful for editing, context search and comparision, merging;
  • Import - restore a hob-file from exported csv-file;


Check types

Critical errors are marked in bold.

  • Duplicates of a book, i.e. 2 exactly matching records (without changes) in a row;
  • Incorrect order of Sell and Buy levels, i.e. they break the structure of 2 halves, each one of which contains only orders of the same type;
  • Incorrect order of prices in either half of the book;
  • Duplicate elements in the book, i.e. with the same prices and types;
  • Empty book;
  • Single level book;

If critical errors are not fixed, the file can not be packed.


Parameters

  • Operation - one of the operation types: Check (by default), Fix, Pack, Unpack, Export, Import;
  • FileFolder - a name of the root folder, where subfolders and files of the market books are stored; by default - "Books"; every subfolder is named according to specific work symbol;
  • UseCommonFiles - an option for processing files from the data folder of the current terminal (false, by default) or from the common data folder for all terminals (true);
  • CustomDate - a day, uniquely identifing the work hob-file (files are created one per day); by default - 0 (in MT5 user interface this is shown as '1970.01.01 00:00:00'), which means, that the day is selected according to the point, where the script was dropped on the chart; for example, if the script was dragged from Navigator and then dropped on 2018.08.01 on a chart, then the file 20180801.hob will be processed; when parameter CustomDate is filled in, then this date is used, and the point where the script is dropped has no effect;
  • MinimalBookSizeFilter - minimal book size to save during Fix operation, by default - 0, i.e. no filter, and books of all sizes will be preserved;
  • PrintDetails - an option to enable detailed logging, by default - false;
推荐产品
Forex17 Clock
Robinson Alves Lemos
Forex17 Clock 是一款适用于 MetaTrader 5 的轻量级、极简实用工具,用于在图表上显示经纪商服务器时间和/或用户自定义调整的时间。该产品旨在提供清晰、准确的时间信息,同时不干扰图表分析,保持图表整洁和高效。 该时钟直接以文本形式绘制在图表上,不使用面板、背景、边框或其他干扰性的视觉元素。这种设计方式确保了极低的资源占用率,与明亮和深色主题具有良好的兼容性,并完全尊重价格刻度和K线显示。该工具适合重视简洁性、视觉秩序和稳定性的交易者。 Forex17 Clock 允许用户选择文本显示的图表角落,调整字体大小和颜色,并设置相对于服务器时间的小时偏移。这使得用户可以直接在图表上方便、可靠地查看本地时间或不同时区的时间参考。 本产品不进行任何市场分析,不生成交易信号,不执行订单,也不与其他指标或专家顾问进行技术集成。它是一款独立运行的纯信息类工具,专注于在图表上显示时间。 该产品遵循 MQL5 的最佳开发实践,代码结构简洁,通过定时器进行轻量更新,强调稳定性和可预测性。Forex17 Clock 适合希望在 MetaTrader 5 中以低干扰方式监控时间的交易者。 由人
FREE
Market Profile 3 ForexArby com
Hussien Abdeltwab Hussien Ryad
4 (15)
Market Profile 3 MetaTrader 5 indicator  version 4.70— is a classic Market Profile implementation that can show the price density over time, outlining the most important price levels, value area, and control value of a given trading session. This indicator can be attached to timeframes between M1 and D1 and will show the Market Profile for daily, weekly, monthly, or even intraday sessions. Lower timeframes offer higher precision. Higher timeframes are recommended for better visibility. It is als
FREE
The utility is designed to control the update rate of the order book (or several) in the strategy tester. Management is carried out by a library, which is available here https://www.mql5.com/en/market/product/81400 Interface description: S/P   Start and pause playback ---    Decrease the speed by one step +++   Increase speed by one step R      Updating the character list <0>  Slider, moving left/right change the playback speed, after releasing the mouse it is restored to its original state. The
FREE
Weis Waves
Flavio Javier Jarabeck
2.83 (18)
The original author is David Weis, an expert in the Wyckoff Method. The Weis Wave is a modern adaptation of the 1930's Wyckoff Method, another expert in Tape Reading techniques and Chart Analysis. Weis Waves takes market volume and stacks it into waves according to price conditions giving the trader valuable insights about the market conditions. If you want to learn more about this subject you can find tons of videos in YouTube. Just look for "The Wickoff Method", "Weis Wave" and "Volume Spread
FREE
执行买/卖订单时,TradeSnap 会自动捕获并保存屏幕。 只需将其设置在图表上,它就会自动保存,无需任何额外工作。 图表上的线条、箭头等也会按图像中的原样保存。 图像大小可以是 10000x10000 像素,因此您可以保存显示价格变动历史的水平图像。 参数信息 --事件参数-- Magic number (0=ALL):如果您有任何 EA,请设置 Mugic Number。 entry: true:打开执行时捕获。 exit: true:关闭执行时捕获。 --捕获信息-- 图像宽度、图像高度:图像大小 x/y,以像素为单位。 最大值:10000px --留言信息-- 文本颜色、文本大小、文本位置、显示秒数:如果您想更改消息显示,请更改设置。 图像过滤器:deta filder/MQL5/Files/OshiraseSnap/ 无:如有必要,请删除旧图像。 感谢您对本产品的关注。 如果您对我们的产品感到满意,我们将非常高兴。 如果不是,请联系我们寻找解决方案。 此外,如果您需要其他功能,请随时告诉我们。
FREE
This is a demo version of a non-trading expert , which utilizes so called the custom symbols feature ( available in MQL as well ) to build renko charts based on historical quotes of selected standard symbol and to refresh renko in real-time according to new ticks. Also it translates real ticks to the renko charts, which allows other EAs and indicators to trade and analyze renko. Place the EA on a chart of a working instrument. The lesser timeframe of the source chart is, the more precise resulti
FREE
This robot sends Telegram notifications based on the coloring rules of PLATINUM Candle indicator. Example message for selling assets: [SPX][M15] PLATINUM TO SELL 11:45. Example message for buying assets : [EURUSD][M15] PLATINUM TO BUY 11:45 AM. Before enable Telegram notifications  you need to create a Telegram bot, get the bot API Key and also get your personal Telegram chatId. It's not possible to send messages to groups or channels. You can only send messages to your user chatId. You should
FREE
Mirror Chart MT5
Andrej Hermann
5 (1)
The Mirror Chart MT5 is a overlay indicator specifically designed to project a second financial instrument directly onto the main chart window. This tool is invaluable for traders who rely on correlation analysis, as it visualizes the price movements of two different instruments in real time. Unlike traditional overlays, this indicator utilizes intelligent, dynamic centering and scaling logic. It continuously analyzes the visible price range in the current window for both symbols and calculates
FREE
PZ Penta O MT5
PZ TRADING SLU
3.5 (4)
The Penta-O is a 6-point retracement harmonacci pattern which usually precedes big market movements. Penta-O patterns can expand and repaint quite a bit. To make things easier this indicator implements a twist: it waits for a donchian breakout in the right direction before signaling the trade. The end result is an otherwise repainting indicator with a very reliable trading signal. The donchian breakout period is entered as an input. [ Installation Guide | Update Guide | Troubleshooting | FAQ | A
FREE
Waves Sizer
Flavio Javier Jarabeck
3.86 (7)
Wyckoff fans, enjoy! Ideally to be used with the Weis Waves indicator, but it can be easily used alone, the Waves Sizer puts the range (in resulting Price movement) done by the Price on its market swings. You can control how accurate or loose will be the swings. This tool is very helpful for visually know how much the Price has traveled in your Timeframe. This way you can confront this level of effort with the resulting Volume, etc... Weis Waves indicator: https://www.mql5.com/en/market/produc
FREE
ChartWall
Yury Kulikov
4.75 (12)
ChartWall 适用于显示并自动更换图表的壁纸。它支持 JPG 和 BMP 格式。  此处有两种方式选择图像和显示风格: 当启动 ChartWall 时使用标准参数,或使用内置面板。内置面板可以通过点击应用图标来打开,它出现在图表左下角,您可以移动光标到该区域。使用内置面板,您还可以设置图像旋转周期,单位分钟。 图像文件必须位于本地终端的文件夹 "...\MQL5\Files" 或所有终端的公用文件夹。当使用标准参数对话框时,指定相对于本地终端文件夹的文件名 "...\MQL5\Files\"。
FREE
Playback of previously saved data from the order book. Key features: Historical data navigation Adjusting the playback speed with the "---" and "+++" buttons, as well as with the mouse, you can by scrolling the wheel over the area of ​​these buttons and between them Turning Price Centering On and Off Time display accurate to thousandths of a second Attention: This product also needs a utility to save data: https://www.mql5.com/en/market/product/71642
FREE
This utility EA will display simple renko, hence the name essential renko. The renko will be shown in a new tab and using custom symbol. Please do note (especially for those who new to Renko), that Renko does not follow timeline as it will follow price movement. That's why it has a lot of potential where you can attach any EA that you want and use any custom indicator in this new custom symbol for renko. Always use M1 timeframe. Most of the time you don't need to change anything. But if you d
FREE
HTF Candles Nika 可将任意更高时间框架的完整K线直接叠加显示在MetaTrader 5的当前图表上,无需切换图表即可获得多时间框架视角。 主要功能 - 在当前图表上以矩形加影线的形式绘制高时间框架K线 - 支持标准K线和平均K线(Heiken Ashi)两种显示模式 - 实时倒计时,显示当前高时间框架K线距关闭的剩余时间 - 多头和空头K线颜色可自定义 - 自动或手动控制K线宽度 - 可配置影线宽度、字体、字号及文字位置偏移 - 适用于任何品种和时间框架组合 - 自动检测交易时段间隙并调整渲染 - 轻量级 — 仅使用图表对象,无指标缓冲区 输入参数 显示设置 - Max Lookback — 绘制的高时间框架K线数量(默认:500) - Timeframe — 要显示的高时间框架(默认:H1) - Bars Mode — K线或平均K线模式 颜色设置 - Up Color — 多头K线颜色(默认:DodgerBlue) - Down Color — 空头K线颜色(默认:Red) - Frame Color — 时间框架标签颜色(默认:Red) - Count
FREE
Order Book, known also as Market Book, market depth, Level 2, - is a dynamically updated table with current volumes of orders to buy and to sell specific financial instument at price levels near Bid and Ask. MetaTrader 5 provides the means for receiving market book from your broker, but in real time only, without access to its history. This expert adviser OrderBook History Playback allows you to playback the market book events on the history using files, created by OrderBook Recorder . The exper
FREE
AntaresX Volume Profile — Indicator for MetaTrader 5 AntaresX Volume Profile is an indicator that displays the price levels where the highest trading activity was concentrated during a selected period, and calculates the historical probability of the price reacting when it reaches each of those levels. What the indicator draws The indicator identifies three levels on the chart: POC (Point of Control): the price where the highest trading activity was recorded during the selected period. Displaye
FREE
Export Deals to CSV - Excell File location: HistoryDeals/<SERVER>/<LOGIN>.<DATETIME>.csv Works as an Script, reading all DEALS in history and exporting it as a plain text CSV file There's no option to change. There's no WebRequest. There's no DLL use. I need to write 300 characters to allow this product being exposed at MQL5 market place. It's simple to use, plug it in graph and wait completion.
FREE
Value Chart Candlesticks
Flavio Javier Jarabeck
4.69 (13)
The idea of a Value Chart indicator was presented in the very good book I read back in 2020 , " Dynamic Trading Indicators: Winning with Value Charts and Price Action Profile ", from the authors Mark Helweg and David Stendahl. The idea is simple and the result is pure genius: Present candlestick Price analysis in a detrended way! HOW TO READ THIS INDICATOR Look for Overbought and Oversold levels. Of course, you will need to test the settings a lot to find the "correct" one for your approach. It
FREE
Riskonix
Fabrizio Cottone
EARLY ACCESS The first users can download Riskonix for FREE. This is a limited early release to gather feedback and improve the product. Users who download now will get: • Free access before price increase • Priority updates • Direct support ️ Price will increase soon. Riskonix is a professional trading panel for MetaTrader 5 designed to simplify execution, automate risk management and improve trading precision. Built for serious traders, Riskonix combines smart automation with full m
FREE
Donchian Pro
Paulo Henrique Faquineli Garcia
4.75 (4)
The Donchian Channel Channels are among the most popular tools of technical analysis, as they visually convey to the analyst the limits within which most price movement tends to occur. Channel users know that valuable information can be obtained at any time, whether prices are in the central region of a band or close to one of the border lines. One of the best known techniques to explore these concepts is Bollinger Bands. However, John Bollinger was not the only one to research the application
FREE
Double TMA with Reversal Zones
Clayton Prickett
4.45 (11)
Note from Developer: This is the lite version of the Double TMA with Bands Indicator. You can find the paid version that comes with alerts and on screen signal arrows built in here . I will also be selling an EA based on this trading system soon once all backtesting and optimization have been completed. Unlock your trading potential with the Double TMA Indicator with Reversal Detection! Designed for swing and reversal trading, this versatile tool integrates two Triangular Moving Averages (
FREE
Tick Data Record MT5
Francisco Manuel Vicente Berardo
The Tick Data Record is a multi-symbol multi-timeframe Expert Advisor that records tick data for later graphical representation and analysis.  General Description  The Tick Data Record offers a(n) alternative/complement to the online/offline price charts displayed through the MT4/MT5 platform. The Expert Advisor permits to write and save the current/history values of Time, Bid, Ask, Spread, Last and Volume to a text file (“.txt”). The idea is to copy/open the obtained register to/in a spreadshe
FREE
Order Book, known also as Market Book, market depth, Level 2, - is a dynamically updated table with current volumes of orders to buy and to sell specific financial instument at price levels near Bid and Ask. MetaTrader 5 provides the means for receiving market book from your broker in real time. The expert OrderBook Recorder records market book changes and stores them in local files for further usage in indicators and expert adviser, including testing in the tester. The expert stores market book
FREE
Tenet Support and Resistance Pro
Lucas De Melo Carvalho Cruz
Tenet Support & Resistance Pro 是一个用于 MetaTrader 5 的高级指标,旨在帮助交易者准确识别 关键市场支撑和阻力区域 。 基于价格历史,该指标会自动绘制水平线以突出战略区域。此外,它会在 实时显示蜡烛当前交易区域 ,提供对关键决策区域的清晰视图。 一个独特功能是 蜡烛旁边的倒计时器 ,精确显示当前K线收盘剩余时间——非常适合需要精确入场时机的价格行为交易者。 主要优势 自动识别 最相关的支撑和阻力区域 。 直观突出显示 蜡烛当前交易区域 。 内置倒计时器 ,实时显示在蜡烛旁。 完全 可配置 :选择生成线条所使用的时间框架(D1、H4、H1、M15、M5、M1)。 可自定义颜色 ,适用于每种线条类型、区域和倒计时器。 根据图表时间框架隐藏或显示线条。 智能系统,可 每日或用户指定时间自动重新计算 水平。 ️ 输入参数 一般设置 default_chart_view – 如果希望将图表视觉更改为 Tenet 默认(白色背景,绿色多头蜡烛,红色空头蜡烛),设置为 True。 chart_ID – 要分析的图表ID。 reset_
FREE
Risk Calculator EA – Utility for Precise Trade Sizing If you find this tool useful consider to  Buy me a coffee!   The Ultimate Risk Calculator is a lightweight in-chart Expert Advisor (EA) designed to help you easily and quickly calculate position size and set stop-loss / take-profit levels with full control over risk management directly on the chart. What it does? It turns manual risk decisions into fast, visual, and accurate calculations. You draw or adjust the Entry, Stop-Loss and Take-P
FREE
PerformanceDashboard — Advanced Trade Analytics for MT5 PerformanceDashboard is a lightweight indicator designed to analyze trading performance directly from your MetaTrader 5 account history. It allows you to evaluate multiple Expert Advisors (EAs) simultaneously using Magic Numbers, providing clear and structured insights into your trading results. USER GUIDE Key Features Automatic Magic Number Detection Instantly scans your trading history and detects all active strategies within a selec
FREE
Global Market Sessions – Visual Analyzer for MT5 A lightweight MT5 indicator that visually maps Tokyo, London and New York sessions, auto-detects broker timezone & DST, and highlights the best liquidity windows for smarter trading. See the market’s rhythm at a glance. Trade with clarity, precision, and confidence. Overview Global Market Sessions is a powerful yet easy-to-use MT5 indicator that visually displays the world’s major trading sessions (Tokyo, London, New York) directly on your chart
FREE
Countdown Candle Close
Sid Ali Temkit
3 (1)
The Candle Countdown Timer for MetaTrader 4 (also available for MT5) is a vital indicator designed to help you manage your trading time effectively. It keeps you updated about market open and close times by displaying the remaining time before the current candle closes and a new one forms. This powerful tool enables you to make well-informed trading decisions. Key Features: Asia Range: Comes with an option to extend the range. Broker Time, New York, London Time: Displays the current broker time
FREE
The utility draws pivot levels based on a selection from day week month The previous candlestick of the selected timeframe is taken and the values for the levels are calculated using the following formulas: Pivot = (high + close + low) / 3 R1 = ( 2 * Pivot) - low S1 = ( 2 * Pivot) - high R2 = Pivot + (R1 -S1) R3 = high + ( 2 * (Pivot - low)) S2 = Pivot - (R1 - S1) S3 = low - ( 2 * (high - Pivot)); The style and thickness for all lines are adjusted. The colors for the R, Pivot and S lines ar
FREE
Simple Trend Direction MT5
Khalaf Hamza Mohammad Yousef
This is a FREE Trend Direction Indicator for MetaTrader 5. Features: Identifies market trend direction Uses EMA 50 and EMA 200 Non-repainting logic Clear visual display Suitable for manual trading Free version includes: - Single timeframe - Trend direction only - No alerts If you need: Alerts Multi-timeframe version EA automation Custom modifications My Name is Khalaf Hamza , You can contact me for freelance work --> khalaf.hamza.hi@gmail.com
FREE
该产品的买家也购买
Trade Assistant MT5
Evgeniy Kravchenko
4.42 (208)
它有助于计算每笔交易的风险,容易安装新的订单,具有部分关闭功能的订单管理, 7 种类型的追踪止损和其他有用的功能。   附加材料和说明 安装说明   -   应用程序说明   -   模拟账户应用程序的试用版 线条功能  - 在图表上显示开仓线、止损线、止盈线。 有了这个功能,就可以很容易地设置一个新的订单,并在开仓前看到它的附加特性。   风险管理  - 风险计算功能在考虑到设定的风险和止损单的大小的情况下,计算新订单的成交量。它允许你设置任何大小的止损,同时观察设定的风险。 批量计算按钮 - 启用 / 禁用风险计算。 在 " 风险 " 一栏中设置必要的风险值,从 0 到 100 的百分比或存款的货币。 在 " 设置 " 选项卡上选择风险计算的变量: $ 货币, % 余额, % 资产, % 自由保证金, % 自定义, %AB 前一天, %AB 前一周, %AB 前一个月。   R/TP 和 R/SL - 设置止盈和止损的关系。 这允许你设置相对于损失的利润大小。 例如, 1 : 1 - 这决定了 TP = SL 的大小。 2 : 1 - 这意味着 TP 是 SL 的两倍。 RR -
欢迎来到 Trade Manager EA——这是一个终极风险管理工具,旨在使交易变得更直观、精准和高效。它不仅仅是一个下单工具,而是一个用于无缝交易计划、仓位管理和风险控制的全面解决方案。不论您是新手交易员、资深交易员,还是需要快速执行的剥头皮交易员,Trade Manager EA 都可以满足您的需求,适用于外汇、指数、大宗商品、加密货币等各种市场。 借助 Trade Manager EA,复杂的计算已成过去。只需分析市场,在图表上用水平线标记入场、止损和止盈,设置您的风险水平,Trade Manager 就会立即计算出理想的头寸规模,并实时显示以点、账户货币计价的止损和止盈。每笔交易都得以轻松管理。 主要功能: 头寸规模计算器 :根据定义的风险瞬间确定交易规模。 简单的交易计划 :在图表上用可拖动的水平线直接计划交易,设置入场、止损和止盈。 实时显示 SL 和 TP :以账户货币、点或分显示止损和止盈,便于分析。 高级保护工具 盈亏平衡选项 : 基本盈亏平衡 :当您的交易达到设定水平时自动保护利润。 多级盈亏平衡 :设置多达 4 个级别以逐步保护利润。 尾随止损选项 : 基本尾随
Local Trade Copier EA MT5
Juvenille Emperor Limited
4.96 (135)
通过 Local Trade Copier EA MT5 获得非常快速的交易复制体验。它的简单1分钟设置,使您可以在同一台Windows计算机或Windows VPS上在多个MetaTrader终端之间复制交易,具有闪电般快速的复制速度,低于0.5秒。 无论您是初学者还是专业交易者, Local Trade Copier EA MT5 都提供了广泛的选项,可根据您的特定需求进行自定义。对于任何希望增加利润潜力的人来说,这都是终极解决方案。 今天就尝试一下,看看为什么它是市场上最快、最简单的贸易复印机! 提示: 您可以在您的模拟账户中下载并试用 Local Trade Copier EA MT5 模拟版: 这里 将下载的免费演示文件粘贴到您的 MT5 >> 文件 >> 打开数据文件夹 >> MQL5 >> 专家文件夹并重新启动您的终端。  免费演示版本每次可在 4 小时内发挥全部功能,仅限演示帐户。 要重置试用期,请转至 MT5 >> 工具 >> 全局变量 >> Control + A >> 删除。 请仅在非关键模拟账户上执行此操作,不要在挑战道具公司账户中执行此操作。 如果您无法
TradePanel MT5
Alfiya Fazylova
4.87 (151)
交易面板是一款多功能交易助手。该应用包含超过50种手动交易功能,并允许您自动执行大多数交易任务。 注意!折扣时间有限,每周二价格将上涨5美元。(直到100美元)。 在购买之前,您可以在演示账户上测试演示版本。下载用于演示账户的试用版应用程序: https://www.mql5.com/zh/blogs/post/762579 。 完整说明 这里 。 贸易. 只需单击一下即可执行交易操作: 打開掛單和頭寸,並自動計算風險。 一鍵打開多個訂單和頭寸。 打開訂單網格。 按組別關閉掛單和頭寸。 反轉頭寸方向(關閉買入>打開賣出,關閉賣出>打開買入)。 鎖定頭寸(通過開啟缺少的頭寸,使買入和賣出頭寸的數量相等)。 一鍵部分關閉所有頭寸。 將所有頭寸的止盈和止損設置在同一價格水平。 將所有頭寸的止損設置在盈虧平衡水平。 開倉時,可使用以下功能: 在多個訂單或倉位之間分配計算出的數量(在單擊一次時開啟多個訂單和倉位)。 在開啟訂單前在圖表上可視化交易水平。 僅在當前點差不超過設定值時才開啟倉位。 止盈和止損之間的自動比例。 虛擬止損和止盈。 自動將止損和止盈的大小增加為當前點差的大小。 基於ATR指
Farmed Hedge Yield Farming | All Markets (Manual - Hybrid - Semi/Automated EA) MULTI-ASSET SUPPORT Trade any asset available on your broker - Forex: Major, Minor, Exotic pairs - Crypto: BTC, ETH, XRP, SOL, BNB - Stocks: Apple, Tesla, Amazon, Google, etc. - Commodities: Gold, Silver, Oil, Gas - Indices: US30, NAS100, SPX500, DAX40 - Any CFD your broker offers VERIFIED TRADING RESULTS - Farmed Hedge Yield Axi Copy:  https://www.mql5.com/en/signals/2356376 - Farmed Hedge Yield Exn Copy:   https:/
测试版发布 Telegram to MT5 Signal Trader 即将进入正式的 Alpha 版本。一些功能仍在开发中,您可能会遇到一些小错误。如果您遇到问题,请反馈,您的意见将帮助我们改进软件。 Telegram to MT5 Signal Trader 是一款强大的工具,能够将 Telegram 频道或群组的交易信号自动复制到您的 MetaTrader 5 账户。 支持公开和私人频道,可将多个信号提供者连接至一个或多个 MT5 账户。软件优化、高效、稳定,精准控制每笔复制交易。 界面简洁,仪表盘美观,图表交互性佳,导航直观。您可以管理多个信号账户,自定义每个提供者的设置,并实时监控所有操作。 系统需求 由于 MQL 限制,EA 需要配合 PC 端应用与 Telegram 通信。 安装程序可通过官方 安装指南 获取。 核心功能 多提供者支持: 从多渠道复制信号至多个 MT5 帐户 高级信号识别: 关键词、模式和标签全面自定义 逐提供者控制: 可启用/禁用特定信号类型、平仓策略等 灵活风险管理: 固定手数、固定金额、余额/权益百分比、部分平仓设置 可定制 SL/TP: 覆盖信号
HINN Lazy Trader
ALGOFLOW OÜ
5 (2)
Limited time offer: 20% off for a few days only!  - Annual subscription $360 instead of $450  - Lifetime plan $550 instead of $690 The core idea: using the user interface, you configure the parameters the chart must meet before entering a position (or positions), choose which entry models to use, and set the rules for when trading and planning should end. Lazy Trader  handles the rest: it  takes over all the routine chart watching and execution! full description  :: 3 key videos [1] ->  [2]   -
Exp COPYLOT CLIENT for MT5
Vladislav Andruschenko
3.82 (34)
适用于 MetaTrader 5 的专业交易复制器 快速、专业、稳定可靠的 交易复制器 ,适用于 MetaTrader 。 COPYLOT 可在 MT4 和 MT5 终端之间复制 Forex 交易,并支持 Hedge 和 Netting 账户。 COPYLOT 的 MT5 版本支持: - MT5 Hedge → MT5 Hedge - MT5 Hedge → MT5 Netting - MT5 Netting → MT5 Hedge - MT5 Netting → MT5 Netting - MT4 → MT5 Hedge - MT4 → MT5 Netting MT4 版本 完整说明 + DEMO + PDF 如何购买 如何安装 如何获取日志文件 如何测试和优化 Expforex 的所有产品 您也可以将交易复制到 MT4 终端(MT4 → MT4,MT5 → MT4): COPYLOT CLIENT for MT4 COPYLOT 是一款专业的交易和持仓复制器,可同时与 2、3 甚至 10 个终端协同工作。 支持从 模拟账户和投资者账户 复制,也支持同时在多个终端上运行。 您可以使
Trade Dashboard MT5
Fatemeh Ameri
4.94 (121)
疲于复杂的订单下达和手动计算?Trade Dashboard 是您的解决方案。凭借其用户友好的界面,订单下达变得轻而易举,只需点击一下,您就可以开设交易、设置止损和止盈水平、管理交易手数,并计算风险回报比,让您只需专注于您的策略。告别手动计算,使用 Trade Dashboard 简化您的交易体验。 立即下载演示版本 。 您可以在这里找到仪表盘功能和特性的详细信息 。 加入 Telegram 频道 。 购买后请给我发消息以获取支持。如果您需要添加更多功能,可以在产品的评论区留下您的想法,我愿意听取任何建议,希望您能在使用我的产品时获得最佳体验 。 这是 MT4 版本。 风险管理:使用 Trade Dashboard,可以将您的风险设置为账户余额或权益的百分比,或将风险设置为总金额。在图表上直观地定义您的止损,让工具准确计算每个货币对的适当手数。该工具还可以根据您期望的风险回报比自动设置止盈水平。它甚至可以在手数计算中涵盖佣金和点差费用。此外,您的止损和止盈可以转变为虚拟水平,隐藏于经纪商。通过 Trade Dashboard 的高级风险管理功能,掌控风险,保护您的资本。 交易线
Footprint Chart Pro — Professional OrderFlow EA for MetaTrader 5 Version 6.34 | Professional tool for real traders | Institutional-Grade Visualization DEMO USERS - PLEASE SELECT EVERY TICK / REAL TICK WHEN TESTING AND YOU HAVE DOWNLOADED HISTORICAL DATA. IF YOU SEE A WAITING SCREEN AND IT IS NOT DOWNLOADING, IT MEANS YOU HAVE LOW HISTORICAL DATA. TRY 1 MIN AND 5 MIN FIRST ON 1 DAY DATA. ONE DAY DATA SHOULD BE THE NEWEST AND MOST CURRENT DATE. PLEASE WAIT UNTIL THE MARKET HAS ROLLED OVER PERIOD.
Trade copier MT5
Alfiya Fazylova
4.59 (41)
Trade Copier 是一种专业实用程序,旨在复制和同步交易账户之间的交易。 复制发生从供应商的帐户/终端到收件人的帐户/终端,安装在同一台计算机或 vps 上。 促销活动 - 如果您已经购买了“Trade copier MT5”,您可以免费获取“Trade copier MT4”(用于 MT4 > MT5 和 MT4 < MT5 的复制)。欲了解更多详细条款,请通过私人消息与我们联系! 在购买之前,您可以在演示帐户上测试演示版本。 演示 这里 。 完整说明 这里 。 主要功能和优点: 支持复制MT5>MT5、MT4>MT5、MT5>MT4,包括МТ5 netting账户。 供应商和收件人模式在同一产品中实现。 简单直观的界面,允许您直接从图表中实时控制复制。 连接中断或终端重新启动时不会丢失设置和位置。 允许您选择要复制的符号,也可以替换接收者的符号,例如 EURUSD> USDJPY。 支持回拷贝。 能够仅复制某些订单。 允许您设置开仓交易价格的最大差异和最大时间延迟。 正确复制部分订单关闭的执行。 计算复制手数的几种方法。 同步止盈和止损。有几种方法可以计算它们的位置。 支持
Copy Cat More Trade Copier MT5 (复制猫MT5) 是一个本地跟单软件,也是一个完整的风险管理和执行框架,专为当今的交易挑战而设计。从资金管理公司挑战到个人投资组合管理,它能适应各种情况,结合了稳健的执行、资本保护、灵活配置和高级交易处理功能。 该跟单软件可在主端(发送方)和从端(接收方)模式下工作,实时同步市价单和挂单、交易修改、部分平仓和对冲平仓操作。它兼容模拟和实盘账户、交易或投资者登录,并通过持久的交易记忆系统确保恢复功能,即使EA、终端或VPS重启也不例外。可以同时管理多个主端和从端,使用唯一ID,并通过前缀/后缀调整或自定义品种映射自动处理跨经纪商差异。 手册/设置  | Copy Cat More MT4 | 频道  特色功能: 易于设置——快至30秒(见视频)。 快速、稳定、准确——Turbo模式下低延迟复制(见截图)。 高安全性——不使用潜在危险的DLL或WebRequest。 持久交易记忆,避免孤立、丢失或不准确的交易。 可从手动或EA复制,支持所有账户类型。 品种自动前缀/后缀,快速设置;支持MT4和MT5之间复制。 非常灵活的多主端
The product will copy all telegram signal to MT5 ( which you are member) , also it can work as remote copier.  Easy to set up, copy order instant, can work with almost signal formats, image signal,  s upport to translate other language to English Work with all type of channel or group, even channel have "Restrict Saving Content", work with  multi channel, multi MT5 Work as remote copier: with signal have ticket number, it will copy exactly via ticket number. Support to backtest signal. How to s
MT5 to Telegram Signal Provider 是一个易于使用且完全可自定义的工具,它允许向 Telegram 的聊天室、频道或群组发送 指定 的信号,将您的账户变为一个 信号提供商 。 与大多数竞争产品不同,它不使用 DLL 导入。 [ 演示 ] [ 手册 ] [ MT4 版本 ] [ Discord 版本 ] [ Telegram 频道 ]  New: [ Telegram To MT5 ] 设置 提供了逐步的 用户指南 。 不需要了解 Telegram API;开发者提供了您所需的一切。 关键特性 能够自定义发送给订阅者的订单详情 您可以创建分层的订阅模型,例如铜、银、金。其中金订阅获得所有信号等。 通过 id、符号或评论过滤订单 包括执行订单的图表截图 在发送的截图上绘制已关闭的订单,以便额外核实 延迟发送新订单消息的可能性,以便在发送前对位置进行调整 订单详情完全透明: 新的市场订单*带截图 订单修改(止损、获利) 已关闭的订单*带截图 部分关闭的订单** 新的挂单 修改的挂单(进场价格) 挂单激活(作为新的市场订单附加) 已删除的挂单 历史订单报告
Timeless Charts
Samuel Manoel De Souza
5 (4)
Timeless Charts is an advanced charting solution designed for professional traders seeking for custom charts / custom timeframes , including seconds charts / seconds timeframe, renko charts / renko bars, cluster charts / footprint charts and advanced tools present in most of the popular platforms. Unlike traditional offline charts or simplistic custom indicators, this solution constructs fully custom bars with true timestamp accuracy , down to miliseconds, allowing for a powerful and precise tr
Helios Pulse
Jonathan Mboya Kinaro
Helios Pulse v1.03 — 实时概率交易面板,专为手动交易者打造 Helios Pulse 彻底改变您解读市场的方式。无需在多个指标窗口之间来回切换、纠结于相互矛盾的信号,您只需看一个清晰的答案:一个实时更新的概率百分比,展示当前市场的方向性偏移,逐笔跳动持续刷新。 这不是又一个信号箭头面板。Helios Pulse 是一个概率引擎,它衡量多个技术维度之间的一致程度,输出一个真正可信赖的确信度评分。您看到的不仅是方向,还有这个方向有多强——以及它正在实时增强还是减弱。 图表上的呈现 一个紧凑的深色主题面板嵌入您的图表,包含两张动态概率卡片——一张代表做多,一张代表做空。随着市场状况变化,卡片颜色强度从暗淡渐变为鲜明,让您在查看数字之前就能获得即时的视觉判断。清晰的判定标签显示当前状态:Strong Buy、Lean Long、Neutral、Lean Short 或 Strong Sell。 动量变化箭头显示概率正在上升还是下降,让您在确信度积聚或消散的瞬间捕捉到变化。峰值追踪功能记录当前交易时段两个方向的最高概率值。 当需要完整的图表视野时,将面板最小化为一条精简的状态
Anchor Trade Manager
Kalinskie Gilliam
5 (2)
Anchor: The EA Manager A coordination system for traders running multiple EAs. Anchor ensures only one EA can trade at a time, preventing conflicting positions and keeping your portfolio safer. Attach Anchor to any chart. Configure your EAs and their magic numbers. Anchor handles the rest. Built for portfolios. Built for discipline. Built for prop firms. The Problem Running multiple EAs on the same account creates risk. Two gold EAs can open opposite positions on the same candle. Three EA
HINN MagicEntry Extra
ALGOFLOW OÜ
4.71 (14)
HINN MAGIC ENTRY – the ultimate tool for entry and position management! Place orders by selecting a level directly on the chart! full description   ::  demo-version  :: 60-sec-video-description Key features: - Market, limit, and pending orders - Automatic lot size calculation - Automatic spread and commission accounting - Unlimited partitial take-profits  - Breakeven and trailing stop-loss and take-profit  functions - Invalidation leves - Intuitive, adaptive, and customizable interface - Works
Trader Evolution
Siarhei Vashchylka
5 (7)
" Trader Evolution " - A utility designed for traders who use wave and technical analysis in their work. One tab of the utility is capable of money management and opening orders, and the other can help in making Elliott wave and technical analysis. Manual (Be sure to read before purchasing) | Version for MT4 Advantages 1. Trading in a few clicks. Immediate and pending orders are available in the panel 2. Money management. The program automatically selects the appropriate lot size 3. Simplifies
EA Auditor
Stephen J Martret
5 (1)
EA AUDITOR — EA and Signal Verification Tool for MetaTrader 5 EA Auditor is an independent analysis tool for traders evaluating Expert Advisors and trading signals on MetaTrader 5. It audits backtest reports, reviews posted developer signals, and cross-verifies the two against each other to help traders assess strategies before committing capital. The MQL5 market offers a wide range of Expert Advisors from many developers, with varying approaches, quality, and transparency. EA Auditor provides a
Ultimate Extractor
Clifton Creath
5 (9)
Ultimate Extractor - Professional Trading Analytics for MT5 *****this is the local HTML version of Ultimate Extractor. !!!!!it is not compatible with Cloud!!!! For the online version please reach out to me directly****** Ultimate Extractor transforms your MetaTrader 5 trading history into actionable insights with comprehensive analytics, interactive charts, and real-time performance tracking. What It Does Automatically analyzes your MT5 trading history across all Expert Advisors and generates
Seconds Chart MT5
Boris Sedov
4.59 (17)
秒级图表 (Seconds Chart) - 一款专为 MetaTrader 5 设计的独特工具,用于创建秒级时间框架的图表。 通过 秒级图表 ,您可以构建以秒为单位的时间框架图表,获得标准分钟或小时图表无法提供的极致灵活性和分析精度。例如,时间框架 S15 表示每根蜡烛图持续15秒。您可以使用任何支持自定义交易品种的指标和EA交易系统。操作它们就像在标准图表上交易一样方便。 与标准工具不同, 秒级图表 让您能够在超短时间框架下进行高精度交易,无延迟干扰。 秒级图表的优势 支持 1至900秒 的时间框架图表。 基于内置的实时报价数据库, 即时加载 历史数据。 数据实时更新, 无延迟或滞后 。 可同时创建 多个秒级图表 。 秒级图表的理想应用场景 剥头皮交易 和高频交易。 精确的入场和出场时机。 在短时间框架下测试交易策略。 时间框架设置 默认设置包含以下时间框架: S1、S2、S3、S4、S5、S6、S10、S12、S15、S20、S30 。 您可轻松自定义时间框架组合,只需按升序列出 1至900秒 的数值且避免重复即可。 其他免费工具 快速交易管理器 ( Quick Trade Ma
实时扫描您的整个观察列表,发现极端K线。 Power Bar Scanner 同时监控您所有的交易品种,在出现极端价格K线的瞬间向您发出警报。无需再逐个翻看图表。在一个面板中查看所有机会。 适用于任何时间周期。Forex、指数、黄金、加密货币 - 全部集中在一个视图中。 工作原理 扫描器检查您 Market Watch 中的每个品种,寻找实体超过 N x ATR 的K线。当发现这样的K线时,该品种会亮起并显示方向(BUY/SELL)、ATR 比率以及信号出现在多少根K线之前。您可以一目了然地看到哪些品种当前处于活跃状态。 一键导航 点击扫描器中的任何品种名称,您的图表会立即切换到该品种。发现信号,点击它,分析它。无需手动切换品种,无需在图表标签中搜索。 可排序列 点击任何列标题,按品种、价格、信号、比率或时间排序。想先看最强的信号?按 Ratio 排序。想看最新的信号?按 Age 排序。再次点击可反转排序顺序。 与 Power Bar MT5 完美配合 扫描器发现机会。 Power Bar 指标 进行分析。两者结合使用:扫描器在您的观察列表中提醒您出现极端K线,然后点击该品种,让
Trade Manager DashPlus
Henry Lyubomir Wallace
5 (13)
DashPlus 是一款先进的交易管理工具,旨在提升您在 MetaTrader 5 平台上的交易效率和效果。它提供一整套功能,包括风险计算、订单管理、先进的网格系统、基于图表的工具和绩效分析。 主要功能 1. 恢复网格 实施一个平均和灵活的网格系统,以在不利的市场条件下管理交易。 允许设置战略性进出点,以优化交易恢复。 2. 叠加网格 通过在强劲的市场波动中增加仓位,最大化有利交易的潜在回报。 帮助您通过扩展获利交易来利用趋势市场。 3. 盈亏线 在图表上直接提供潜在利润和损失场景的可视化表示。 调整设置并拖动盈亏线,以在执行之前评估各种交易结果。 4. 篮子模式 简化同一交易品种的多仓位管理,将它们合并为一个聚合仓位。 基于平均价格,便于监控和应用止损、止盈以及其他订单修改。 5. 图表上的新闻 将预定的经济新闻事件整合到您的交易图表中。 帮助您随时掌握可能影响市场波动的即将发生的事件,从而更好地规划交易。 6. 警报 设置基于时间或价格的警报,通知会显示在 MT5 中,或通过 MT5 应用发送到您的移动设备。 对监控关键价格水平或重要的交易时段非常有用。 7. 绩效统计 提供详细的
Trade Manager DaneTrades
Levi Dane Benjamin
4.28 (29)
交易管理器可帮助您快速进入和退出交易,同时自动计算风险。 包括帮助您防止过度交易、报复性交易和情绪化交易的功能。 交易可以自动管理,账户绩效指标可以在图表中可视化。 这些功能使该面板成为所有手动交易者的理想选择,并有助于增强 MetaTrader 5 平台。多语言支持。 MT4版本  |  用户指南+演示 交易经理在策略测试器中不起作用。 如需演示,请参阅用户指南 风险管理 根据%或$自动调整风险 可选择使用固定手数或根据交易量和点自动计算手数 使用 RR、点数或价格设置盈亏平衡止损 追踪止损设置 最大每日损失百分比,在达到目标时自动平仓所有交易。 保护账户免遭过多提款并阻止您过度交易 最大每日损失(以美元为单位)在达到目标时自动关闭所有交易。 保护账户免遭过多提款并阻止您过度交易 一键实现所有交易的盈亏平衡 自动计算从手机/电话发送的交易的风险 OCO 在设置中可用 交易和头寸管理 通过设置每月、每周、每天、每小时或每分钟的最大交易次数,停止过度交易和报复性交易。 高级挂单管理。 调整何时关闭挂单的规则 追踪挂单 支持市价订单和挂单 每日最大利润目标(以美元为单位)以确保头寸并停止
Equity Protect Pro:全方位账户保护专家,让您的交易更安心 如果您正在寻找账户保护、净值保护、投资组合保护、多策略保护、利润保护、利润收割、交易安全、风控程序、自动风控、自动清仓、条件清仓、定时清仓、动态清仓、跟踪止损、一键关闭、一键清仓、一键还原等功能,Equity Protect Pro 就是您要找的程序。 它配置简单,当到达预设条件时,可关闭所有图表,同时支持关闭信号订阅(这意味着所有交易程序也将停止运行)。此时,将不再有新订单产生,最后再关闭所有订单,有效防止意外损失,让您在交易过程中高枕无忧。 Equity Protect Pro (Technical Manual) Equity Protect Pro Demo Version for yo u to test   Equity Protect Pro MT4 Demo.ex4        Equity Protect Pro MT5 Demo.ex5 Equity Protect Pro 拥有 14 个核心功能,它们都是独立运行的。您可以根据您的交易策略,选择合适的功能组合使用。这些功能默认为关闭状态,
Ultimate Trailing Stop EA MT5
BLAKE STEVEN RODGER
4.13 (8)
This EA Utility allows you to manage (with advanced filtering) unlimited open orders (manual or EA) with 16 trailing stop methods: fixed, percent, ATR Exit, Chandelier Exit, Moving Average, Candle High Low Exit, Bollinger Bands, Parabolic, Envelope, Fractal, Ichimoku Kijun-Sen, Alligator, Exit After X Minutes or Bars, RSI and Stochastic. The trailing stop can be either real or virtual, and you can exit fully or with a partial close percent on touch or bar close.  Moreover, you can add (override
Smart Stop Scanner – 多品种结构化止损扫描系统 概述 Smart Stop Scanner 为交易者提供跨市场的专业止损结构监控。系统基于真实市场结构、关键突破点以及价格行为逻辑,自动识别最有意义的止损区域,并在统一的、高度清晰、DPI 自适应面板中展示所有信息。 适用于 Forex、黄金、指数、金属、加密货币等多种资产。 止损如何计算 本系统并未使用传统指标或任意公式,而是通过纯价格行为识别 突破、更高高点、更低低点 等结构事件。 止损位置基于这些结构节点生成,因此更加真实、自然,并与实际市场行为紧密吻合。 核心功能亮点 • 多品种精准兼容 完整支持外汇、黄金、指数、金属、加密资产及其他工具,自动处理不同的点值和小数位。 • 即时结构识别 实时检测新的、失效的和当前有效的止损结构,并提供方向、形成时间、距离等关键信息。 • SL %ADR – 自适应止损质量评估 每个止损都会与该品种历史的结构性止损事件进行统计对比。 自适应颜色区间清晰显示止损是 极紧、紧、适中、宽、非常宽 。 基于真实波动率,而非固定阈值。 • Dist % – 实时止损距离
EasyTrade MT5
Alain Verleyen
5 (3)
Easy Trade – 智能、简洁且强大的交易管理工具 Easy Trade 是为 MetaTrader 用户打造的一体化交易管理解决方案,帮助您轻松掌控风险,实现流畅交易执行。 它是根据交易者的反馈从零开始开发的,简化了多品种交易的执行、监控和管理流程,无需繁琐的操作。 无论您是手动短线交易者,还是管理多个交易设置的小型投资组合,Easy Trade 都能让您专注于明智决策和稳定盈利。 ⸻ 为什么选择 Easy Trade? 精准风险管理:可选择固定手数或按百分比定义每笔交易的风险。实时显示风险与潜在收益。 篮子式跟踪止盈:追踪多笔交易的总利润,目标达成时自动锁定部分收益,适用于组合交易。 交易截图记录:每笔交易都可截图保存,方便日记记录、回顾与绩效分析。 定时自动平仓:可设定具体日期和时间自动关闭持仓,适合日终或周末前平仓。 界面可自定义:可调整按钮排序与大小、线条样式与颜色、缩放比例等,满足个人使用习惯。 ⸻ 主要功能(版本 1.0) 魔术号与策略标签: 使用注释标记轻松区分不同策略的交易,便于统计与复盘。 手数设置: 支持固定手数或基于止损与账户资金百分比的动态手
Advanced Dashboard Ultra
Mirel Daniel Gheonu
5 (1)
MT5 统计仪表板 & 交易日志 ULTRA (Stats Dashboard & Journal ULTRA) 完整的交易指挥中心:分析、自动化与新闻情报。 Stats Dashboard ULTRA 是 Pro 分析工具的终极进化版。它将 MetaTrader 5 转化为专业的交易工作站,结合了机构级的绩效分析、自动新闻保护和高级心理指标。专为需要全面掌控的手动交易者和 EA 组合经理设计。 ULTRA 版本新功能 新闻情报引擎 (News Intelligence Engine): 不仅是看新闻——而是分析它。仪表板会模拟过去的新闻事件如何影响您的未平仓交易,告诉您是应该持有还是平仓。 EA 机器人卫士 (Bot Guard): 在高影响力新闻期间自动暂停您的其他智能交易系统 (EA),并在市场平静后重新启动它们。 真实权益回撤 (True Equity Drawdown): 基于日内浮动亏损 (MAE) 计算风险,而不仅仅是已结余额,为您提供真实的风险图景。 心理与效率评分: 游戏化的指标,衡量您的纪律性、交易效率 (MFE 捕获率) 和错误成本。 魔术编号 (Magic Nu
作者的更多信息
WalkForwardOptimizer MT5
Stanislav Korotky
3.78 (9)
WalkForwardOptimizer library allows you to perform rolling and cluster walk-forward optimization of expert advisers (EA) in MetaTrader 5. To use the library include its header file WalkForwardOptimizer.mqh into your EA source code, add call provided functions as appropriate. Once the library is embedded into EA, you may start optimization according to the procedure described in the User guide . When it's finished, intermediate results are saved into a CSV file and some special global variables.
RenkoFromRealTicks
Stanislav Korotky
4.5 (2)
This non-trading expert utilizes so called custom symbols feature ( available in MQL API as well) to build renko charts based on history of real ticks of selected standard symbol. RenkoFromRealTicks generates custom symbol quotes, thus you may open many charts to apply different EAs and indicators to the renko. It also transmits real ticks to update renko charts in real time. The generated renko chart uses M1 timeframe. It makes no sense to switch the renko chart to a timeframe other than M1. T
AutomaticZigZag
Stanislav Korotky
4.5 (2)
This is a non-parametric ZigZag providing 4 different methods of calculation. Upward edge continues on new bars while their `highs` are above highest `low` among previous bars, downward edge continues on next bars while their `lows` are below lowest `high` among previous; Gann swing: upward edge continues while `highs` and `lows` are higher than on the left adjacent bar, downward edge continues while `highs` and `lows` are lower than on the left adjacent bar. Inside bars (with lower `high` and
FREE
CustomVolumeDelta
Stanislav Korotky
5 (1)
This indicator displays volume delta (of either tick volume or real volume) encoded in a custom symbol, generated by special expert advisers, such as RenkoFromRealTicks . MetaTrader does not allow negative values in the volumes, this is why we need to encode deltas in a special way, and then use CustomVolumeDelta indicator to decode and display the deltas. This indicator is applicable only for custom instruments generated in appropriate way (with signed volumes encoded). It makes no sense to ap
FREE
VolumeDeltaM1 MT5
Stanislav Korotky
This indicator provides the analysis of tick volume deltas. It monitors up and down ticks and sums them up as separate volumes for buys and sells, as well as their delta volumes. In addition, it displays volumes by price clusters (cells) within a specified period of bars. This indicator is similar to VolumeDeltaMT5 , which uses almost the same algorithms but does not process ticks and therefore cannot work on M1. This is the reason for VolumeDeltaM1 to exist. On the other hand, VolumeDeltaMT5 ca
This is a demo version of a non-trading expert , which utilizes so called the custom symbols feature ( available in MQL as well ) to build renko charts based on historical quotes of selected standard symbol and to refresh renko in real-time according to new ticks. Also it translates real ticks to the renko charts, which allows other EAs and indicators to trade and analyze renko. Place the EA on a chart of a working instrument. The lesser timeframe of the source chart is, the more precise resulti
FREE
WalkForwardDemo MT5
Stanislav Korotky
WalkForwardDemo is an expert adviser (EA) demonstrating how the built-in library WalkForwardOptimizer (WFO) for walk-forward optimization works. It allows you to easily optimize, view and analyze your EA performance and robustness in unknown trading conditions of future. You may find more details about walk-forward optimization in Wikipedia . Once you have performed optimization using WFO, the library generates special global variables (saved in an "archived" file with GVF-extension) and a CSV-f
FREE
HZZM
Stanislav Korotky
4 (1)
This is an adaptive ZigZag based on modification of  HZZ indicator (original source code is available in this article ). Most important changes in this version: two additional indicator buffers added for zigzag evolution monitoring - they show cross signs at points where zigzag direction first changes; zigzag range (H) autodetection on day by day basis; time-dependent adjustment of zigzag range. Parameters: H - zigzag range in points; this parameter is similar to original HZZ, but it can take 0
FREE
ReturnAutoScale
Stanislav Korotky
5 (2)
The indicator calculates running total of linear weighted returns. It transforms rates into integrated and difference-stationary time series with distinctive buy and sell zones. Buy zones are shown in blue, sell zones in red. Parameters: period - number of bars to use for linear weighted calculation; default value - 96; smoothing - period for EMA; default value - 5; mode - an integer value for choosing calculation mode: 0 - long term trading; 1 - medium term trading; 2 - short term trading; defa
FREE
Order Book, known also as Market Book, market depth, Level 2, - is a dynamically updated table with current volumes of orders to buy and to sell specific financial instument at price levels near Bid and Ask. MetaTrader 5 provides the means for receiving market book from your broker, but in real time only, without access to its history. This expert adviser OrderBook History Playback allows you to playback the market book events on the history using files, created by OrderBook Recorder . The exper
FREE
This script allows performing a walk-forward analysis of trading experts based on the data collected by the WalkForwardLight MT5 library. The script builds a cluster walk forward report and rolling walk forward reports that refine it, in the form of a single HTML page. This script is optional, as the library automatically generates the report immediate after the optimization in the tester is complete. However, the script is convenient because it allows using the same collected data to rebuild th
FREE
PointsVsBars
Stanislav Korotky
This indicator provides a statistical analysis of price changes (in points) versus time delta (in bars). It calculates a matrix of full statistics about price changes during different time periods, and displays either distribution of returns in points for requested bar delta, or distribution of time deltas in bars for requested return. Please, note, that the indicator values are always a number of times corresponding price change vs bar delta occurred in history. Parameters: HistoryDepth - numbe
FREE
Order Book, known also as Market Book, market depth, Level 2, - is a dynamically updated table with current volumes of orders to buy and to sell specific financial instument at price levels near Bid and Ask. MetaTrader 5 provides the means for receiving market book from your broker in real time. The expert OrderBook Recorder records market book changes and stores them in local files for further usage in indicators and expert adviser, including testing in the tester. The expert stores market book
FREE
Comparator
Stanislav Korotky
4.75 (4)
This indicator compares the price changes during the specified period for the current symbol and other reference symbol. It allows to analyze the similar movements of highly correlated symbols, such as XAUUSD and XAGUSD, and find their occasional convergences and divergences for trading opportunities. The indicator displays the following buffers: light-green thick line - price changes of the current symbol for TimeGap bars; light-blue thin line - price changes of the reference symbol ( LeadSymbo
FREE
Year2Year
Stanislav Korotky
This indicator shows price changes for the same days in past years. D1 timeframe is required. This is a predictor indicator that finds D1 bars for the same days in past 8 years and shows their relative price changes on the current chart. Parameters: LookForward - number of days (bars) to show "future" price changes; default is 5; Offset - number of days (bars) to shift back in history; default is 0; ShowAverage - mode switch; true - show mean value for all 8 years and deviation bounds; false - s
FREE
SOMFX1Builder
Stanislav Korotky
5 (1)
If you like trading by candle patterns and want to reinforce this approach by modern technologies, this script is for you. In fact, it is a part of a toolbox, that includes a neural network engine implementing Self-Organizing Map (SOM) for candle patterns recognition, prediction, and provides you with an option to explore input and resulting data. The toolbox contains: SOMFX1Builder  - this script for training neural networks; it builds a file with generalized data about most characteristic pric
FREE
Mirror
Stanislav Korotky
This indicator predicts rate changes based on the chart display principle. It uses the idea that the price fluctuations consist of "action" and "reaction" phases, and the "reaction" is comparable and similar to the "action", so mirroring can be used to predict it. The indicator has three parameters: predict - the number of bars for prediction (24 by default); depth - the number of past bars that will be used as mirror points; for all depth mirroring points an MA is calculated and drawn on the ch
If you like trading crosses (such as AUDJPY, CADJPY, EURCHF, and similar), you should take into account what happens with major currencies (especially, USD and EUR) against the work pair: for example, while trading AUDJPY, important levels from AUDUSD and USDJPY may have an implicit effect. This indicator allows you to view hidden levels, calculated from the major rates. It finds nearest extremums in major quotes for specified history depth, which most likely form resistence or support levels, a
EvoLevels
Stanislav Korotky
The indicator displays most prominent price levels and their changes in history. It dynamically detects regions where price movements form attractors and shows up to 8 of them. The attractors can serve as resistance or support levels and outer bounds for rates. Parameters: WindowSize - number of bars in the sliding window which is used for detection of attractors; default is 100; MaxBar - number of bars to process (for performance optimization); default is 1000; when the indicator is called from
ExtraMovingPivots
Stanislav Korotky
This is an intraday indicator that uses conventional formulae for daily and weekly levels of pivot, resistance and support, but updates them dynamically bar by bar. It answers the question how pivot levels would behave if every bar were considered as the last bar of a day. At every point in time, it takes N latest bars into consideration, where N is either the number of bars in a day (round the clock, i.e. in 24h) or the number of bars in a week - for daily and weekly levels correspondingly. So,
Most of traders use resistance and support levels for trading, and many people draw these levels as lines that go through extremums on a chart. When someone does this manually, he normally does this his own way, and every trader finds different lines as important. How can one be sure that his vision is correct? This indicator helps to solve this problem. It builds a complete set of virtual lines of resistance and support around current price and calculates density function for spatial distributi
The indicator draws a histogram of important levels for several major currencies attached to the current cross rates. It is intended for using on charts of crosses. It displays a histogram calculated from levels of nearest extremums of related major currencies. For example, hidden levels for AUDJPY can be detected by analyzing extremums of AUD and JPY rates against USD, EUR, GBP, and CHF. All instruments built from these currencies must be available on the client. This is an extended version of
StatBars
Stanislav Korotky
The indicator provides a statistic histogram of estimated price movements for intraday bars. It builds a histogram of average price movements for every intraday bar in history, separately for each day of week. Bars with movements above standard deviation or with higher percentage of buys than sells, or vice versa, can be used as direct trading signals. The indicator looks up current symbol history and sums up returns on every single intraday bar on a specific day of week. For example, if current
PriceProbability
Stanislav Korotky
This is an easy to use signal indicator which shows and alerts probability measures for buys and sells in near future. It is based on statistical data gathered on existing history and takes into account all observed price changes versus corresponding bar intervals in the past. The statistical calculations use the same matrix as another related indicator - PointsVsBars. Once the indicator is placed on a chart, it shows 2 labels with current estimation of signal probability and alerts when signal
CCFpExtra
Stanislav Korotky
CCFpExtra is an extended version of the classic cluster indicator - CCFp. This is the MT4 version of indicator  CCFpExt available for MT5. Despite the fact that MT5 version was published first, it is MT4 version which was initially developed and tested, long before MT4 market was launched. Main Features Arbitrary groups of tickers or currencies are supported: can be Forex, CFDs, futures, spot, indices; Time alignment of bars for different symbols with proper handling of possibly missing bars, in
PriceProbabilities
Stanislav Korotky
This is a signal indicator for automatic trading which shows probability measures for buys and sells for each bar. It is based on statistical data gathered on existing history and takes into account all observed price changes versus corresponding bar intervals in the past. The core of the indicator is the same as in PriceProbablility indicator intended for manual trading. Unlike PriceProbability this indicator should be called from MQL4 Expert Advisors or used for history visual analysis. The in
FreqoMeterForecast
Stanislav Korotky
The main idea of this indicator is rates analysis and prediction by Fourier transform. Indicator decomposes exchange rates into main harmonics and calculates their product in future. You may use the indicator as a standalone product, but for better prediction accuracy there is another related indicator - FreqoMaster - which uses FreqoMeterForecast as a backend engine and combines several instances of FreqoMeterForecast for different frequency bands. Parameters: iPeriod - number of bars in the ma
FreqoMaster
Stanislav Korotky
The main idea of this indicator is rates analysis and prediction by Fourier transform. The indicator decomposes exchange rates into main harmonics and calculates their product in future. The indicator shows 2 price marks in history, depicting price range in the past, and 2 price marks in future with price movement forecast. Buy or sell decision and take profit size are displayed in a text label in the indicator window. The indicator uses another indicator as an engine for calculations - FreqoMet
ReturnAutoScaleMix
Stanislav Korotky
This is a very powerful indicator that provides a mix of three running totals of linear weighted returns. Each one is similar to a specific mode of ReturnAutoScale indicator. The result is a scaled superposition of three integrated and difference-stationary time series, each for different trading strategy. Indicator displays three lines: yellow - slow market returns, corresponds to mode 0 in ReturnAutoScale; blue - medium market returns, corresponds to mode 1 in ReturnAutoScale; red - fast marke
MovingFlatBreakout
Stanislav Korotky
This indicator monitors the market for a flat state and possible breakout. The flat state is detected as a predefined number of consecutive bars during which price fluctuates inside a small range. If one of the next bars closes outside the range, breakout is signaled. The indicator shows 3 lines: blue - upper bound of flat ranges AND consecutive breakout areas; red - lower bound of flat ranges AND consecutive breakout areas; yellow - center of flat ranges (NOT including breakout areas). When a b
筛选:
[删除] 2019.11.04 18:04 
 

用户没有留下任何评级信息

[删除] 2019.01.14 08:15 
 

用户没有留下任何评级信息

回复评论