WalkForwardBuilder MT5
- 实用工具
- 版本: 1.1
- 更新: 20 八月 2023

This script allows performing a walk-forward analysis of trading experts based on the data collected by the WalkForwardLight MT5 library. The script builds a cluster walk forward report and rolling walk forward reports that refine it, in the form of a single HTML page. This script is optional, as the library automatically generates the report immediate after the optimization in the tester is complete. However, the script is convenient because it allows using the same collected data to rebuild the HTML report, using other available optimization criteria, such as profit factor, drawdown, etc.
There is a similar script for MetaTrader 4 - WalkForwardBuilder.
A detailed User's Guide (in Russian) is available in the blog.
Input parameters
- Folder - name of the folder with the metadata files; is left blank, the script looks for the folder name in the WFL_FILE_ global variable created by the library;
- Estimator - optimization criterion; available values - wfo_profit, wfo_sharpe, wfo_pf, wfo_drawdown, wfo_profit_by_drawdown, wfo_profit_trades_by_drawdown, wfo_average;
Metrics in reports
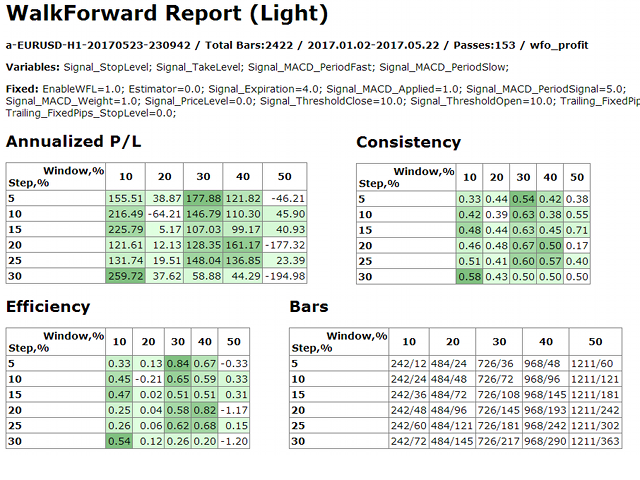
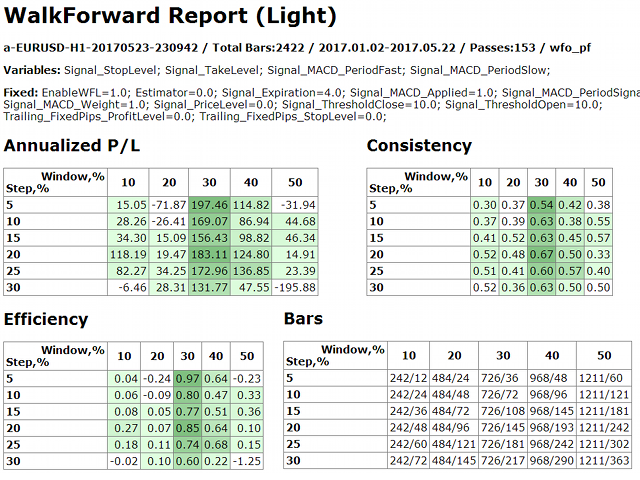
Cluster report
The cluster report at the top of the HTML page contains generalized tables of expert's forward testing results at different ombinations of the optimization window sizes and the forward testing step sizes. The columns correspond to the window sizes of 10%, 20%, 30%, 40%, 50% of the total date range in the tester settings. The rows correspond to the forward step sizes of 5%, 10%, 15%, 20%, 25%, 30% from the window size. All percentages are recalculated to bars (see the Bars table).
The cluster report consists of the following tables:
- annualized profit/loss - the hypothetical profit of the EA per year, with the earnings recalculated in proportion to the optimization and testing periods.
- efficiency - the ratio of the annual profit on testing period and optimization period of the same pass.
- consistency - percentage of profitable passes among all test passes of the "spliced" forward test.
- bars - the size of the window and step in bars.
All tables cells in the cluster report are links, clicking them allows to quickly navigate to the corresponding refinement report.
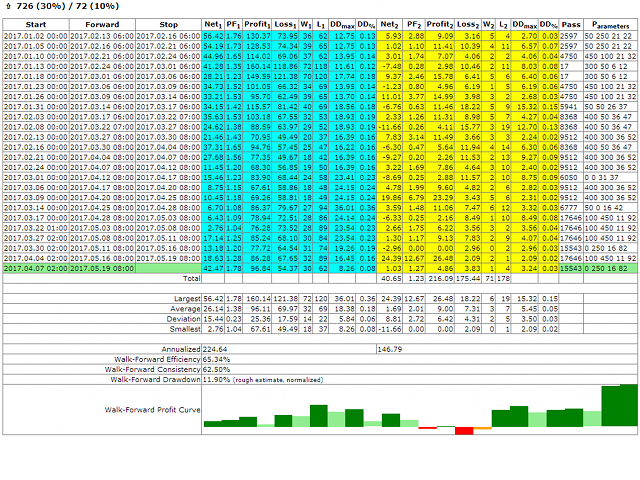
Refinement reports
The refinement report contains details of how the forward testing metrics were obtained for a particular combination of the size of the optimization window and the forward step. The rows in the refinement report correspond to the tester runs, where the best parameters for the optimization window were found. The results of the subsequent test on a forward step, calculated in the same tester run, are displayed in the same row.
The columns contain the start and end dates of the optimization window, the forward end date, as well as the following metrics for two periods at the same time - optimization window (blue background) and forward test (yellow background): profit, profit factor (Sharpe ratio can be selected), profit, loss, the number of successful and unsuccessful trades, as well as the drawdown in physical terms and in percentage terms. The right two columns show the tester pass number and the list of optimized parameter values.
It also displays the average, maximum, minimum values and variance; annual profit, efficiency, stability and drawdown of the cumulative forward test on all steps, as well as a schematic representation of the balance curve of the forward test.


用户没有留下任何评级信息