OrderBook Recorder

Order Book, known also as Market Book, market depth, Level 2, - is a dynamically updated table with current volumes of orders to buy and to sell specific financial instument at price levels near Bid and Ask.

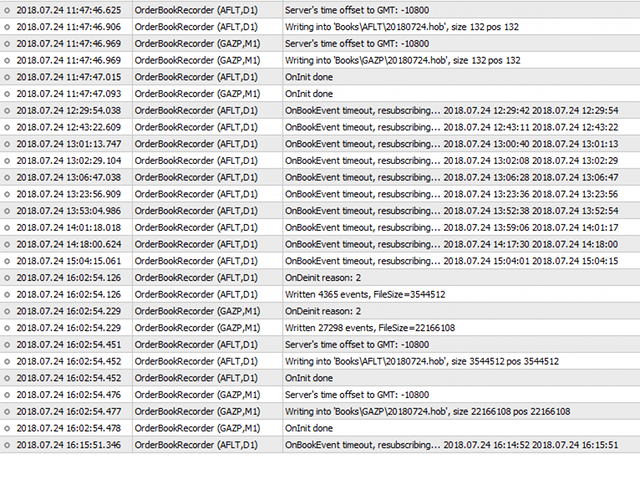
MetaTrader 5 provides the means for receiving market book from your broker in real time. The expert OrderBook Recorder records market book changes and stores them in local files for further usage in indicators and expert adviser, including testing in the tester.

The expert stores market book of the work symbol of the chart, where it's attached.

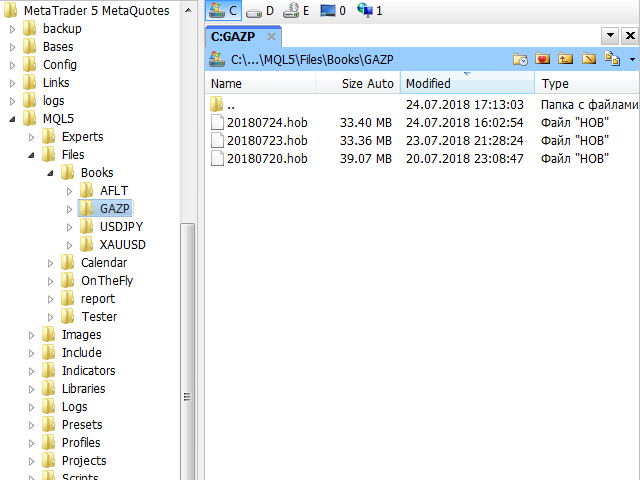
The files are created in the folder MQL5/Files/Books, where "Books" - is an adjustable name, given through a special input parameter (see below). Inside the folder another folder is created for every specific work symbol, which contains every day records in dedicated file YYYYMMDD.hob, where YYYY, MM, DD - year, month, day correspondingly. The extension "hob" stands for History of Order Book. For example, the ticker GAZP will produce the files MQL5/Files/Books/GAZP/*.hob.

The data from the files should be read by the library OrderBook History Library. In particular, this library is used for reading market books in the indicator OrderBook Cumulative Indicator and demo expert adviser OrderBook History Playback. The library is intended to embedding into your MQL programs (source codes of the programs are required).

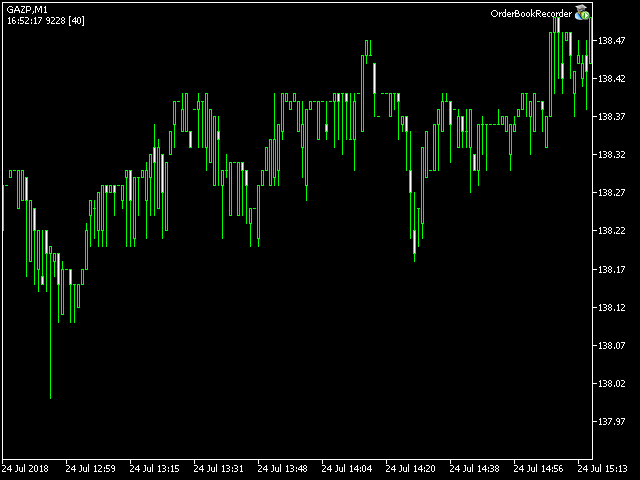
The expert adviser shows a comment like that:

YYYY.MM.DD HH:SS N [X]

YYYY.MM.DD HH:SS - date and time of the latest processed event;

N - total number of events written by the expert into current file since its start;

X - the size of the market book in the latest event;


Parameters

  • FileFolder - a string with the root folder name, where to place all files with market books for all symbols (in a separate subfolder for every symbol), by default - "Books";

Attention! Current server time is stored in the files "as is", preserving offset to GMT. Reading file archives for the same account or other accounts on the same server requires no further processing. However, if the archive is transferred to a terminal, connected to a server with different time zone (offset to GMT), one should properly adjust the parameter OrderBook_TimeZoneCorrection in the library OrderBook History Library. Please note, that the tester does always emulate a server with the timezone GMT+0, regardless of actual timezone of the quotes!

推荐产品
Order Book, known also as Market Book, market depth, Level 2, - is a dynamically updated table with current volumes of orders to buy and to sell specific financial instument at price levels near Bid and Ask. MetaTrader 5 provides the means for receiving market book from your broker, but in real time only, without access to its history. This expert adviser OrderBook History Playback allows you to playback the market book events on the history using files, created by OrderBook Recorder . The exper
FREE
Weis Waves
Flavio Javier Jarabeck
2.83 (18)
The original author is David Weis, an expert in the Wyckoff Method. The Weis Wave is a modern adaptation of the 1930's Wyckoff Method, another expert in Tape Reading techniques and Chart Analysis. Weis Waves takes market volume and stacks it into waves according to price conditions giving the trader valuable insights about the market conditions. If you want to learn more about this subject you can find tons of videos in YouTube. Just look for "The Wickoff Method", "Weis Wave" and "Volume Spread
FREE
Introduction Welcome to the world of Forex trading, where every tick of the market can be influenced by news events. Introducing our expert advisor for MetaTrader, your ultimate tool for navigating the complexities of news trading. This innovative advisor is specifically designed to automate your trading strategy during key macroeconomic releases, ensuring you never miss an opportunity.  When important indicators are announced, volatility often spikes, creating potential for profit. Our expert
FREE
Haven Volume Profile
Maksim Tarutin
4.55 (11)
Haven Volume Profile 是一个多功能的成交量剖面分析指标,帮助基于交易量分布识别关键价格水平。它旨在为专业交易者提供更深入的市场理解,并帮助识别重要的进出场点。 其他产品 ->  这里 主要功能: Point of Control (POC) 计算 - 最大交易活动水平,帮助识别最具流动性的水平 Value Area 定义(增加活动区)和可自定义的成交量百分比,帮助更准确地评估交易区间 支持tick成交量和实际成交量,适用于不同市场类型和交易策略 灵活的计算周期设置(天数),使工具能够适应任何时间范围 自动适应浅色和深色终端主题,提升用户界面的可视体验 清晰的水平可视化,支持自定义样式和颜色,便于图表分析和快速决策 该指标非常适合识别重要的价格水平和整合区,帮助交易者做出更加明智的交易决策。使用 Haven Volume Profile 有助于通过更准确的成交量和市场动态分析来降低风险并增加利润。
FREE
This robot sends Telegram notifications based on the coloring rules of PLATINUM Candle indicator. Example message for selling assets: [SPX][M15] PLATINUM TO SELL 11:45. Example message for buying assets : [EURUSD][M15] PLATINUM TO BUY 11:45 AM. Before enable Telegram notifications  you need to create a Telegram bot, get the bot API Key and also get your personal Telegram chatId. It's not possible to send messages to groups or channels. You can only send messages to your user chatId. You should
FREE
Aggression Volume
Flavio Javier Jarabeck
4.29 (17)
Aggression Volume Indicator is the kind of indicator that is rarely found in the MQL5 community because it is not based on the standard Volume data provided by the Metatrader 5 platform. It requires the scrutiny of all traffic Ticks requested on the platform... That said, Aggression Volume indicator requests all Tick Data from your Broker and processes it to build a very special version of a Volume Indicator, where Buyers and Sellers aggressions are plotted in a form of Histogram. Additionally,
FREE
BoxInside MT5
Evgeny Shevtsov
5 (4)
This indicator calculates the volume profile and places labels that correspond to the VAH, VAL and POC levels, for each candle individually. Indicator operation features The indicator works on the timeframes from M3 to MN, but it uses the history data of smaller periods: M1 - for periods from M3 to H1, M5 - for periods from H2 to H12, M30 - for the D1 period, H4 - for the W1 period, D1 - for the MN period. The color and location of the VAL, VAH and POC labels on the current candle are considere
FREE
Value Chart Candlesticks
Flavio Javier Jarabeck
4.57 (14)
The idea of a Value Chart indicator was presented in the very good book I read back in 2020 , " Dynamic Trading Indicators: Winning with Value Charts and Price Action Profile ", from the authors Mark Helweg and David Stendahl. The idea is simple and the result is pure genius: Present candlestick Price analysis in a detrended way! HOW TO READ THIS INDICATOR Look for Overbought and Oversold levels. Of course, you will need to test the settings a lot to find the "correct" one for your approach. It
FREE
Mirror Chart MT5
Andrej Hermann
5 (1)
The Mirror Chart MT5 is a overlay indicator specifically designed to project a second financial instrument directly onto the main chart window. This tool is invaluable for traders who rely on correlation analysis, as it visualizes the price movements of two different instruments in real time. Unlike traditional overlays, this indicator utilizes intelligent, dynamic centering and scaling logic. It continuously analyzes the visible price range in the current window for both symbols and calculates
FREE
Aggression Wave RSJ
JETINVEST
4.57 (7)
This indicator sums up the difference between the sells aggression and the buys aggression that occurred in each Candle, graphically plotting the waves of accumulation of the aggression volumes.   Through these waves an exponential average is calculated that indicates the direction of the business flow. Note: This indicator DOES NOT WORK for Brokers and/or Markets WITHOUT the type of aggression (BUY or SELL).   Be sure to try our Professional version with configurable features and alerts:  Agre
FREE
AntaresX Volume Profile — Indicator for MetaTrader 5 AntaresX Volume Profile is an indicator that displays the price levels where the highest trading activity was concentrated during a selected period, and calculates the historical probability of the price reacting when it reaches each of those levels. What the indicator draws The indicator identifies three levels on the chart: POC (Point of Control): the price where the highest trading activity was recorded during the selected period. Displaye
FREE
Volume Weighted Average Price or VWAP is an indicator wich shows different average prices on chart. This is very useful to find strong negotiation price areas and as trend following. Configurations: Day, Week and Month - Show different VWAPs according to the period. You can change each line style on "colors" tab. Any doubt or suggestion please contact us. Enjoy! This is a free indicator, but it took hours to develop. If you want to pay me a coffee, I appreciate a lot   <3 PayPal, Skrill, Nete
FREE
Aggression Volume Profile
Edson Cavalca Junior
4.55 (11)
This indicator plots the volume profile by Price on the chart There are 5 ways to view it: By Total Volume Traded (Premium Version); Volume Ticks(Forex) Separated by Buyers and Sellers (Premium Version); Buyers Only (Premium Version); Sellers Only (Premium Version); Business balance (Buyers - Sellers) (Premium Version); . It is possible to select how many days the profiles will be calculated.( Premium Version) On the current day it recalculates the histogram data for each new candlestick.
FREE
Cumulative Delta MT5
Evgeny Shevtsov
4.53 (62)
The indicator analyzes the volume scale and splits it into two components - seller volumes and buyer volumes, and also calculates the delta and cumulative delta. The indicator does not flicker or redraw, its calculation and plotting are performed fairly quickly, while using the data from the smaller (relative to the current) periods. The indicator operation modes can be switched using the Mode input variable: Buy - display only the buyer volumes. Sell - display only the seller volumes. BuySell -
FREE
Market Profile 3 ForexArby com
Hussien Abdeltwab Hussien Ryad
4 (15)
Market Profile 3 MetaTrader 5 indicator  version 4.70— is a classic Market Profile implementation that can show the price density over time, outlining the most important price levels, value area, and control value of a given trading session. This indicator can be attached to timeframes between M1 and D1 and will show the Market Profile for daily, weekly, monthly, or even intraday sessions. Lower timeframes offer higher precision. Higher timeframes are recommended for better visibility. It is als
FREE
Donchian Breakout And Rsi
Mattia Impicciatore
4.5 (2)
概述 本指标是经典 Donchian 通道 的增强版,增加了多种实用的交易功能。 除了标准的三条线(最高、最低和中线),系统能够检测 突破 ,并在图表上用箭头进行可视化标记,同时只显示 与当前趋势方向相反的那条线 ,让图表更加简洁。 功能包括: 可视化信号 :突破时在图表上绘制彩色箭头 自动通知 :弹窗、Push 推送和 Email 邮件 RSI 过滤 :根据市场相对强弱验证信号 个性化设置 :颜色、线条粗细、箭头符号、RSI 阈值等 工作原理 Donchian 通道计算: 上轨线 :最近 N 根已收盘 K 线的最高价 下轨线 :最近 N 根已收盘 K 线的最低价 中线 :最高价和最低价的平均值 看涨突破 :收盘价高于上轨线 看跌突破 :收盘价低于下轨线 指标会: 绘制三条 Donchian 通道线 仅在 方向变化后的首次突破 绘制箭头 隐藏顺应趋势方向的那条线(上涨趋势: 只显示红色下轨线;下跌趋势: 只显示绿色上轨线) 可选用 RSI 过滤突破信号,减少虚假突破 支持实时发送通知 参数说明 Donchian 通道设置 indPeriod :计算通道高低点的已收盘 K 线数量 Lin
FREE
This Tradepanel is an Utility for Traders Who want ot use Basic MoneyManagement for Calculation of Lotsize  I have created the basic edition only to give an Overview with Limited Functionality Full Features are available with  Auto TradePanel  Pro. (This is Only Because it can not be Tested in Strategy Tester ).  Complete Description is available at  "Auto TradePanel Pro".  in This Version Basic Functionality ( Calculation of Lotsize ) open /close Positions is working in the same way as in Pro
FREE
VM Auto SLTP Basic
Van Minh Nguyen
5 (1)
VM Auto SLTP Basic - Intelligent Trade Management for Scalpers Enhance your scalping strategy to a higher level. VM Auto SLTP Basic automatically manages Stop Loss and Take Profit for orders that are opened manually or by other Expert Advisors. This tool does not open trades on its own, allowing you to maintain full control while enjoying precise risk management. Key Features: SL/TP based on ATR or fixed price Automatic SL move to Breakeven Enhanced Breakeven system with 2 modes: Points and R (r
FREE
Tenet Support and Resistance Pro
Lucas De Melo Carvalho Cruz
Tenet Support & Resistance Pro 是一个用于 MetaTrader 5 的高级指标,旨在帮助交易者准确识别 关键市场支撑和阻力区域 。 基于价格历史,该指标会自动绘制水平线以突出战略区域。此外,它会在 实时显示蜡烛当前交易区域 ,提供对关键决策区域的清晰视图。 一个独特功能是 蜡烛旁边的倒计时器 ,精确显示当前K线收盘剩余时间——非常适合需要精确入场时机的价格行为交易者。 主要优势 自动识别 最相关的支撑和阻力区域 。 直观突出显示 蜡烛当前交易区域 。 内置倒计时器 ,实时显示在蜡烛旁。 完全 可配置 :选择生成线条所使用的时间框架(D1、H4、H1、M15、M5、M1)。 可自定义颜色 ,适用于每种线条类型、区域和倒计时器。 根据图表时间框架隐藏或显示线条。 智能系统,可 每日或用户指定时间自动重新计算 水平。 ️ 输入参数 一般设置 default_chart_view – 如果希望将图表视觉更改为 Tenet 默认(白色背景,绿色多头蜡烛,红色空头蜡烛),设置为 True。 chart_ID – 要分析的图表ID。 reset_
FREE
This indicator will mirror the assets in use in another metatrader, being able to choose the timeframe and a template. This is the Metatrader 5 Client, it needs the Metatrader 4 or 5 Server versions: Metatrader 4 Mirror Chart Server:   https://www.mql5.com/en/market/product/88644 Metatrader 5 Mirror Chart Server: https://www.mql5.com/en/market/product/88652 Details of how it works in the video.
FREE
Waves Sizer
Flavio Javier Jarabeck
3.86 (7)
Wyckoff fans, enjoy! Ideally to be used with the Weis Waves indicator, but it can be easily used alone, the Waves Sizer puts the range (in resulting Price movement) done by the Price on its market swings. You can control how accurate or loose will be the swings. This tool is very helpful for visually know how much the Price has traveled in your Timeframe. This way you can confront this level of effort with the resulting Volume, etc... Weis Waves indicator: https://www.mql5.com/en/market/produc
FREE
Position Size Tool – Smart Risk Management & Trade Execution Panel The Position Size Tool is a powerful and intuitive MT5 panel that simplifies your trading by combining position sizing , risk calculation , risk/reward visualization , and order placement —all in one place. ️ Clean & Functional Interface The tool features a compact, real-time panel with the following: Balance & Equity display Live Price tracking Customizable Risk % input Auto-calculated Lot Size based on SL and Risk Input for S
FREE
Trade assistant pro v8
Ahmed Mohammed Bakr Bakr
FREE FREE FREE Trade Assistant MT5 – Professional Trading & Risk Management Panel Trade Assistant MT5 is an advanced trading panel designed to help traders execute orders faster, safer, and more professionally . It simplifies manual trading by combining smart order management , precise risk control , and one-click execution , making it ideal for both beginners and advanced traders. This tool does not trade automatically . Instead, it empowers you with full control while applying professional-gra
FREE
DF Fib Trader Pro DF Fib Trader Pro 是一款專為 MetaTrader 5 設計的自動交易系統。 它使用基於斐波那契的價格水平,結合趨勢和結構分析來定義入場點和出場點。此 EA 支援多頭和空頭部位,並內建風險管理參數。 核心功能: • 使用斐波那契回檔和擴展邏輯來繪製入場點、停損點和獲利點。 • 可設定交易手數和停損/獲利水平 • 可選擇 1 或 2 個入場點 • 根據市場情況支持固定或動態停損和獲利 • 適用於多種時間範圍和貨幣對 • 包含最大點差、滑點和交易頻率控制選項 • 自動交易管理:損益兩平、追蹤停損與部分平倉選項 • 如有需要,支持市價單。 輸入概覽: • 風險管理:交易手數、單筆交易風險、最大交易數量 • 入場條件:斐波那契水平選擇、趨勢過濾選項 • 出場管理:停損/停盈類型、追蹤停損設定、損益平衡參數 • 交易過濾:價差限制、滑點容忍度 基本規則 • 點擊“繪製斐波那契”,並根據您的需求繪製斐波那契框。 • 您選擇的斐波那契程度會顯示出來(完全可設定) • 點擊“執行斐波那契”,即可立即建立掛單以及停損和止盈 • 設定完畢後,讓PA
FREE
High Low Open Close
Alexandre Borela
4.98 (44)
如果你象这个项目一样,就有5个饥饿审查。 这项指标采用了既定价格的公开、高、低价和关闭价格 可以对特定时间区加以调整。 许多机构和专业人士都认为这些是重要的。 贸易商可以为你了解他们可能更进一步的地点, 积极。 现有期间为: 前一日。 前一星期。 曾任Month。 曾任。 前一年。 或: 目前日。 目前周。 目前 Month。 目前配额。 今年。
FREE
LT Trade Panel Lite
Thiago Duarte
4.58 (53)
T Trade Panel Lite - Fast Execution & Free Trading Pad LT Trade Panel Lite   is the most practical and fastest trading pad for MetaTrader 5, designed for traders who seek total agility in manual execution. Perfect for Day Trading indices, stocks, and forex. This free version offers the essential tools for you to operate with professional precision at no cost. Key Features in the LITE Version: Instant Execution:   One-click Buy, Sell, and Close All (Flatten) buttons. Keyboard Shortcuts:
FREE
MW Volume
Martin Bittencourt
3.8 (5)
The Martinware Volume indicator plots a colored moving average over volume bars. The coloring uses three colors and can be done in different ways choosable by the user and is applied both to the average as to the volume bars. Three types of coloring are possible: None: no coloring is done Increasing or decreasing: changes the color depending on the current value being bigger or lesser than the previous one Volume relative to average: colors vary if the current volume is bigger or lesser then
FREE
Important Lines
Terence Gronowski
4.88 (24)
This indicator displays Pivot-Lines, preday high and low, preday close and the minimum and maximum of the previous hour. You just have to put this single indicator to the chart to have all these important lines, no need to setup many single indicators. Why certain lines are important Preday high and low : These are watched by traders who trade in a daily chart. Very often, if price climbs over or falls under a preday low/high there is an acceleration in buying/selling. It is a breakout out of a
FREE
VWAP Personnal Custom
Vincent Jose Proenca
VWAP_PC_MQL5 — 一个简单的自制 VWAP 类指标,在 MT5 图表上实时显示成交量加权平均价。 时间框架: 适用于所有周期。 品种: 兼容外汇、指数、大宗商品和股票。 参数: AppliedPrice – 用于计算的价格类型(收盘价、典型价、加权价等) LineColor / Width / Style – 线条样式设置 SessionReset – 可每日重置或连续模式 工作原理(VWAP 原理): VWAP(成交量加权平均价)计算公式为: VWAP = (价格 × 成交量之和) / (成交量之和) 它反映买卖双方的动态平衡: 价格 高于 VWAP → 多头占优; 价格 低于 VWAP → 空头占优。 简短结论: VWAP_PC_MQL5 是一个轻量级的 VWAP 工具,结构简单但实用,帮助学习和分析成交量行为。
FREE
VisualVol EURUSD
Maxim Kuznetsov
The indicator highlights the points that a professional trader sees in ordinary indicators. VisualVol visually displays different volatility indicators on a single scale and a common align. Highlights the excess of volume indicators in color. At the same time, Tick and Real Volume, Actual range, ATR, candle size and return (open-close difference) can be displayed. Thanks to VisualVol, you will see the market periods and the right time for different trading operations. This version is intended f
FREE
该产品的买家也购买
Trade Assistant MT5
Evgeniy Kravchenko
4.42 (210)
它有助于计算每笔交易的风险,容易安装新的订单,具有部分关闭功能的订单管理, 7 种类型的追踪止损和其他有用的功能。   附加材料和说明 安装说明   -   应用程序说明   -   模拟账户应用程序的试用版 线条功能  - 在图表上显示开仓线、止损线、止盈线。 有了这个功能,就可以很容易地设置一个新的订单,并在开仓前看到它的附加特性。   风险管理  - 风险计算功能在考虑到设定的风险和止损单的大小的情况下,计算新订单的成交量。它允许你设置任何大小的止损,同时观察设定的风险。 批量计算按钮 - 启用 / 禁用风险计算。 在 " 风险 " 一栏中设置必要的风险值,从 0 到 100 的百分比或存款的货币。 在 " 设置 " 选项卡上选择风险计算的变量: $ 货币, % 余额, % 资产, % 自由保证金, % 自定义, %AB 前一天, %AB 前一周, %AB 前一个月。   R/TP 和 R/SL - 设置止盈和止损的关系。 这允许你设置相对于损失的利润大小。 例如, 1 : 1 - 这决定了 TP = SL 的大小。 2 : 1 - 这意味着 TP 是 SL 的两倍。 RR -
欢迎来到 Trade Manager EA——这是一个终极风险管理工具,旨在使交易变得更直观、精准和高效。它不仅仅是一个下单工具,而是一个用于无缝交易计划、仓位管理和风险控制的全面解决方案。不论您是新手交易员、资深交易员,还是需要快速执行的剥头皮交易员,Trade Manager EA 都可以满足您的需求,适用于外汇、指数、大宗商品、加密货币等各种市场。 借助 Trade Manager EA,复杂的计算已成过去。只需分析市场,在图表上用水平线标记入场、止损和止盈,设置您的风险水平,Trade Manager 就会立即计算出理想的头寸规模,并实时显示以点、账户货币计价的止损和止盈。每笔交易都得以轻松管理。 主要功能: 头寸规模计算器 :根据定义的风险瞬间确定交易规模。 简单的交易计划 :在图表上用可拖动的水平线直接计划交易,设置入场、止损和止盈。 实时显示 SL 和 TP :以账户货币、点或分显示止损和止盈,便于分析。 高级保护工具 盈亏平衡选项 : 基本盈亏平衡 :当您的交易达到设定水平时自动保护利润。 多级盈亏平衡 :设置多达 4 个级别以逐步保护利润。 尾随止损选项 : 基本尾随
Local Trade Copier EA MT5
Juvenille Emperor Limited
4.96 (138)
通过 Local Trade Copier EA MT5 获得非常快速的交易复制体验。它的简单1分钟设置,使您可以在同一台Windows计算机或Windows VPS上在多个MetaTrader终端之间复制交易,具有闪电般快速的复制速度,低于0.5秒。 无论您是初学者还是专业交易者, Local Trade Copier EA MT5 都提供了广泛的选项,可根据您的特定需求进行自定义。对于任何希望增加利润潜力的人来说,这都是终极解决方案。 今天就尝试一下,看看为什么它是市场上最快、最简单的贸易复印机! 提示: 您可以在您的模拟账户中下载并试用 Local Trade Copier EA MT5 模拟版: 这里 将下载的免费演示文件粘贴到您的 MT5 >> 文件 >> 打开数据文件夹 >> MQL5 >> 专家文件夹并重新启动您的终端。  免费演示版本每次可在 4 小时内发挥全部功能,仅限演示帐户。 要重置试用期,请转至 MT5 >> 工具 >> 全局变量 >> Control + A >> 删除。 请仅在非关键模拟账户上执行此操作,不要在挑战道具公司账户中执行此操作。 如果您无法
TradePanel MT5
Alfiya Fazylova
4.87 (154)
交易面板是一款多功能交易助手。该应用包含超过50种手动交易功能,并允许您自动执行大多数交易任务。 在购买之前,您可以在演示账户上测试演示版本。下载用于演示账户的试用版应用程序: https://www.mql5.com/zh/blogs/post/762579 。 完整说明 这里 。 贸易. 只需单击一下即可执行交易操作: 打開掛單和頭寸,並自動計算風險。 一鍵打開多個訂單和頭寸。 打開訂單網格。 按組別關閉掛單和頭寸。 反轉頭寸方向(關閉買入>打開賣出,關閉賣出>打開買入)。 鎖定頭寸(通過開啟缺少的頭寸,使買入和賣出頭寸的數量相等)。 一鍵部分關閉所有頭寸。 將所有頭寸的止盈和止損設置在同一價格水平。 將所有頭寸的止損設置在盈虧平衡水平。 開倉時,可使用以下功能: 在多個訂單或倉位之間分配計算出的數量(在單擊一次時開啟多個訂單和倉位)。 在開啟訂單前在圖表上可視化交易水平。 僅在當前點差不超過設定值時才開啟倉位。 止盈和止損之間的自動比例。 虛擬止損和止盈。 自動將止損和止盈的大小增加為當前點差的大小。 基於ATR指標讀數計算止盈和止損。 設置掛單的到期日期。 為掛單設置追蹤(掛單
Farmed Hedge Yield Farming | All Markets (Manual - Hybrid - Semi/Automated EA) MULTI-ASSET SUPPORT Trade any asset available on your broker - Forex: Major, Minor, Exotic pairs - Crypto: BTC, ETH, XRP, SOL, BNB - Stocks: Apple, Tesla, Amazon, Google, etc. - Commodities: Gold, Silver, Oil, Gas - Indices: US30, NAS100, SPX500, DAX40 - Any CFD your broker offers VERIFIED TRADING RESULTS - Farmed Hedge Yield Axi Copy:  https://www.mql5.com/en/signals/2356376 - Farmed Hedge Yield Exn Copy:   https:/
Quant AI Agents is NOT AN Expert Advisor. Quant AI Agents   is a   multi-agent AI trading framework   that turns natural-language strategy prompts into live.  WANT THE SAME RESULTS AS MY LIVE SIGNAL?   Use the exact same brokers I do:   IC MARKETS , IC TRADING   .  Unlike the centralized stock market, Forex has no single, unified price feed.  Every broker sources liquidity from different providers, creating unique data streams. Other brokers can only achieve trading performance equivalent to 60
测试版发布 Telegram to MT5 Signal Trader 即将进入正式的 Alpha 版本。一些功能仍在开发中,您可能会遇到一些小错误。如果您遇到问题,请反馈,您的意见将帮助我们改进软件。 Telegram to MT5 Signal Trader 是一款强大的工具,能够将 Telegram 频道或群组的交易信号自动复制到您的 MetaTrader 5 账户。 支持公开和私人频道,可将多个信号提供者连接至一个或多个 MT5 账户。软件优化、高效、稳定,精准控制每笔复制交易。 界面简洁,仪表盘美观,图表交互性佳,导航直观。您可以管理多个信号账户,自定义每个提供者的设置,并实时监控所有操作。 系统需求 由于 MQL 限制,EA 需要配合 PC 端应用与 Telegram 通信。 安装程序可通过官方 安装指南 获取。 核心功能 多提供者支持: 从多渠道复制信号至多个 MT5 帐户 高级信号识别: 关键词、模式和标签全面自定义 逐提供者控制: 可启用/禁用特定信号类型、平仓策略等 灵活风险管理: 固定手数、固定金额、余额/权益百分比、部分平仓设置 可定制 SL/TP: 覆盖信号
Power Candles 策略扫描器——自优化多符号设置查找器 Power Candles策略扫描器 采用与Power Candles指标相同的自优化引擎,可同时扫描您“市场观察”中的所有交易品种。一个面板即可显示当前哪些品种在统计上具备交易价值、每种策略的最佳应用方向、最优止损/止盈组合,并在新信号触发时立即向您发送提醒。 本工具是 Stein Investments 生态系统的一部分 - 18+ 款工具,加上 Max,您的一对一 AI 交易导师。  随时在线,深入了解每一款指标,在您需要梳理思路的那一刻就在那里。  立即认识他: https://stein.investments 您的全面市场监控。每个交易品种超过3,000次自动优化。2种警报类型。一键切换图表并采取行动。 为何您需要此工具 大多数多标的扫描器仅展示价格 波动 。每只股票的波动率、百分比变化、RSI。您仍需自行摸索正确的策略、合适的止损位以及理想的入场阈值。Power Candles策略扫描器针对每只股票自动解答这些问题,仅在数学验证过的交易设置中触发实际入场信号时才会向您发出提示。这就是全部卖点。 自动
Exp COPYLOT CLIENT for MT5
Vladislav Andruschenko
3.91 (33)
适用于 MetaTrader 5 的专业交易复制器 快速、专业、稳定可靠的 交易复制器 ,适用于 MetaTrader 。 COPYLOT 可在 MT4 和 MT5 终端之间复制 Forex 交易,并支持 Hedge 和 Netting 账户。 COPYLOT 的 MT5 版本支持: - MT5 Hedge → MT5 Hedge - MT5 Hedge → MT5 Netting - MT5 Netting → MT5 Hedge - MT5 Netting → MT5 Netting - MT4 → MT5 Hedge - MT4 → MT5 Netting MT4 版本 完整说明 + DEMO + PDF 如何购买 如何安装 如何获取日志文件 如何测试和优化 Expforex 的所有产品 您也可以将交易复制到 MT4 终端(MT4 → MT4,MT5 → MT4): COPYLOT CLIENT for MT4 COPYLOT 是一款专业的交易和持仓复制器,可同时与 2、3 甚至 10 个终端协同工作。 支持从 模拟账户和投资者账户 复制,也支持同时在多个终端上运行。 您可以使
Trade Dashboard MT5
Fatemeh Ameri
4.94 (125)
疲于复杂的订单下达和手动计算?Trade Dashboard 是您的解决方案。凭借其用户友好的界面,订单下达变得轻而易举,只需点击一下,您就可以开设交易、设置止损和止盈水平、管理交易手数,并计算风险回报比,让您只需专注于您的策略。告别手动计算,使用 Trade Dashboard 简化您的交易体验。 立即下载演示版本 。 您可以在这里找到仪表盘功能和特性的详细信息 。 加入 Telegram 频道 。 购买后请给我发消息以获取支持。如果您需要添加更多功能,可以在产品的评论区留下您的想法,我愿意听取任何建议,希望您能在使用我的产品时获得最佳体验 。 这是 MT4 版本。 风险管理:使用 Trade Dashboard,可以将您的风险设置为账户余额或权益的百分比,或将风险设置为总金额。在图表上直观地定义您的止损,让工具准确计算每个货币对的适当手数。该工具还可以根据您期望的风险回报比自动设置止盈水平。它甚至可以在手数计算中涵盖佣金和点差费用。此外,您的止损和止盈可以转变为虚拟水平,隐藏于经纪商。通过 Trade Dashboard 的高级风险管理功能,掌控风险,保护您的资本。 交易线
Trade copier MT5
Alfiya Fazylova
4.53 (43)
Trade Copier 是一种专业实用程序,旨在复制和同步交易账户之间的交易。 复制发生从供应商的帐户/终端到收件人的帐户/终端,安装在同一台计算机或 vps 上。 促销活动 - 如果您已经购买了“Trade copier MT5”,您可以免费获取“Trade copier MT4”(用于 MT4 > MT5 和 MT4 < MT5 的复制)。欲了解更多详细条款,请通过私人消息与我们联系! 在购买之前,您可以在演示帐户上测试演示版本。 演示 这里 。 完整说明 这里 。 主要功能和优点: 支持复制MT5>MT5、MT4>MT5、MT5>MT4,包括МТ5 netting账户。 供应商和收件人模式在同一产品中实现。 简单直观的界面,允许您直接从图表中实时控制复制。 连接中断或终端重新启动时不会丢失设置和位置。 允许您选择要复制的符号,也可以替换接收者的符号,例如 EURUSD> USDJPY。 支持回拷贝。 能够仅复制某些订单。 允许您设置开仓交易价格的最大差异和最大时间延迟。 正确复制部分订单关闭的执行。 计算复制手数的几种方法。 同步止盈和止损。有几种方法可以计算它们的位置。 支持
YuClusters
Yury Kulikov
4.93 (43)
Attention: You can view the program operation in the free version  YuClusters DEMO .  YuClusters is a professional market analysis system. The trader has unique opportunities to analyze the flow of orders, trade volumes, price movements using various charts, profiles, indicators, and graphical objects. YuClusters operates on data based on Time&Sales or ticks information, depending on what is available in the quotes of a financial instrument. YuClusters allows you to build graphs by combining da
Premium Trade Manager - MetaTrader 5 的快速、纪律化交易管理工具 Premium Trade Manager 是一款专为 MetaTrader 5 设计的快速图表面板,它接管了每笔交易中所有机械性的工作。您决定方向、品种和时机 - 面板根据您的风险计算仓位大小、下单并附带止损和目标位、分批减仓出场、移动止损,并为您监控经济日历。内置的新闻智能系统更进一步:它根据事件对市场的实际测量影响来评分,而不是固定标签。一个面板,管理您持有的每一笔仓位,每笔交易都遵循同样纪律严明的例程。 购买前先亲手体验。 通过交互式 walkthrough,您可以直接在浏览器中点击实时面板操作 - 这是在购买前感受其运作方式的最快途径。 stein.investments/products/premium-trade-manager Premium Trade Manager 是 Stein Investments 生态系统的一部分 - 20 余款交易工具,以及 Max,您的一对一 AI 交易导师。  全天候在线,深入了解每一款 Stein 指标,随时准备好与您一起梳理每一
MT5 to Telegram Signal Provider 是一个易于使用且完全可自定义的工具,它允许向 Telegram 的聊天室、频道或群组发送 指定 的信号,将您的账户变为一个 信号提供商 。 与大多数竞争产品不同,它不使用 DLL 导入。 [ 演示 ] [ 手册 ] [ MT4 版本 ] [ Discord 版本 ] [ Telegram 频道 ]  New: [ Telegram To MT5 ] 设置 提供了逐步的 用户指南 。 不需要了解 Telegram API;开发者提供了您所需的一切。 关键特性 能够自定义发送给订阅者的订单详情 您可以创建分层的订阅模型,例如铜、银、金。其中金订阅获得所有信号等。 通过 id、符号或评论过滤订单 包括执行订单的图表截图 在发送的截图上绘制已关闭的订单,以便额外核实 延迟发送新订单消息的可能性,以便在发送前对位置进行调整 订单详情完全透明: 新的市场订单*带截图 订单修改(止损、获利) 已关闭的订单*带截图 部分关闭的订单** 新的挂单 修改的挂单(进场价格) 挂单激活(作为新的市场订单附加) 已删除的挂单 历史订单报告
AXR Prop Guard
Stoyan Kirilov Karlov
AXR Prop Guard AXR Prop Guard 是一款面向 MetaTrader 5 的账户级风险保护工具。它适用于 prop firm 交易者、funded account challenges,以及需要严肃管理风险的个人账户。 它属于 AXR 工具系列。如需获取更新和联系选项,请使用官方 MQL5 页面: AXR MQL5 Channel: 产品更新、发布说明和新的 AXR 工具 Telegram: 打开卖家资料 ;Telegram 联系方式写在资料说明中。 购买后,请通过私人消息联系我,以获取用户手册和可用的 set files。 核心问题: 这个账户是否仍然处在已配置的风险规则范围内?如果当前交易触发 Stop Loss,还可能出现什么风险? 为什么有帮助 许多 funded account 失败并不是因为缺少入场信号,而是因为规则被触发或违反:Daily Loss、Maximum Loss、缺少 Stop Loss、开放风险过高、点差过大、新闻窗口、周末风险、consistency rules,或者只是账户状态不够清晰。 AXR Prop Guard 会把这
Seconds Chart MT5
Boris Sedov
4.59 (17)
秒级图表 (Seconds Chart) - 一款专为 MetaTrader 5 设计的独特工具,用于创建秒级时间框架的图表。 通过 秒级图表 ,您可以构建以秒为单位的时间框架图表,获得标准分钟或小时图表无法提供的极致灵活性和分析精度。例如,时间框架 S15 表示每根蜡烛图持续15秒。您可以使用任何支持自定义交易品种的指标和EA交易系统。操作它们就像在标准图表上交易一样方便。 与标准工具不同, 秒级图表 让您能够在超短时间框架下进行高精度交易,无延迟干扰。 秒级图表的优势 支持 1至900秒 的时间框架图表。 基于内置的实时报价数据库, 即时加载 历史数据。 数据实时更新, 无延迟或滞后 。 可同时创建 多个秒级图表 。 秒级图表的理想应用场景 剥头皮交易 和高频交易。 精确的入场和出场时机。 在短时间框架下测试交易策略。 时间框架设置 默认设置包含以下时间框架: S1、S2、S3、S4、S5、S6、S10、S12、S15、S20、S30 。 您可轻松自定义时间框架组合,只需按升序列出 1至900秒 的数值且避免重复即可。 其他免费工具 快速交易管理器 ( Quick Trade Ma
AntiOverfit PRO MT5
Enrique Enguix
5 (4)
在购买 EA 之前,先确认它到底是真的扛得住,还是只是刚好在回测里走运。 大多数机器人都是靠一份漂亮的回测卖出去的。 曲线一路向上。 Profit Factor 很好看。 看起来几乎没有疑点。 但即便如此,很多 EA 只要市场不再按照那段历史那样运行,很快就会出问题。 为什么? 因为回测只能证明一件事: 这个策略曾经在某一条特定的价格路径上有效。 它不能证明它在其他路径下也能扛住。 不能证明它足够稳健。 更不能证明它值得你花钱。 因为你买 EA,不是为了欣赏过去那条漂亮的曲线。 你买它,是为了在会变化的市场里使用它。 AntiOverfit PRO 是做什么的 AntiOverfit PRO 帮你判断一个 MetaTrader 5 Expert Advisor 到底是真的够扎实,还是只是恰好适配某一段特定历史。 它的原理其实很容易理解: 它拿真实历史数据,生成许多与原始历史相似、但路径不同的版本,然后让你看到当市场不再完全照着原来的路线走时,这个 EA 会有什么表现。 如果你只是稍微改变一下市场路径,这个机器人就开始失效,那就是个坏信号。 而如果它在许多与原始历史相似的场景里都能稳住
Copy Cat More Trade Copier MT5 (复制猫MT5) 是一个本地跟单软件,也是一个完整的风险管理和执行框架,专为当今的交易挑战而设计。从资金管理公司挑战到个人投资组合管理,它能适应各种情况,结合了稳健的执行、资本保护、灵活配置和高级交易处理功能。 该跟单软件可在主端(发送方)和从端(接收方)模式下工作,实时同步市价单和挂单、交易修改、部分平仓和对冲平仓操作。它兼容模拟和实盘账户、交易或投资者登录,并通过持久的交易记忆系统确保恢复功能,即使EA、终端或VPS重启也不例外。可以同时管理多个主端和从端,使用唯一ID,并通过前缀/后缀调整或自定义品种映射自动处理跨经纪商差异。 手册/设置  | Copy Cat More MT4 | 频道  特色功能: 易于设置——快至30秒(见视频)。 快速、稳定、准确——Turbo模式下低延迟复制(见截图)。 高安全性——不使用潜在危险的DLL或WebRequest。 持久交易记忆,避免孤立、丢失或不准确的交易。 可从手动或EA复制,支持所有账户类型。 品种自动前缀/后缀,快速设置;支持MT4和MT5之间复制。 非常灵活的多主端
HINN MagicEntry Extra
ALGOFLOW OÜ
4.71 (14)
HINN MAGIC ENTRY – the ultimate tool for entry and position management! Place orders by selecting a level directly on the chart! full description   ::  demo-version  :: 60-sec-video-description Key features: - Market, limit, and pending orders - Automatic lot size calculation - Automatic spread and commission accounting - Unlimited partitial take-profits  - Breakeven and trailing stop-loss and take-profit  functions - Invalidation leves - Intuitive, adaptive, and customizable interface - Works
Timeless Charts
Samuel Manoel De Souza
5 (5)
Timeless Charts is an all-in-one trading utility for professional traders. It combines custom chart types such as Seconds Charts and Renko with advanced order flow analysis using Footprints , Clusters , Volume Profiles , VWAP studies, and anchored analysis tools for deeper market insight. Trading and position management are handled directly from the chart through an integrated trade management panel , while Market Replay and Virtual Accounts provide environments for practicing trading skills and
Footprint Chart Pro — Professional OrderFlow EA for MetaTrader 5 Version 6.34 | Professional tool for real traders | Institutional-Grade Visualization DEMO USERS - PLEASE SELECT EVERY TICK / REAL TICK WHEN TESTING AND YOU HAVE DOWNLOADED HISTORICAL DATA. IF YOU SEE A WAITING SCREEN AND IT IS NOT DOWNLOADING, IT MEANS YOU HAVE LOW HISTORICAL DATA. TRY 1 MIN AND 5 MIN FIRST ON 1 DAY DATA. ONE DAY DATA SHOULD BE THE NEWEST AND MOST CURRENT DATE. PLEASE WAIT UNTIL THE MARKET HAS ROLLED OVER PERIOD.
Anchor Trade Manager
Kalinskie Gilliam
5 (2)
Anchor: The EA Manager Run your full EA portfolio without conflicts, without stacked risk, and without watching every chart yourself. Anchor coordinates up to 64 Expert Advisors on a single account so only one trades at a time. Attach Anchor to any chart. Type your EA names and magic numbers in one line. Anchor handles the rest. Built for portfolios. Built for discipline. Built for prop firms. The Problem Running multiple EAs on the same account creates risk. Two gold EAs can open opposite posit
The Ultimate TradingView to MT5 Bridge Automation 告别手动交易和延迟问题。 TradingView to MT5 Copier PRO 是最快、最可靠的桥接工具,可直接在 MetaTrader 5 上执行您的 TradingView 警报。无论您使用的是自定义指标、策略测试脚本还是手动绘图,该 EA 都能利用 高速 WebSocket 技术 瞬间执行您的交易。 与简单的跟单工具不同,此 PRO 版本包含 Arena Statistics —— 一个内置的专业仪表板,可直接在图表上分析您的交易表现、回撤(Drawdown)和夏普比率。 主要功能 跟单交易 (Trade Copier) 超快速执行: 使用 WebSocket 连接(比标准 WebRequest 更快),最大限度地减少滑点。 通用经纪商支持: 适用于 任何经纪商 和 自营交易公司 (Prop Firm) (如 FTMO, MyForexFunds 等)。您无需在两个平台上使用相同的经纪商。 智能资产映射: 自动检测并映射代码(例如,将 XAUUSD 转换为 GOLD.pro,
Bots Builder Pro MT5
Andrey Barinov
4.17 (6)
This is exactly what the name says. Visual strategy builder . One of a kind. Turn your trading strategies and ideas into Expert Advisors without writing single line of code. Generate mql source code files with a few clicks and get your fully functional Expert Advisors, which are ready for live execution, strategy tester and cloud optimization. There are very few options for those who have no programming skills and can not create their trading solutions in the MQL language. Now, with Bots Builde
The product will copy all telegram signal to MT5 ( which you are member) , also it can work as remote copier.  Easy to set up, copy order instant, can work with almost signal formats, image signal,  s upport to translate other language to English Work with all type of channel or group, even channel have "Restrict Saving Content", work with  multi channel, multi MT5 Work as remote copier: with signal have ticket number, it will copy exactly via ticket number. Support to backtest signal. How to s
Ultimate Extractor
Clifton Creath
5 (9)
Ultimate Extractor - Professional Trading Analytics for MT5 *****this is the local HTML version of Ultimate Extractor. !!!!!it is not compatible with Cloud!!!! For the online version please reach out to me directly****** Ultimate Extractor transforms your MetaTrader 5 trading history into actionable insights with comprehensive analytics, interactive charts, and real-time performance tracking. What It Does Automatically analyzes your MT5 trading history across all Expert Advisors and generates
AlgoRadar
Stephen J Martret
5 (4)
AlgoRadar is an on-chart analytics dashboard for MT5 that aggregates Expert Advisor performance across multiple accounts, brokers, and platforms, including both MT4 and MT5 data, into a single live view on your MT5 chart. All analysis runs from the chart interface, with no external applications or manual report processing required. EA Analysis and Ranking For traders running multiple Expert Advisors, AlgoRadar provides a consolidated view of each EA's performance across accounts. Active EAs a
MetaTrader 5 专业交易面板 —— 图表与键盘一键交易的高效控制中心 一款面向主动交易者的专业 Trading Panel,可让您比标准 MetaTrader 操作方式更快、更直观地完成开仓、平仓、修改、管理与控制。 这不是一个普通的小工具,而是一个为高频手动操作、仓位管理、挂单控制与利润管理而设计的完整交易工作台。 通过这套面板,您可以直接在图表上一键执行交易,通过键盘快速触发核心操作,并借助自动参数计算、图形提示、信息标签以及可视化管理功能,大幅减少重复性操作,让整个交易流程更加流畅、高效且专业。 使用我们的交易面板,您可以直接从图表上一键下单,执行交易操作的速度可比标准 MetaTrader 控件快约 30 倍。 MT4 版本 | 完整说明 + DEMO + PDF | 如何购买 | 如何安装 | 如何获取日志文件 | 如何测试与优化 | Expforex 的所有产品 为什么交易者会选择这套面板 图表一键交易 ,并支持键盘快速操作 快速完成开仓、平仓、修改、反转、锁仓与部分平仓 深度控制仓位、挂单、总利润与风控逻辑 自动参数计算,减少手动输入与重复劳动 图表可视化管理
Advanced Dashboard Ultra
Mirel Daniel Gheonu
5 (2)
MT5 统计仪表板 & 交易日志 ULTRA (Stats Dashboard & Journal ULTRA) 完整的交易指挥中心:分析、自动化与新闻情报。 Stats Dashboard ULTRA 是 Pro 分析工具的终极进化版。它将 MetaTrader 5 转化为专业的交易工作站,结合了机构级的绩效分析、自动新闻保护和高级心理指标。专为需要全面掌控的手动交易者和 EA 组合经理设计。 ULTRA 版本新功能 新闻情报引擎 (News Intelligence Engine): 不仅是看新闻——而是分析它。仪表板会模拟过去的新闻事件如何影响您的未平仓交易,告诉您是应该持有还是平仓。 EA 机器人卫士 (Bot Guard): 在高影响力新闻期间自动暂停您的其他智能交易系统 (EA),并在市场平静后重新启动它们。 真实权益回撤 (True Equity Drawdown): 基于日内浮动亏损 (MAE) 计算风险,而不仅仅是已结余额,为您提供真实的风险图景。 心理与效率评分: 游戏化的指标,衡量您的纪律性、交易效率 (MFE 捕获率) 和错误成本。 魔术编号 (Magic Nu
Telegram to MT5 Multi-Channel Copier 自动将您 Telegram 频道中的交易信号直接复制到 MetaTrader 5。无需机器人、无需浏览器扩展、无需手动复制。您在 Telegram 上收到信号,EA 会在几秒钟内在您的终端打开交易。 产品包含两个组件:一个监听 Telegram 频道的 Windows 应用程序,以及在您的 MT5 终端上执行信号的 EA。也提供 MT4 版本。 安装指南和应用程序下载: https://www.mql5.com/en/blogs/post/768988 工作原理 Windows 应用程序使用您自己的 API 凭据连接到 Telegram — 不是机器人。这意味着它可以读取您订阅的任何频道、群组或论坛主题,包括私人和 VIP 频道。当检测到信号时,它会解析并发送给 EA。EA 根据您的经纪商解析品种名称,根据您的风险设置计算手数,并打开交易。 整个过程是自动的。您不需要坐在电脑前。 打开应用程序并登录 Telegram(仅首次需要)。 选择您想要监听的频道或主题。 按 Start。EA 负责其余工作。 支持的信号格
作者的更多信息
WalkForwardOptimizer MT5
Stanislav Korotky
3.78 (9)
WalkForwardOptimizer library allows you to perform rolling and cluster walk-forward optimization of expert advisers (EA) in MetaTrader 5. To use the library include its header file WalkForwardOptimizer.mqh into your EA source code, add call provided functions as appropriate. Once the library is embedded into EA, you may start optimization according to the procedure described in the User guide . When it's finished, intermediate results are saved into a CSV file and some special global variables.
RenkoFromRealTicks
Stanislav Korotky
4.67 (3)
This non-trading expert utilizes so called custom symbols feature ( available in MQL API as well) to build renko charts based on history of real ticks of selected standard symbol. RenkoFromRealTicks generates custom symbol quotes, thus you may open many charts to apply different EAs and indicators to the renko. It also transmits real ticks to update renko charts in real time. The generated renko chart uses M1 timeframe. It makes no sense to switch the renko chart to a timeframe other than M1. T
SyntheticIndices
Stanislav Korotky
The indicator compares quotes of a given symbol and a synthetic quote calculated from two specified referential symbols. The indicator is useful for checking Forex symbol behavior via corresponding stock indices and detecting their convergence/divergence which can forecast future price movements. The main idea is that all stock indices are quoted in particular currencies and therefore demonstrate correlation with Forex pairs where these currencies are used. When market makers decide to "buy" one
ADXS
Stanislav Korotky
5 (3)
Ever wondered why standard ADX is made unsigned and what if it would be kept signed? This indicator gives the answer, which allows you to trade more efficient. This indicator calculates ADX values using standard formulae, but excludes operation of taking the module of ADX values, which is forcedly added into ADX for some reason. In other words, the indicator preserves natural signs of ADX values, which makes it more consistent, easy to use, and gives signals earlier than standard ADX. Strictly s
AutomaticZigZag
Stanislav Korotky
4.5 (2)
This is a non-parametric ZigZag providing 4 different methods of calculation. Upward edge continues on new bars while their `highs` are above highest `low` among previous bars, downward edge continues on next bars while their `lows` are below lowest `high` among previous; Gann swing: upward edge continues while `highs` and `lows` are higher than on the left adjacent bar, downward edge continues while `highs` and `lows` are lower than on the left adjacent bar. Inside bars (with lower `high` and
FREE
CustomVolumeDelta
Stanislav Korotky
5 (1)
This indicator displays volume delta (of either tick volume or real volume) encoded in a custom symbol, generated by special expert advisers, such as RenkoFromRealTicks . MetaTrader does not allow negative values in the volumes, this is why we need to encode deltas in a special way, and then use CustomVolumeDelta indicator to decode and display the deltas. This indicator is applicable only for custom instruments generated in appropriate way (with signed volumes encoded). It makes no sense to ap
FREE
VolumeDeltaM1 MT5
Stanislav Korotky
This indicator provides the analysis of tick volume deltas. It monitors up and down ticks and sums them up as separate volumes for buys and sells, as well as their delta volumes. In addition, it displays volumes by price clusters (cells) within a specified period of bars. This indicator is similar to VolumeDeltaMT5 , which uses almost the same algorithms but does not process ticks and therefore cannot work on M1. This is the reason for VolumeDeltaM1 to exist. On the other hand, VolumeDeltaMT5 ca
Order Book, known also as Market Book, market depth, Level 2, - is a dynamically updated table with current volumes of orders to buy and to sell specific financial instument at price levels near Bid and Ask. MetaTrader 5 provides the means for receiving market book from your broker, but in real time only, without access to its history. This expert adviser OrderBook History Playback allows you to playback the market book events on the history using files, created by OrderBook Recorder . The exper
FREE
This is a demo version of a non-trading expert , which utilizes so called the custom symbols feature ( available in MQL as well ) to build renko charts based on historical quotes of selected standard symbol and to refresh renko in real-time according to new ticks. Also it translates real ticks to the renko charts, which allows other EAs and indicators to trade and analyze renko. Place the EA on a chart of a working instrument. The lesser timeframe of the source chart is, the more precise resulti
FREE
This script allows performing a walk-forward analysis of trading experts based on the data collected by the WalkForwardLight MT5 library. The script builds a cluster walk forward report and rolling walk forward reports that refine it, in the form of a single HTML page. This script is optional, as the library automatically generates the report immediate after the optimization in the tester is complete. However, the script is convenient because it allows using the same collected data to rebuild th
FREE
WalkForwardDemo MT5
Stanislav Korotky
WalkForwardDemo is an expert adviser (EA) demonstrating how the built-in library WalkForwardOptimizer (WFO) for walk-forward optimization works. It allows you to easily optimize, view and analyze your EA performance and robustness in unknown trading conditions of future. You may find more details about walk-forward optimization in Wikipedia . Once you have performed optimization using WFO, the library generates special global variables (saved in an "archived" file with GVF-extension) and a CSV-f
FREE
HZZM
Stanislav Korotky
4 (1)
This is an adaptive ZigZag based on modification of  HZZ indicator (original source code is available in this article ). Most important changes in this version: two additional indicator buffers added for zigzag evolution monitoring - they show cross signs at points where zigzag direction first changes; zigzag range (H) autodetection on day by day basis; time-dependent adjustment of zigzag range. Parameters: H - zigzag range in points; this parameter is similar to original HZZ, but it can take 0
FREE
Comparator
Stanislav Korotky
4.75 (4)
This indicator compares the price changes during the specified period for the current symbol and other reference symbol. It allows to analyze the similar movements of highly correlated symbols, such as XAUUSD and XAGUSD, and find their occasional convergences and divergences for trading opportunities. The indicator displays the following buffers: light-green thick line - price changes of the current symbol for TimeGap bars; light-blue thin line - price changes of the reference symbol ( LeadSymbo
FREE
ReturnAutoScale
Stanislav Korotky
5 (2)
The indicator calculates running total of linear weighted returns. It transforms rates into integrated and difference-stationary time series with distinctive buy and sell zones. Buy zones are shown in blue, sell zones in red. Parameters: period - number of bars to use for linear weighted calculation; default value - 96; smoothing - period for EMA; default value - 5; mode - an integer value for choosing calculation mode: 0 - long term trading; 1 - medium term trading; 2 - short term trading; defa
FREE
OrderBook Utilities is a script, which performs several service operations on order book hob-files, created by OrderBook Recorder . The script processes a file for work symbol of the current chart. The file date is selected by means of the input parameter CustomDate (if it's filled in) or by the point where the script is dropped on the chart. Depending from the operation, useful information is written into the log, and optionally new file is created. The operation is selected by the input parame
FREE
SOMFX1Builder
Stanislav Korotky
5 (1)
If you like trading by candle patterns and want to reinforce this approach by modern technologies, this script is for you. In fact, it is a part of a toolbox, that includes a neural network engine implementing Self-Organizing Map (SOM) for candle patterns recognition, prediction, and provides you with an option to explore input and resulting data. The toolbox contains: SOMFX1Builder  - this script for training neural networks; it builds a file with generalized data about most characteristic pric
FREE
Year2Year
Stanislav Korotky
This indicator shows price changes for the same days in past years. D1 timeframe is required. This is a predictor indicator that finds D1 bars for the same days in past 8 years and shows their relative price changes on the current chart. Parameters: LookForward - number of days (bars) to show "future" price changes; default is 5; Offset - number of days (bars) to shift back in history; default is 0; ShowAverage - mode switch; true - show mean value for all 8 years and deviation bounds; false - s
FREE
PointsVsBars
Stanislav Korotky
This indicator provides a statistical analysis of price changes (in points) versus time delta (in bars). It calculates a matrix of full statistics about price changes during different time periods, and displays either distribution of returns in points for requested bar delta, or distribution of time deltas in bars for requested return. Please, note, that the indicator values are always a number of times corresponding price change vs bar delta occurred in history. Parameters: HistoryDepth - numbe
FREE
Mirror
Stanislav Korotky
This indicator predicts rate changes based on the chart display principle. It uses the idea that the price fluctuations consist of "action" and "reaction" phases, and the "reaction" is comparable and similar to the "action", so mirroring can be used to predict it. The indicator has three parameters: predict - the number of bars for prediction (24 by default); depth - the number of past bars that will be used as mirror points; for all depth mirroring points an MA is calculated and drawn on the ch
If you like trading crosses (such as AUDJPY, CADJPY, EURCHF, and similar), you should take into account what happens with major currencies (especially, USD and EUR) against the work pair: for example, while trading AUDJPY, important levels from AUDUSD and USDJPY may have an implicit effect. This indicator allows you to view hidden levels, calculated from the major rates. It finds nearest extremums in major quotes for specified history depth, which most likely form resistence or support levels, a
EvoLevels
Stanislav Korotky
The indicator displays most prominent price levels and their changes in history. It dynamically detects regions where price movements form attractors and shows up to 8 of them. The attractors can serve as resistance or support levels and outer bounds for rates. Parameters: WindowSize - number of bars in the sliding window which is used for detection of attractors; default is 100; MaxBar - number of bars to process (for performance optimization); default is 1000; when the indicator is called from
ExtraMovingPivots
Stanislav Korotky
This is an intraday indicator that uses conventional formulae for daily and weekly levels of pivot, resistance and support, but updates them dynamically bar by bar. It answers the question how pivot levels would behave if every bar were considered as the last bar of a day. At every point in time, it takes N latest bars into consideration, where N is either the number of bars in a day (round the clock, i.e. in 24h) or the number of bars in a week - for daily and weekly levels correspondingly. So,
Most of traders use resistance and support levels for trading, and many people draw these levels as lines that go through extremums on a chart. When someone does this manually, he normally does this his own way, and every trader finds different lines as important. How can one be sure that his vision is correct? This indicator helps to solve this problem. It builds a complete set of virtual lines of resistance and support around current price and calculates density function for spatial distributi
The indicator draws a histogram of important levels for several major currencies attached to the current cross rates. It is intended for using on charts of crosses. It displays a histogram calculated from levels of nearest extremums of related major currencies. For example, hidden levels for AUDJPY can be detected by analyzing extremums of AUD and JPY rates against USD, EUR, GBP, and CHF. All instruments built from these currencies must be available on the client. This is an extended version of
StatBars
Stanislav Korotky
The indicator provides a statistic histogram of estimated price movements for intraday bars. It builds a histogram of average price movements for every intraday bar in history, separately for each day of week. Bars with movements above standard deviation or with higher percentage of buys than sells, or vice versa, can be used as direct trading signals. The indicator looks up current symbol history and sums up returns on every single intraday bar on a specific day of week. For example, if current
PriceProbability
Stanislav Korotky
This is an easy to use signal indicator which shows and alerts probability measures for buys and sells in near future. It is based on statistical data gathered on existing history and takes into account all observed price changes versus corresponding bar intervals in the past. The statistical calculations use the same matrix as another related indicator - PointsVsBars. Once the indicator is placed on a chart, it shows 2 labels with current estimation of signal probability and alerts when signal
CCFpExtra
Stanislav Korotky
CCFpExtra is an extended version of the classic cluster indicator - CCFp. This is the MT4 version of indicator  CCFpExt available for MT5. Despite the fact that MT5 version was published first, it is MT4 version which was initially developed and tested, long before MT4 market was launched. Main Features Arbitrary groups of tickers or currencies are supported: can be Forex, CFDs, futures, spot, indices; Time alignment of bars for different symbols with proper handling of possibly missing bars, in
PriceProbabilities
Stanislav Korotky
This is a signal indicator for automatic trading which shows probability measures for buys and sells for each bar. It is based on statistical data gathered on existing history and takes into account all observed price changes versus corresponding bar intervals in the past. The core of the indicator is the same as in PriceProbablility indicator intended for manual trading. Unlike PriceProbability this indicator should be called from MQL4 Expert Advisors or used for history visual analysis. The in
FreqoMeterForecast
Stanislav Korotky
The main idea of this indicator is rates analysis and prediction by Fourier transform. Indicator decomposes exchange rates into main harmonics and calculates their product in future. You may use the indicator as a standalone product, but for better prediction accuracy there is another related indicator - FreqoMaster - which uses FreqoMeterForecast as a backend engine and combines several instances of FreqoMeterForecast for different frequency bands. Parameters: iPeriod - number of bars in the ma
FreqoMaster
Stanislav Korotky
The main idea of this indicator is rates analysis and prediction by Fourier transform. The indicator decomposes exchange rates into main harmonics and calculates their product in future. The indicator shows 2 price marks in history, depicting price range in the past, and 2 price marks in future with price movement forecast. Buy or sell decision and take profit size are displayed in a text label in the indicator window. The indicator uses another indicator as an engine for calculations - FreqoMet
筛选:
[删除] 2019.01.14 08:23 
 

用户没有留下任何评级信息

回复评论