OrderBook History Playback

Order Book, known also as Market Book, market depth, Level 2, - is a dynamically updated table with current volumes of orders to buy and to sell specific financial instument at price levels near Bid and Ask.

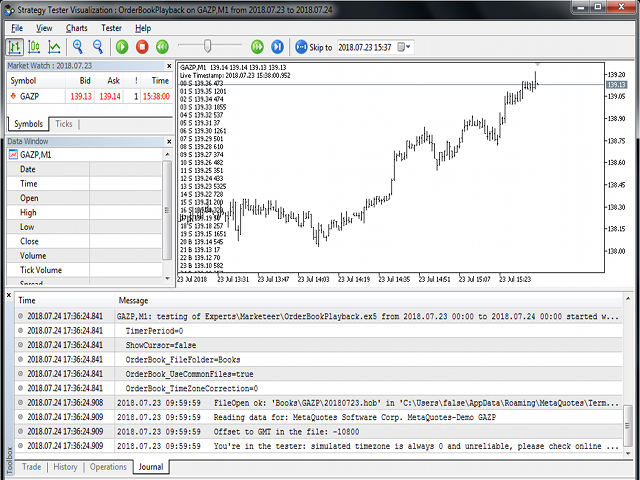
MetaTrader 5 provides the means for receiving market book from your broker, but in real time only, without access to its history. This expert adviser OrderBook History Playback allows you to playback the market book events on the history using files, created by OrderBook Recorder. The expert is based on the library OrderBook History Library, which can be as well embedded into your expert adviser or indicator (source codes are required). The library sends appropriate OnBookEvent events to your program in the tester, which make it possible to test trading strategies based on volumes analysis in the market book.

The archive files can be stored in the data folder of the terminal (usually, it looks like C:\Program Files\MetaTrader 5 MetaQuotes\MQL5\Files), or in the common data folder for all terminals (for example, 'C:\Users\<UserName>\AppData\Roaming\MetaQuotes\Terminal\Common\Files'). In either case, inside the folder another subfolder is used as a root for all market books, and the name of the subfolder is specified in the input parameter OrderBook_FileFolder, by default - "Books". Inside the root subfolder another level of subfolders is created - each subfolder corresponds to a specific work symbol, and every single day data is saved in a file YYYYMMDD.hob, where YYYY, MM, DD are year, month, day correspondingly. The extension "hob" stands for History of Order Book. For example, the ticker GAZP will produce the files MQL5/Files/Books/GAZP/*.hob.

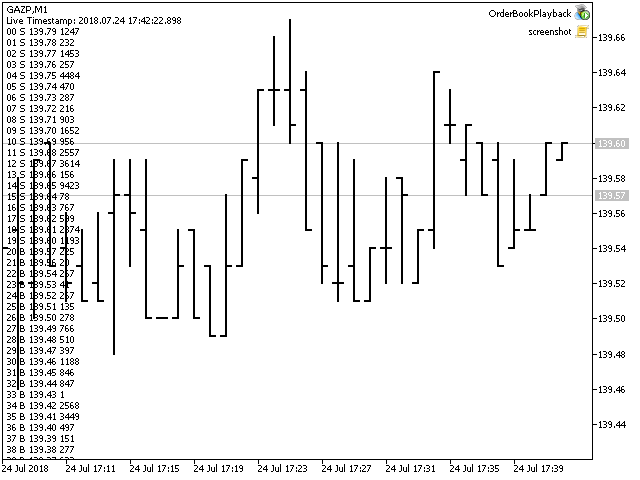
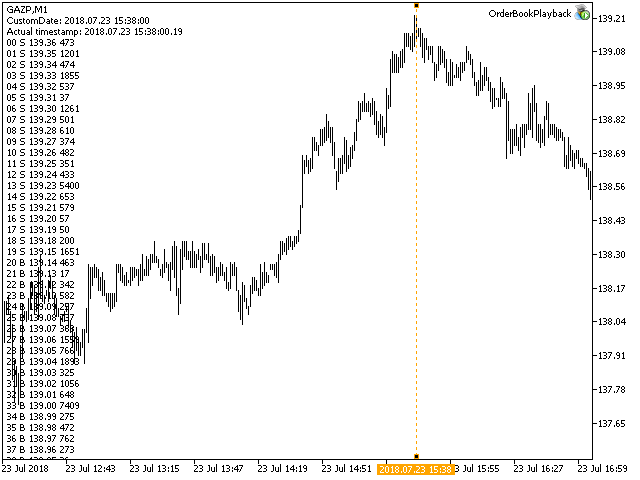
This is a non-trading expert, it does only show a comment with available information of the market book live or on the history. On every single record the following information is displayed: index, requested trade types (S for sells, B for buys), price level, volume.


Parameters

  • ShowCursor - an option to enable one of the 2 modes: false (by default) - monitors the market book online; true - creates a vertical line as a cursor, which can be dragged to highlight a bar in the past; if the market book data is available for this bar, it's displayed in the comment; only one book is shown per bar, but normally many events are available for a single bar in the file (up to one event per tick), so custom source code can analyze much more data;
  • TimerPeriod - period of the timer, in seconds, by default - 0, which means no timer, and the library is executed by ticks; the timer is useful on weekends, and on slow market;
  • OrderBook_FileFolder - a name of the root folder, where subfolders and files of the market books are stored; by default - "Books"; every subfolder is named according to specific work symbol;
  • OrderBook_UseCommonFiles - an option for reading files from the data folder of the current terminal (false, by default) or from the common data folder for all terminals (true); use the common folder for testing this and other expert advisers in the local tester; otherwise, all the hob-files should be linked to the source code using the directive #property tester_file;
  • OrderBook_TimeZoneCorrection - a correction of date and time, which is required in case, that archives are read in a terminal with a timezone, which differs from a timezone of the terminal where the archives were created; specified in seconds; for example, if the market book was saved with the server time in GMT+3, and then it's applied on quotes from a server, where time is in GMT+2, the correction should be 1 hour (-3600 seconds), because times in GMT+2 go 1 hour late in comparison to (i.e. they are 1 hour smaller than) GMT+3; 15:00 in GMT+3 is 14:00 in GMT+2;
推荐产品
Order Book, known also as Market Book, market depth, Level 2, - is a dynamically updated table with current volumes of orders to buy and to sell specific financial instument at price levels near Bid and Ask. MetaTrader 5 provides the means for receiving market book from your broker in real time. The expert OrderBook Recorder records market book changes and stores them in local files for further usage in indicators and expert adviser, including testing in the tester. The expert stores market book
FREE
Weis Waves
Flavio Javier Jarabeck
2.83 (18)
The original author is David Weis, an expert in the Wyckoff Method. The Weis Wave is a modern adaptation of the 1930's Wyckoff Method, another expert in Tape Reading techniques and Chart Analysis. Weis Waves takes market volume and stacks it into waves according to price conditions giving the trader valuable insights about the market conditions. If you want to learn more about this subject you can find tons of videos in YouTube. Just look for "The Wickoff Method", "Weis Wave" and "Volume Spread
FREE
Introduction Welcome to the world of Forex trading, where every tick of the market can be influenced by news events. Introducing our expert advisor for MetaTrader, your ultimate tool for navigating the complexities of news trading. This innovative advisor is specifically designed to automate your trading strategy during key macroeconomic releases, ensuring you never miss an opportunity.  When important indicators are announced, volatility often spikes, creating potential for profit. Our expert
FREE
Aggression Volume
Flavio Javier Jarabeck
4.29 (17)
Aggression Volume Indicator is the kind of indicator that is rarely found in the MQL5 community because it is not based on the standard Volume data provided by the Metatrader 5 platform. It requires the scrutiny of all traffic Ticks requested on the platform... That said, Aggression Volume indicator requests all Tick Data from your Broker and processes it to build a very special version of a Volume Indicator, where Buyers and Sellers aggressions are plotted in a form of Histogram. Additionally,
FREE
Donchian Breakout And Rsi
Mattia Impicciatore
5 (1)
概述 本指标是经典 Donchian 通道 的增强版,增加了多种实用的交易功能。 除了标准的三条线(最高、最低和中线),系统能够检测 突破 ,并在图表上用箭头进行可视化标记,同时只显示 与当前趋势方向相反的那条线 ,让图表更加简洁。 功能包括: 可视化信号 :突破时在图表上绘制彩色箭头 自动通知 :弹窗、Push 推送和 Email 邮件 RSI 过滤 :根据市场相对强弱验证信号 个性化设置 :颜色、线条粗细、箭头符号、RSI 阈值等 工作原理 Donchian 通道计算: 上轨线 :最近 N 根已收盘 K 线的最高价 下轨线 :最近 N 根已收盘 K 线的最低价 中线 :最高价和最低价的平均值 看涨突破 :收盘价高于上轨线 看跌突破 :收盘价低于下轨线 指标会: 绘制三条 Donchian 通道线 仅在 方向变化后的首次突破 绘制箭头 隐藏顺应趋势方向的那条线(上涨趋势: 只显示红色下轨线;下跌趋势: 只显示绿色上轨线) 可选用 RSI 过滤突破信号,减少虚假突破 支持实时发送通知 参数说明 Donchian 通道设置 indPeriod :计算通道高低点的已收盘 K 线数量 Lin
FREE
Volume Weighted Average Price or VWAP is an indicator wich shows different average prices on chart. This is very useful to find strong negotiation price areas and as trend following. Configurations: Day, Week and Month - Show different VWAPs according to the period. You can change each line style on "colors" tab. Any doubt or suggestion please contact us. Enjoy! This is a free indicator, but it took hours to develop. If you want to pay me a coffee, I appreciate a lot   <3 PayPal, Skrill, Nete
FREE
Value Chart Candlesticks
Flavio Javier Jarabeck
4.69 (13)
The idea of a Value Chart indicator was presented in the very good book I read back in 2020 , " Dynamic Trading Indicators: Winning with Value Charts and Price Action Profile ", from the authors Mark Helweg and David Stendahl. The idea is simple and the result is pure genius: Present candlestick Price analysis in a detrended way! HOW TO READ THIS INDICATOR Look for Overbought and Oversold levels. Of course, you will need to test the settings a lot to find the "correct" one for your approach. It
FREE
Aggression Wave RSJ
JETINVEST
4.83 (6)
This indicator sums up the difference between the sells aggression and the buys aggression that occurred in each Candle, graphically plotting the waves of accumulation of the aggression volumes.   Through these waves an exponential average is calculated that indicates the direction of the business flow. Note: This indicator DOES NOT WORK for Brokers and/or Markets WITHOUT the type of aggression (BUY or SELL).   Be sure to try our Professional version with configurable features and alerts:  Agre
FREE
Haven Volume Profile
Maksim Tarutin
4.56 (9)
Haven Volume Profile 是一个多功能的成交量剖面分析指标,帮助基于交易量分布识别关键价格水平。它旨在为专业交易者提供更深入的市场理解,并帮助识别重要的进出场点。 其他产品 ->  这里 主要功能: Point of Control (POC) 计算 - 最大交易活动水平,帮助识别最具流动性的水平 Value Area 定义(增加活动区)和可自定义的成交量百分比,帮助更准确地评估交易区间 支持tick成交量和实际成交量,适用于不同市场类型和交易策略 灵活的计算周期设置(天数),使工具能够适应任何时间范围 自动适应浅色和深色终端主题,提升用户界面的可视体验 清晰的水平可视化,支持自定义样式和颜色,便于图表分析和快速决策 该指标非常适合识别重要的价格水平和整合区,帮助交易者做出更加明智的交易决策。使用 Haven Volume Profile 有助于通过更准确的成交量和市场动态分析来降低风险并增加利润。
FREE
BoxInside MT5
Evgeny Shevtsov
5 (4)
This indicator calculates the volume profile and places labels that correspond to the VAH, VAL and POC levels, for each candle individually. Indicator operation features The indicator works on the timeframes from M3 to MN, but it uses the history data of smaller periods: M1 - for periods from M3 to H1, M5 - for periods from H2 to H12, M30 - for the D1 period, H4 - for the W1 period, D1 - for the MN period. The color and location of the VAL, VAH and POC labels on the current candle are considere
FREE
Cumulative Delta MT5
Evgeny Shevtsov
4.53 (62)
The indicator analyzes the volume scale and splits it into two components - seller volumes and buyer volumes, and also calculates the delta and cumulative delta. The indicator does not flicker or redraw, its calculation and plotting are performed fairly quickly, while using the data from the smaller (relative to the current) periods. The indicator operation modes can be switched using the Mode input variable: Buy - display only the buyer volumes. Sell - display only the seller volumes. BuySell -
FREE
This robot sends Telegram notifications based on the coloring rules of PLATINUM Candle indicator. Example message for selling assets: [SPX][M15] PLATINUM TO SELL 11:45. Example message for buying assets : [EURUSD][M15] PLATINUM TO BUY 11:45 AM. Before enable Telegram notifications  you need to create a Telegram bot, get the bot API Key and also get your personal Telegram chatId. It's not possible to send messages to groups or channels. You can only send messages to your user chatId. You should
FREE
Mirror Chart MT5
Andrej Hermann
5 (1)
The Mirror Chart MT5 is a overlay indicator specifically designed to project a second financial instrument directly onto the main chart window. This tool is invaluable for traders who rely on correlation analysis, as it visualizes the price movements of two different instruments in real time. Unlike traditional overlays, this indicator utilizes intelligent, dynamic centering and scaling logic. It continuously analyzes the visible price range in the current window for both symbols and calculates
FREE
Waves Sizer
Flavio Javier Jarabeck
3.86 (7)
Wyckoff fans, enjoy! Ideally to be used with the Weis Waves indicator, but it can be easily used alone, the Waves Sizer puts the range (in resulting Price movement) done by the Price on its market swings. You can control how accurate or loose will be the swings. This tool is very helpful for visually know how much the Price has traveled in your Timeframe. This way you can confront this level of effort with the resulting Volume, etc... Weis Waves indicator: https://www.mql5.com/en/market/produc
FREE
VisualVol EURUSD
Maxim Kuznetsov
The indicator highlights the points that a professional trader sees in ordinary indicators. VisualVol visually displays different volatility indicators on a single scale and a common align. Highlights the excess of volume indicators in color. At the same time, Tick and Real Volume, Actual range, ATR, candle size and return (open-close difference) can be displayed. Thanks to VisualVol, you will see the market periods and the right time for different trading operations. This version is intended f
FREE
Tenet Support and Resistance Pro
Lucas De Melo Carvalho Cruz
Tenet Support & Resistance Pro 是一个用于 MetaTrader 5 的高级指标,旨在帮助交易者准确识别 关键市场支撑和阻力区域 。 基于价格历史,该指标会自动绘制水平线以突出战略区域。此外,它会在 实时显示蜡烛当前交易区域 ,提供对关键决策区域的清晰视图。 一个独特功能是 蜡烛旁边的倒计时器 ,精确显示当前K线收盘剩余时间——非常适合需要精确入场时机的价格行为交易者。 主要优势 自动识别 最相关的支撑和阻力区域 。 直观突出显示 蜡烛当前交易区域 。 内置倒计时器 ,实时显示在蜡烛旁。 完全 可配置 :选择生成线条所使用的时间框架(D1、H4、H1、M15、M5、M1)。 可自定义颜色 ,适用于每种线条类型、区域和倒计时器。 根据图表时间框架隐藏或显示线条。 智能系统,可 每日或用户指定时间自动重新计算 水平。 ️ 输入参数 一般设置 default_chart_view – 如果希望将图表视觉更改为 Tenet 默认(白色背景,绿色多头蜡烛,红色空头蜡烛),设置为 True。 chart_ID – 要分析的图表ID。 reset_
FREE
Market Profile 3 ForexArby com
Hussien Abdeltwab Hussien Ryad
4 (15)
Market Profile 3 MetaTrader 5 indicator  version 4.70— is a classic Market Profile implementation that can show the price density over time, outlining the most important price levels, value area, and control value of a given trading session. This indicator can be attached to timeframes between M1 and D1 and will show the Market Profile for daily, weekly, monthly, or even intraday sessions. Lower timeframes offer higher precision. Higher timeframes are recommended for better visibility. It is als
FREE
Important Lines
Terence Gronowski
4.88 (24)
This indicator displays Pivot-Lines, preday high and low, preday close and the minimum and maximum of the previous hour. You just have to put this single indicator to the chart to have all these important lines, no need to setup many single indicators. Why certain lines are important Preday high and low : These are watched by traders who trade in a daily chart. Very often, if price climbs over or falls under a preday low/high there is an acceleration in buying/selling. It is a breakout out of a
FREE
High Low Open Close
Alexandre Borela
4.98 (43)
如果你象这个项目一样,就有5个饥饿审查。 这项指标采用了既定价格的公开、高、低价和关闭价格 可以对特定时间区加以调整。 许多机构和专业人士都认为这些是重要的。 贸易商可以为你了解他们可能更进一步的地点, 积极。 现有期间为: 前一日。 前一星期。 曾任Month。 曾任。 前一年。 或: 目前日。 目前周。 目前 Month。 目前配额。 今年。
FREE
Trading Performance Analyzer is a MetaTrader 5 utility designed to help traders review trading activity and manage positions from a single interface. The tool combines performance statistics, trade history visualization and position management features inside a customizable on-chart panel. It can be used for monitoring trading results, analyzing behavior patterns and executing trades with predefined risk parameters. Features Performance Analytics The dashboard provides a set of metrics that hel
FREE
DF Fib Trader Pro DF Fib Trader Pro 是一款專為 MetaTrader 5 設計的自動交易系統。 它使用基於斐波那契的價格水平,結合趨勢和結構分析來定義入場點和出場點。此 EA 支援多頭和空頭部位,並內建風險管理參數。 核心功能: • 使用斐波那契回檔和擴展邏輯來繪製入場點、停損點和獲利點。 • 可設定交易手數和停損/獲利水平 • 可選擇 1 或 2 個入場點 • 根據市場情況支持固定或動態停損和獲利 • 適用於多種時間範圍和貨幣對 • 包含最大點差、滑點和交易頻率控制選項 • 自動交易管理:損益兩平、追蹤停損與部分平倉選項 • 如有需要,支持市價單。 輸入概覽: • 風險管理:交易手數、單筆交易風險、最大交易數量 • 入場條件:斐波那契水平選擇、趨勢過濾選項 • 出場管理:停損/停盈類型、追蹤停損設定、損益平衡參數 • 交易過濾:價差限制、滑點容忍度 基本規則 • 點擊“繪製斐波那契”,並根據您的需求繪製斐波那契框。 • 您選擇的斐波那契程度會顯示出來(完全可設定) • 點擊“執行斐波那契”,即可立即建立掛單以及停損和止盈 • 設定完畢後,讓PA
FREE
VM Auto SLTP Basic
Van Minh Nguyen
5 (1)
VM Auto SLTP Basic - Intelligent Trade Management for Scalpers Enhance your scalping strategy to a higher level. VM Auto SLTP Basic automatically manages Stop Loss and Take Profit for orders that are opened manually or by other Expert Advisors. This tool does not open trades on its own, allowing you to maintain full control while enjoying precise risk management. Key Features: SL/TP based on ATR or fixed price Automatic SL move to Breakeven Risk management as a percentage of account balance Supp
FREE
This Tradepanel is an Utility for Traders Who want ot use Basic MoneyManagement for Calculation of Lotsize  I have created the basic edition only to give an Overview with Limited Functionality Full Features are available with  Auto TradePanel  Pro. (This is Only Because it can not be Tested in Strategy Tester ).  Complete Description is available at  "Auto TradePanel Pro".  in This Version Basic Functionality ( Calculation of Lotsize ) open /close Positions is working in the same way as in Pro
FREE
Follow The Line MT5
Oliver Gideon Amofa Appiah
4.6 (35)
This indicator obeys the popular maxim that: "THE TREND IS YOUR FRIEND" It paints a GREEN line for BUY and also paints a RED line for SELL. (you can change the colors). It gives alarms and alerts of all kinds. IT DOES NOT REPAINT and can be used for all currency pairs and timeframes. Yes, as easy and simple as that. Even a newbie can use it to make great and reliable trades. NB: For best results, get my other premium indicators for more powerful and reliable signals. Get them here: https://www.m
FREE
VWAP Personnal Custom
Vincent Jose Proenca
VWAP_PC_MQL5 — 一个简单的自制 VWAP 类指标,在 MT5 图表上实时显示成交量加权平均价。 时间框架: 适用于所有周期。 品种: 兼容外汇、指数、大宗商品和股票。 参数: AppliedPrice – 用于计算的价格类型(收盘价、典型价、加权价等) LineColor / Width / Style – 线条样式设置 SessionReset – 可每日重置或连续模式 工作原理(VWAP 原理): VWAP(成交量加权平均价)计算公式为: VWAP = (价格 × 成交量之和) / (成交量之和) 它反映买卖双方的动态平衡: 价格 高于 VWAP → 多头占优; 价格 低于 VWAP → 空头占优。 简短结论: VWAP_PC_MQL5 是一个轻量级的 VWAP 工具,结构简单但实用,帮助学习和分析成交量行为。
FREE
Aggression Volume Profile
Edson Cavalca Junior
4.55 (11)
This indicator plots the volume profile by Price on the chart There are 5 ways to view it: By Total Volume Traded (Premium Version); Volume Ticks(Forex) Separated by Buyers and Sellers (Premium Version); Buyers Only (Premium Version); Sellers Only (Premium Version); Business balance (Buyers - Sellers) (Premium Version); . It is possible to select how many days the profiles will be calculated.( Premium Version) On the current day it recalculates the histogram data for each new candlestick.
FREE
This indicator will mirror the assets in use in another metatrader, being able to choose the timeframe and a template. This is the Metatrader 5 Client, it needs the Metatrader 4 or 5 Server versions: Metatrader 4 Mirror Chart Server:   https://www.mql5.com/en/market/product/88644 Metatrader 5 Mirror Chart Server: https://www.mql5.com/en/market/product/88652 Details of how it works in the video.
FREE
Enhanced Volume Profile: The Ultimate Order Flow & Liquidity Analysis Tool Overview Enhanced Volume Profile is an indicator for MetaTrader 5 that displays the traded volume at specific price levels over a defined period. It separates the total volume into buy and sell components, presenting them as a side-by-side histogram on the chart. This allows users to observe the volume distribution and the proportion of buy and sell volumes at each price level. Graphics Rendering The indicator uses the
FREE
Friend of the trend
Anderson De Assis
Friend of the Trend: Your Trend Tracker Master the market with Friend of the Trend , the indicator that simplifies trend analysis and helps you identify the best moments to buy, sell, or wait. With an intuitive and visually striking design, Friend of the Trend analyzes price movements and delivers signals through a colorful histogram: Green Bars : Signal an uptrend, indicating buying opportunities. Red Bars : Alert to a downtrend, suggesting potential selling points. Orange Bars : Represent cons
FREE
核心用途 ​ 一款专为 MetaTrader 5(MT5)设计的常驻十字光标指标。它解决了 MT5 原生十字光标的核心局限,包括需手动激活、点击后自动消失、实线遮挡 K 线等问题,通过提供顺滑的专业级十字光标体验,优化图表分析流程。 ​ 核心特性 ​ 自动激活:加载后立即生效,替代原生 Ctrl+F 功能。点击图表任意位置仍保持十字光标状态,无需手动切换。 ​ 优化视觉设计:默认采用点状线条,避免遮挡 K 线、技术指标等图表核心内容,视觉呈现更简洁。 ​ 可自定义设置:支持调整十字线颜色、线条样式(点状 / 虚线 / 实线等,兼容 ENUM_LINE_STYLE 全系列)及线条宽度,适配不同图表背景与个人使用习惯。 ​ 实时鼠标跟随:十字线随鼠标移动精准更新,快速定位价格与时间坐标,助力高效对比历史 K 线关联关系,提升分析效率。 ​ 低干扰设计:禁用鼠标悬停工具提示,避免弹窗遮挡;卸载指标时自动清理十字线对象,无残留图表垃圾,不改动原图表设置。 ​ 快速设置指南 ​ 下载指标文件后,导入 MT5 平台(导航栏 > 指标 > 导入)。 ​ 在 MT5 图表中加载指标(导航栏 > 自定
FREE
该产品的买家也购买
Trade Assistant MT5
Evgeniy Kravchenko
4.42 (207)
它有助于计算每笔交易的风险,容易安装新的订单,具有部分关闭功能的订单管理, 7 种类型的追踪止损和其他有用的功能。   附加材料和说明 安装说明   -   应用程序说明   -   模拟账户应用程序的试用版 线条功能  - 在图表上显示开仓线、止损线、止盈线。 有了这个功能,就可以很容易地设置一个新的订单,并在开仓前看到它的附加特性。   风险管理  - 风险计算功能在考虑到设定的风险和止损单的大小的情况下,计算新订单的成交量。它允许你设置任何大小的止损,同时观察设定的风险。 批量计算按钮 - 启用 / 禁用风险计算。 在 " 风险 " 一栏中设置必要的风险值,从 0 到 100 的百分比或存款的货币。 在 " 设置 " 选项卡上选择风险计算的变量: $ 货币, % 余额, % 资产, % 自由保证金, % 自定义, %AB 前一天, %AB 前一周, %AB 前一个月。   R/TP 和 R/SL - 设置止盈和止损的关系。 这允许你设置相对于损失的利润大小。 例如, 1 : 1 - 这决定了 TP = SL 的大小。 2 : 1 - 这意味着 TP 是 SL 的两倍。 RR -
欢迎来到 Trade Manager EA——这是一个终极风险管理工具,旨在使交易变得更直观、精准和高效。它不仅仅是一个下单工具,而是一个用于无缝交易计划、仓位管理和风险控制的全面解决方案。不论您是新手交易员、资深交易员,还是需要快速执行的剥头皮交易员,Trade Manager EA 都可以满足您的需求,适用于外汇、指数、大宗商品、加密货币等各种市场。 借助 Trade Manager EA,复杂的计算已成过去。只需分析市场,在图表上用水平线标记入场、止损和止盈,设置您的风险水平,Trade Manager 就会立即计算出理想的头寸规模,并实时显示以点、账户货币计价的止损和止盈。每笔交易都得以轻松管理。 主要功能: 头寸规模计算器 :根据定义的风险瞬间确定交易规模。 简单的交易计划 :在图表上用可拖动的水平线直接计划交易,设置入场、止损和止盈。 实时显示 SL 和 TP :以账户货币、点或分显示止损和止盈,便于分析。 高级保护工具 盈亏平衡选项 : 基本盈亏平衡 :当您的交易达到设定水平时自动保护利润。 多级盈亏平衡 :设置多达 4 个级别以逐步保护利润。 尾随止损选项 : 基本尾随
Local Trade Copier EA MT5
Juvenille Emperor Limited
4.96 (133)
通过 Local Trade Copier EA MT5 获得非常快速的交易复制体验。它的简单1分钟设置,使您可以在同一台Windows计算机或Windows VPS上在多个MetaTrader终端之间复制交易,具有闪电般快速的复制速度,低于0.5秒。 无论您是初学者还是专业交易者, Local Trade Copier EA MT5 都提供了广泛的选项,可根据您的特定需求进行自定义。对于任何希望增加利润潜力的人来说,这都是终极解决方案。 今天就尝试一下,看看为什么它是市场上最快、最简单的贸易复印机! 提示: 您可以在您的模拟账户中下载并试用 Local Trade Copier EA MT5 模拟版: 这里 将下载的免费演示文件粘贴到您的 MT5 >> 文件 >> 打开数据文件夹 >> MQL5 >> 专家文件夹并重新启动您的终端。  免费演示版本每次可在 4 小时内发挥全部功能,仅限演示帐户。 要重置试用期,请转至 MT5 >> 工具 >> 全局变量 >> Control + A >> 删除。 请仅在非关键模拟账户上执行此操作,不要在挑战道具公司账户中执行此操作。 如果您无法
TradePanel MT5
Alfiya Fazylova
4.87 (149)
交易面板是一款多功能交易助手。该应用包含超过50种手动交易功能,并允许您自动执行大多数交易任务。 注意!折扣时间有限,每周二价格将上涨5美元。(直到100美元)。 在购买之前,您可以在演示账户上测试演示版本。下载用于演示账户的试用版应用程序: https://www.mql5.com/zh/blogs/post/762579 。 完整说明 这里 。 贸易. 只需单击一下即可执行交易操作: 打開掛單和頭寸,並自動計算風險。 一鍵打開多個訂單和頭寸。 打開訂單網格。 按組別關閉掛單和頭寸。 反轉頭寸方向(關閉買入>打開賣出,關閉賣出>打開買入)。 鎖定頭寸(通過開啟缺少的頭寸,使買入和賣出頭寸的數量相等)。 一鍵部分關閉所有頭寸。 將所有頭寸的止盈和止損設置在同一價格水平。 將所有頭寸的止損設置在盈虧平衡水平。 開倉時,可使用以下功能: 在多個訂單或倉位之間分配計算出的數量(在單擊一次時開啟多個訂單和倉位)。 在開啟訂單前在圖表上可視化交易水平。 僅在當前點差不超過設定值時才開啟倉位。 止盈和止損之間的自動比例。 虛擬止損和止盈。 自動將止損和止盈的大小增加為當前點差的大小。 基於ATR指
VERIFIED TRADING RESULTS - Farmed Hedge Yield Axi Copy:  https://www.mql5.com/en/signals/2356376 - Farmed Hedge Yield Exn Copy:   https://www.mql5.com/en/signals/2356404 - Farmed Hedge Yield V Copy:  https://www.mql5.com/en/signals/2357156 Contact me via private message to receive the User Manual and Setup. * Thai Lauguage Support Available Farmed Hedge Yield Farming - Professional Pair Trading Dashboard (Manual - Hybrid - Semi/Automated EA) VERSION 3 - WILD HARVEST UPDATE Trading Approac
测试版发布 Telegram to MT5 Signal Trader 即将进入正式的 Alpha 版本。一些功能仍在开发中,您可能会遇到一些小错误。如果您遇到问题,请反馈,您的意见将帮助我们改进软件。 Telegram to MT5 Signal Trader 是一款强大的工具,能够将 Telegram 频道或群组的交易信号自动复制到您的 MetaTrader 5 账户。 支持公开和私人频道,可将多个信号提供者连接至一个或多个 MT5 账户。软件优化、高效、稳定,精准控制每笔复制交易。 界面简洁,仪表盘美观,图表交互性佳,导航直观。您可以管理多个信号账户,自定义每个提供者的设置,并实时监控所有操作。 系统需求 由于 MQL 限制,EA 需要配合 PC 端应用与 Telegram 通信。 安装程序可通过官方 安装指南 获取。 核心功能 多提供者支持: 从多渠道复制信号至多个 MT5 帐户 高级信号识别: 关键词、模式和标签全面自定义 逐提供者控制: 可启用/禁用特定信号类型、平仓策略等 灵活风险管理: 固定手数、固定金额、余额/权益百分比、部分平仓设置 可定制 SL/TP: 覆盖信号
Trade Dashboard MT5
Fatemeh Ameri
4.94 (120)
疲于复杂的订单下达和手动计算?Trade Dashboard 是您的解决方案。凭借其用户友好的界面,订单下达变得轻而易举,只需点击一下,您就可以开设交易、设置止损和止盈水平、管理交易手数,并计算风险回报比,让您只需专注于您的策略。告别手动计算,使用 Trade Dashboard 简化您的交易体验。 立即下载演示版本 。 您可以在这里找到仪表盘功能和特性的详细信息 。 加入 Telegram 频道 。 购买后请给我发消息以获取支持。如果您需要添加更多功能,可以在产品的评论区留下您的想法,我愿意听取任何建议,希望您能在使用我的产品时获得最佳体验 。 这是 MT4 版本。 风险管理:使用 Trade Dashboard,可以将您的风险设置为账户余额或权益的百分比,或将风险设置为总金额。在图表上直观地定义您的止损,让工具准确计算每个货币对的适当手数。该工具还可以根据您期望的风险回报比自动设置止盈水平。它甚至可以在手数计算中涵盖佣金和点差费用。此外,您的止损和止盈可以转变为虚拟水平,隐藏于经纪商。通过 Trade Dashboard 的高级风险管理功能,掌控风险,保护您的资本。 交易线
Exp COPYLOT CLIENT for MT5
Vladislav Andruschenko
3.82 (34)
MT5 交易复印机是 МetaТrader 5 平台的交易复印机 。 它复制外汇交易 之间   任何账户 MT5   -   MT5, MT4   -   MT5 对于 COPYLOT MT5 版本(或 MT4   - MT4 MT5   -   MT4 对于 COPYLOT MT4 版本) 值得信赖的复印机! MT4版本 详细描述   +DEMO +PDF 如何购买 如何安装     如何获取日志文件     如何测试和优化     Expforex 的所有产品 您还可以在 МТ4 终端 (   МТ4   -   МТ4, МТ5   -   МТ4   ) 中 复制交易: COPYLOT CLIENT for MT4 此版本包括在终端 МТ5   -   МТ5, МТ4   -   МТ5 之间 。 交易复制器用于在 2/3/10 终端之间复制交易/头寸。 支持从模拟账户和投资账户复制。 该程序可以在多个终端绑定上运行。 使用它作为您在一个账户上交易的各种投资者账户的交易的同步器, - COPYLOT 会将您的交易复制到其他终端。 从 多个 终端复制到一个; 从一个终端复
Copy Cat More Trade Copier MT5 (复制猫MT5) 是一个本地跟单软件,也是一个完整的风险管理和执行框架,专为当今的交易挑战而设计。从资金管理公司挑战到个人投资组合管理,它能适应各种情况,结合了稳健的执行、资本保护、灵活配置和高级交易处理功能。 该跟单软件可在主端(发送方)和从端(接收方)模式下工作,实时同步市价单和挂单、交易修改、部分平仓和对冲平仓操作。它兼容模拟和实盘账户、交易或投资者登录,并通过持久的交易记忆系统确保恢复功能,即使EA、终端或VPS重启也不例外。可以同时管理多个主端和从端,使用唯一ID,并通过前缀/后缀调整或自定义品种映射自动处理跨经纪商差异。 手册/设置  | Copy Cat More MT4 | 频道  特色功能: 易于设置——快至30秒(见视频)。 快速、稳定、准确——Turbo模式下低延迟复制(见截图)。 高安全性——不使用潜在危险的DLL或WebRequest。 持久交易记忆,避免孤立、丢失或不准确的交易。 可从手动或EA复制,支持所有账户类型。 品种自动前缀/后缀,快速设置;支持MT4和MT5之间复制。 非常灵活的多主端
Trade copier MT5
Alfiya Fazylova
4.56 (39)
Trade Copier 是一种专业实用程序,旨在复制和同步交易账户之间的交易。 复制发生从供应商的帐户/终端到收件人的帐户/终端,安装在同一台计算机或 vps 上。 在购买之前,您可以在演示帐户上测试演示版本。 演示 这里 。 完整说明 这里 。 主要功能和优点: 支持复制MT5>MT5、MT4>MT5、MT5>MT4,包括МТ5 netting账户。 供应商和收件人模式在同一产品中实现。 简单直观的界面,允许您直接从图表中实时控制复制。 连接中断或终端重新启动时不会丢失设置和位置。 允许您选择要复制的符号,也可以替换接收者的符号,例如 EURUSD> USDJPY。 支持回拷贝。 能够仅复制某些订单。 允许您设置开仓交易价格的最大差异和最大时间延迟。 正确复制部分订单关闭的执行。 计算复制手数的几种方法。 同步止盈和止损。有几种方法可以计算它们的位置。 支持通过执行在“Market account”上工作,其中 SL / TP 仅在开仓后设置。 如何使用简单的设置复制交易 将供应商终端和接收终端安装在同一台计算机或 VPS 上。 在供应商终端上以“Master”模式安装复印机,然后
MT5 to Telegram Signal Provider 是一个易于使用且完全可自定义的工具,它允许向 Telegram 的聊天室、频道或群组发送 指定 的信号,将您的账户变为一个 信号提供商 。 与大多数竞争产品不同,它不使用 DLL 导入。 [ 演示 ] [ 手册 ] [ MT4 版本 ] [ Discord 版本 ] [ Telegram 频道 ]  New: [ Telegram To MT5 ] 设置 提供了逐步的 用户指南 。 不需要了解 Telegram API;开发者提供了您所需的一切。 关键特性 能够自定义发送给订阅者的订单详情 您可以创建分层的订阅模型,例如铜、银、金。其中金订阅获得所有信号等。 通过 id、符号或评论过滤订单 包括执行订单的图表截图 在发送的截图上绘制已关闭的订单,以便额外核实 延迟发送新订单消息的可能性,以便在发送前对位置进行调整 订单详情完全透明: 新的市场订单*带截图 订单修改(止损、获利) 已关闭的订单*带截图 部分关闭的订单** 新的挂单 修改的挂单(进场价格) 挂单激活(作为新的市场订单附加) 已删除的挂单 历史订单报告
Timeless Charts
Samuel Manoel De Souza
5 (3)
Timeless Charts is an advanced charting solution designed for professional traders seeking for custom charts / custom timeframes , including seconds charts / seconds timeframe, renko charts / renko bars, cluster charts / footprint charts and advanced tools present in most of the popular platforms. Unlike traditional offline charts or simplistic custom indicators, this solution constructs fully custom bars with true timestamp accuracy , down to miliseconds, allowing for a powerful and precise tr
AntiOverfit PRO MT5
Enrique Enguix
5 (3)
大多数交易者都会在不知不觉中犯下同样的错误:仅仅因为某个EA在一段历史回测中表现很好,就对它产生信任。 但单一历史回测并不能证明稳健性。它只能说明,这套逻辑在市场曾经走过的某一条具体路径上有效。而真实市场,这条路径只出现过一次。 这正是 AntiOverfit PRO 存在的意义。 AntiOverfit PRO 是一款帮助你评估 MetaTrader 5 中任何EA真实稳健性的工具。它不是为了用一条漂亮的收益曲线来打动你,而是为了回答一个更重要的问题: 当市场不再像过去那样运行时,这个系统是否依然站得住脚? 换句话说,AntiOverfit PRO 不只是告诉你一个EA在历史上“赚过钱没有”。它真正帮助你判断的是:这个结果背后是否建立在足够稳健的逻辑之上,还是过度依赖于那个已经发生过的特定市场路径。 真正的问题在哪里 很多EA之所以看起来很强,只是因为它们与过去拟合得太好了。有时候这是过度优化的结果;有时候只是因为历史市场恰好偏爱这种逻辑;还有时候,一份漂亮的回测报告本身就会带来一种其实并不可靠的安全感。 这正是零售算法交易中最容易被忽视的盲点之一:把一条漂亮的资金曲线误当成
HINN MagicEntry Extra
ALGOFLOW OÜ
4.71 (14)
HINN MAGIC ENTRY – the ultimate tool for entry and position management! Place orders by selecting a level directly on the chart! full description   ::  demo-version  :: 60-sec-video-description Key features: - Market, limit, and pending orders - Automatic lot size calculation - Automatic spread and commission accounting - Unlimited partitial take-profits  - Breakeven and trailing stop-loss and take-profit  functions - Invalidation leves - Intuitive, adaptive, and customizable interface - Works
The News Filter MT5
Leolouiski Gan
4.75 (20)
这个产品在新闻时间过滤所有的专家顾问和手动图表,因此您不必担心突然的价格波动会破坏您的手动交易设置或其他专家顾问输入的交易。此产品还带有完整的订单管理系统,可在任何新闻发布前处理您的持仓和挂单。一旦您购买了   The News Filter ,您将不再需要依赖以后的专家顾问内置的新闻过滤器,因为这个产品可以从此过滤它们所有。 新闻选择 新闻来源于Forex Factory的经济日历。 选择可以基于任何一种货币,如USD,EUR,GBP,JPY,AUD,CAD,CHF,NZD和CNY等。 选择也可以基于关键识别,例如Non-Farm (NFP),FOMC,CPI等。 能够选择新闻影响级别的筛选,从低、中、到高影响。 自动模式只选择与图表相关的新闻。 新闻来源每小时自动刷新,以确保最新的新闻数据。 为每个新闻影响级别提供单独的输入,以确定您要过滤掉的新闻发布前后的分钟数。 订单管理选项 在新闻发布前关闭未平仓头寸的选项,并在新闻发布后恢复它们。 在新闻发布前删除挂单的选项,并在新闻发布后恢复它们。 在新闻发布前移除止损和止盈水平的选项,并在新闻发布后恢复它们。 在新闻发布前移动止损和
HINN Lazy Trader
ALGOFLOW OÜ
5 (2)
The core idea: using the user interface, you configure the parameters the chart must meet before entering a position (or positions), choose which entry models to use, and set the rules for when trading and planning should end. Lazy Trader  handles the rest: it  takes over all the routine chart watching and execution! full description  :: 3 key videos [1] ->  [2]   ->  [3] What can it do? - Understands Larry Williams market structure - Understands swing market structure by Michael Huddleston
Seconds Chart MT5
Boris Sedov
4.59 (17)
秒级图表 (Seconds Chart) - 一款专为 MetaTrader 5 设计的独特工具,用于创建秒级时间框架的图表。 通过 秒级图表 ,您可以构建以秒为单位的时间框架图表,获得标准分钟或小时图表无法提供的极致灵活性和分析精度。例如,时间框架 S15 表示每根蜡烛图持续15秒。您可以使用任何支持自定义交易品种的指标和EA交易系统。操作它们就像在标准图表上交易一样方便。 与标准工具不同, 秒级图表 让您能够在超短时间框架下进行高精度交易,无延迟干扰。 秒级图表的优势 支持 1至900秒 的时间框架图表。 基于内置的实时报价数据库, 即时加载 历史数据。 数据实时更新, 无延迟或滞后 。 可同时创建 多个秒级图表 。 秒级图表的理想应用场景 剥头皮交易 和高频交易。 精确的入场和出场时机。 在短时间框架下测试交易策略。 时间框架设置 默认设置包含以下时间框架: S1、S2、S3、S4、S5、S6、S10、S12、S15、S20、S30 。 您可轻松自定义时间框架组合,只需按升序列出 1至900秒 的数值且避免重复即可。 其他免费工具 快速交易管理器 ( Quick Trade Ma
EasyTrade MT5
Alain Verleyen
5 (3)
Easy Trade – 智能、简洁且强大的交易管理工具 Easy Trade 是为 MetaTrader 用户打造的一体化交易管理解决方案,帮助您轻松掌控风险,实现流畅交易执行。 它是根据交易者的反馈从零开始开发的,简化了多品种交易的执行、监控和管理流程,无需繁琐的操作。 无论您是手动短线交易者,还是管理多个交易设置的小型投资组合,Easy Trade 都能让您专注于明智决策和稳定盈利。 ⸻ 为什么选择 Easy Trade? 精准风险管理:可选择固定手数或按百分比定义每笔交易的风险。实时显示风险与潜在收益。 篮子式跟踪止盈:追踪多笔交易的总利润,目标达成时自动锁定部分收益,适用于组合交易。 交易截图记录:每笔交易都可截图保存,方便日记记录、回顾与绩效分析。 定时自动平仓:可设定具体日期和时间自动关闭持仓,适合日终或周末前平仓。 界面可自定义:可调整按钮排序与大小、线条样式与颜色、缩放比例等,满足个人使用习惯。 ⸻ 主要功能(版本 1.0) 魔术号与策略标签: 使用注释标记轻松区分不同策略的交易,便于统计与复盘。 手数设置: 支持固定手数或基于止损与账户资金百分比的动态手
EA Auditor
Stephen J Martret
EA AUDITOR - 购买前验证EA MetaTrader 5 唯一独立的EA与信号验证工具 每次都做出更明智的EA购买决策。 MQL5市场拥有一些由才华横溢的开发者打造的出色EA——这些策略能够改变您的交易。但市场中也存在内置历史读取器以伪造回测结果的EA、过度拟合策略、被操纵的信号,以及被虚假宣传为"AI驱动"或"机器学习"的EA,而实际上不过是贴了流行标签的基础指标。问题在于?付款之前几乎无法分辨真假。EA Auditor改变了这一现状。它独立审计任何回测、任何开发者发布的实盘信号,并将两者交叉验证——让优秀的EA脱颖而出,让问题EA在您冒险一分钱之前就被曝光。 为什么选择EA AUDITOR? 因为没有验证,再好的回测也毫无意义。 大多数EA卖家提供回测结果来展示其策
Trade Manager DaneTrades
Levi Dane Benjamin
4.36 (28)
交易管理器可帮助您快速进入和退出交易,同时自动计算风险。 包括帮助您防止过度交易、报复性交易和情绪化交易的功能。 交易可以自动管理,账户绩效指标可以在图表中可视化。 这些功能使该面板成为所有手动交易者的理想选择,并有助于增强 MetaTrader 5 平台。多语言支持。 MT4版本  |  用户指南+演示 交易经理在策略测试器中不起作用。 如需演示,请参阅用户指南 风险管理 根据%或$自动调整风险 可选择使用固定手数或根据交易量和点自动计算手数 使用 RR、点数或价格设置盈亏平衡止损 追踪止损设置 最大每日损失百分比,在达到目标时自动平仓所有交易。 保护账户免遭过多提款并阻止您过度交易 最大每日损失(以美元为单位)在达到目标时自动关闭所有交易。 保护账户免遭过多提款并阻止您过度交易 一键实现所有交易的盈亏平衡 自动计算从手机/电话发送的交易的风险 OCO 在设置中可用 交易和头寸管理 通过设置每月、每周、每天、每小时或每分钟的最大交易次数,停止过度交易和报复性交易。 高级挂单管理。 调整何时关闭挂单的规则 追踪挂单 支持市价订单和挂单 每日最大利润目标(以美元为单位)以确保头寸并停止
The product will copy all telegram signal to MT5 ( which you are member) , also it can work as remote copier.  Easy to set up, copy order instant, can work with almost signal formats, image signal,  s upport to translate other language to English Work with all type of channel or group, even channel have "Restrict Saving Content", work with  multi channel, multi MT5 Work as remote copier: with signal have ticket number, it will copy exactly via ticket number. Support to backtest signal. How to s
Footprint Chart Pro — Professional OrderFlow EA for MetaTrader 5 Version 6.34 | Professional tool for real traders | Institutional-Grade Visualization DEMO USERS - PLEASE SELECT EVERY TICK / REAL TICK WHEN TESTING AND YOU HAVE DOWNLOADED HISTORICAL DATA. IF YOU SEE A WAITING SCREEN AND IT IS NOT DOWNLOADING, IT MEANS YOU HAVE LOW HISTORICAL DATA. TRY 1 MIN AND 5 MIN FIRST ON 1 DAY DATA. ONE DAY DATA SHOULD BE THE NEWEST AND MOST CURRENT DATE. PLEASE WAIT UNTIL THE MARKET HAS ROLLED OVER PERIOD.
Crypto Charting
Rajesh Kumar Nait
5 (5)
Crypto Charting for MT5 – MetaTrader 5 加密货币图表集成工具 概述 Crypto Charting for MT5 通过 WebSocket 提供实时 OHLC 图表数据。支持多家交易所,并可在 MT5 中自动更新历史数据。 功能 实时 WebSocket 数据传输 自动历史数据同步 网络中断后的计划更新 兼容所有 MT5 时间周期 支持 OHLCV 数据格式 支持策略测试器 自动重新连接 支持的交易所 Binance, Bybit, OKX, KuCoin, MEXC, Gate.io, Bitget, XT.com 补充说明 如需获取 Tick 数据和深度数据,可查看名为 Crypto Ticks 的相关产品。 注意事项 不使用 DLL,适用于 VPS 环境。 Strategy Tester 不支持 WebRequest 功能。 如需试用版本,请通过 MQL5 私信联系作者。 Full Documentation & Setup Guide : Click Here
实时扫描您的整个观察列表,发现极端K线。 Power Bar Scanner 同时监控您所有的交易品种,在出现极端价格K线的瞬间向您发出警报。无需再逐个翻看图表。在一个面板中查看所有机会。 适用于任何时间周期。Forex、指数、黄金、加密货币 - 全部集中在一个视图中。 工作原理 扫描器检查您 Market Watch 中的每个品种,寻找实体超过 N x ATR 的K线。当发现这样的K线时,该品种会亮起并显示方向(BUY/SELL)、ATR 比率以及信号出现在多少根K线之前。您可以一目了然地看到哪些品种当前处于活跃状态。 一键导航 点击扫描器中的任何品种名称,您的图表会立即切换到该品种。发现信号,点击它,分析它。无需手动切换品种,无需在图表标签中搜索。 可排序列 点击任何列标题,按品种、价格、信号、比率或时间排序。想先看最强的信号?按 Ratio 排序。想看最新的信号?按 Age 排序。再次点击可反转排序顺序。 与 Power Bar MT5 完美配合 扫描器发现机会。 Power Bar 指标 进行分析。两者结合使用:扫描器在您的观察列表中提醒您出现极端K线,然后点击该品种,让
Telegram to MT5 Coppy
Sergey Batudayev
5 (8)
Telegram 到 MT5: 终极信号复制解决方案 使用 Telegram 到 MT5 简化您的交易,这款现代化工具可直接从 Telegram 频道和聊天室复制交易信号到您的 MetaTrader 5 平台,无需 DLL 文件。这款强大的解决方案可确保精准的信号执行、丰富的自定义选项,节省时间并提高您的效率。 [ Instructions and DEMO ] 主要特点 直接 Telegram API 集成 通过电话号码和安全码进行身份验证。 通过用户友好的 EXE 桥轻松管理聊天 ID。 添加、删除和刷新多个频道/聊天以同时复制信号。 使用高级过滤器进行信号解析 跳过包含异常词(例如“报告”、“结果”)的不需要的信号。 支持灵活的 SL 和 TP 格式:价格、点数或点数。 自动计算指定点而不是价格的信号的切入点。 订单定制和灵活性 使用多种模式配置订单大小:固定手数、动态手数(% 风险)或特定符号手数。 使用信号数据或自定义参数调整 SL/TP。 设置滑点限制、挂单到期时间和重试参数,以实现无缝执行。 综合符号管理 排除特定符号或映射到特定经纪人的符号。 自定义信号和经纪商符号之间
OrderManager MT5
Lukas Roth
4.84 (25)
介绍 OrderManager :MT5的革命性工具 使用全新的Order Manager实用程序,像专业人士一样管理您在MetaTrader 5上的交易。Order Manager设计简单,易于使用,可让您轻松定义和可视化每笔交易的风险,从而做出明智的决策并优化您的交易策略。有关OrderManager的更多信息,请参阅手册。 [ 手册 ] [ MT4版本 ] [ Telegram 频道 ]  New: [ Telegram To MT5 ] 主要功能: 风险管理:快速轻松地定义您交易的风险,让您做出更好的决策并提高交易性能。 视觉表示:图形化地查看您的交易和相关风险,以清晰简洁地了解您的开放头寸。 订单修改:只需几次点击即可轻松修改或关闭您的订单,简化您的交易过程,为您节省宝贵的时间。 掌握新闻:一键获取最新市场新闻。 不要错过这个MT5交易员的必备工具。用Order Manager提升您的交易体验,将您的交易游戏提升到新的水平。 OrderManager在startegyTester中 不 工作! OrderManager 仅与 Windows 兼容。 请考虑给这个产品一
Trade Assistant 38 in 1
Makarii Gubaydullin
4.91 (23)
多功能工具:手数计算器,网格订单,风险回报比,交易管理器,供求区域,价格行为等等 演示版本   |   用户手册 交易助手   不能在策略测试器中工作 :您可以下载   此处的演示版本  来测试此 工具 。 联系我   如有任何问题  / 改进建议 / 发现错误 如需MT4版本,请访问 此处 简化、加速并自动化您的交易   流程 。通过此   仪表板 扩展标准终端功能。 交易面板  适用于任何交易品种:外汇、股票、指数、加密货币等。 1. 开立新交易 :手数 / 风险 / 风险回报比计算 :手动交易的风险管理 手数计算器(根据风险大小计算交易量) 风险计算器(根据手数大小计算风险金额) 风险回报   比率 网格订单:  + 动态距离选项,及拆分手数选项 订单激活触发器,+ 买入止损限价 / 卖出止损限价 虚拟止损,虚拟止盈(隐藏止损,隐藏止盈:经纪商不可见) 智能止损 / 入场价位:若K线收盘突破则避免虚假触发 隐藏订单(虚拟挂单) 计划订单:即使市场休市也可挂单交易(周末计划器) 额外多级止盈价位 具有不同ID的OCO(一单取消另一单)订单 图表上的交易可视化 + 调整 止损 /
Smart Stop Manager – 专业级自动化止损管理系统 概述 Smart Stop Manager 是 Smart Stop 产品线的执行核心,为需要结构化、可靠且全自动止损管理的交易者而设计。它持续监控所有持仓,根据 Smart Stop 市场结构逻辑计算最佳止损位置,并按照清晰透明的规则自动更新止损。 无论是管理单一品种还是多品种组合,Smart Stop Manager 都能为每笔交易提供纪律性、一致性和全面的风险可视化。它减少情绪化判断,降低手动操作负担,并确保止损始终基于真实的市场结构进行调整。 功能亮点 基于市场结构的自动止损计算 • 自动评估所有持仓,并根据 Smart Stop 逻辑应用最佳止损水平。 一站式组合管理面板 • 显示交易品种、方向、Magic Number、手数、开仓价、当前价、推荐止损、点差距离、浮动盈亏、风险敞口及实时状态标签。 DPI 自适应专业界面 • 在高分辨率屏幕上呈现清晰锐利的显示效果,布局会动态适配窗口。 清晰的状态标签 • 每笔交易都会标注当前状态,让交易者即时了解风险状况。 高级特殊情况识别 • 智能识别逆趋势
Custom Alerts:监控多个市场,绝不错过关键交易信号 概述 Custom Alerts 是一款动态工具,专为希望集中监控多个交易品种潜在机会的交易者设计。通过整合我们旗舰工具(如 FX Power、FX Volume、FX Dynamic、FX Levels 和 IX Power)提供的数据, Custom Alerts 可自动通知您关键的市场变化,无需频繁切换图表,也不会错过交易良机。现在,它支持您的经纪商提供的所有资产类别,只需在设置中选择相应的资产类别即可,无需手动输入任何品种名称。 1. 为什么 Custom Alerts 对交易者非常有帮助 一体化市场监控 • Custom Alerts 收集并整合来自外汇、贵金属、加密货币、指数,甚至(若经纪商支持)股票市场的信号。 • 无需频繁切换图表,一切通知集中呈现。 根据策略定制提醒 • 精准设置提醒条件。无论是追踪成交量激增、强度突破,还是极端价格波动, Custom Alerts 都能确保您不会错过任何关键信号。 • 可与 Stein Investments 工具无缝集成,助您更深入分析与优化交易决策。 节省时
Entry In The Zone with SMC Multi Timeframe is a real-time market analysis tool developed based on Smart Money Concepts (SMC). It is designed to analyze market structure, price direction, reversal points, and key zones across multiple timeframes in a systematic way. The system displays Points of Interest (POI) and real-time No Repaint signals, with instant alerts when price reaches key zones or when signals occur within those zones. It functions as both an Indicator and a Signal System (2-in-1),
作者的更多信息
WalkForwardOptimizer MT5
Stanislav Korotky
3.78 (9)
WalkForwardOptimizer library allows you to perform rolling and cluster walk-forward optimization of expert advisers (EA) in MetaTrader 5. To use the library include its header file WalkForwardOptimizer.mqh into your EA source code, add call provided functions as appropriate. Once the library is embedded into EA, you may start optimization according to the procedure described in the User guide . When it's finished, intermediate results are saved into a CSV file and some special global variables.
RenkoFromRealTicks
Stanislav Korotky
4.5 (2)
This non-trading expert utilizes so called custom symbols feature ( available in MQL API as well) to build renko charts based on history of real ticks of selected standard symbol. RenkoFromRealTicks generates custom symbol quotes, thus you may open many charts to apply different EAs and indicators to the renko. It also transmits real ticks to update renko charts in real time. The generated renko chart uses M1 timeframe. It makes no sense to switch the renko chart to a timeframe other than M1. T
AutomaticZigZag
Stanislav Korotky
4.5 (2)
This is a non-parametric ZigZag providing 4 different methods of calculation. Upward edge continues on new bars while their `highs` are above highest `low` among previous bars, downward edge continues on next bars while their `lows` are below lowest `high` among previous; Gann swing: upward edge continues while `highs` and `lows` are higher than on the left adjacent bar, downward edge continues while `highs` and `lows` are lower than on the left adjacent bar. Inside bars (with lower `high` and
FREE
CustomVolumeDelta
Stanislav Korotky
5 (1)
This indicator displays volume delta (of either tick volume or real volume) encoded in a custom symbol, generated by special expert advisers, such as RenkoFromRealTicks . MetaTrader does not allow negative values in the volumes, this is why we need to encode deltas in a special way, and then use CustomVolumeDelta indicator to decode and display the deltas. This indicator is applicable only for custom instruments generated in appropriate way (with signed volumes encoded). It makes no sense to ap
FREE
ADXS
Stanislav Korotky
5 (3)
Ever wondered why standard ADX is made unsigned and what if it would be kept signed? This indicator gives the answer, which allows you to trade more efficient. This indicator calculates ADX values using standard formulae, but excludes operation of taking the module of ADX values, which is forcedly added into ADX for some reason. In other words, the indicator preserves natural signs of ADX values, which makes it more consistent, easy to use, and gives signals earlier than standard ADX. Strictly s
VolumeDeltaM1 MT5
Stanislav Korotky
This indicator provides the analysis of tick volume deltas. It monitors up and down ticks and sums them up as separate volumes for buys and sells, as well as their delta volumes. In addition, it displays volumes by price clusters (cells) within a specified period of bars. This indicator is similar to VolumeDeltaMT5 , which uses almost the same algorithms but does not process ticks and therefore cannot work on M1. This is the reason for VolumeDeltaM1 to exist. On the other hand, VolumeDeltaMT5 ca
This is a demo version of a non-trading expert , which utilizes so called the custom symbols feature ( available in MQL as well ) to build renko charts based on historical quotes of selected standard symbol and to refresh renko in real-time according to new ticks. Also it translates real ticks to the renko charts, which allows other EAs and indicators to trade and analyze renko. Place the EA on a chart of a working instrument. The lesser timeframe of the source chart is, the more precise resulti
FREE
WalkForwardDemo MT5
Stanislav Korotky
WalkForwardDemo is an expert adviser (EA) demonstrating how the built-in library WalkForwardOptimizer (WFO) for walk-forward optimization works. It allows you to easily optimize, view and analyze your EA performance and robustness in unknown trading conditions of future. You may find more details about walk-forward optimization in Wikipedia . Once you have performed optimization using WFO, the library generates special global variables (saved in an "archived" file with GVF-extension) and a CSV-f
FREE
HZZM
Stanislav Korotky
4 (1)
This is an adaptive ZigZag based on modification of  HZZ indicator (original source code is available in this article ). Most important changes in this version: two additional indicator buffers added for zigzag evolution monitoring - they show cross signs at points where zigzag direction first changes; zigzag range (H) autodetection on day by day basis; time-dependent adjustment of zigzag range. Parameters: H - zigzag range in points; this parameter is similar to original HZZ, but it can take 0
FREE
RenkoCharts
Stanislav Korotky
This non-trading expert utilizes so called custom symbols feature ( available in MQL as well ) to build renko charts based on historical quotes of selected standard symbol and to refresh renko in real-time according to new ticks. Also, it translates real ticks to the renko charts, which allows other EAs and indicators to trade and analyze renko. Place RenkoCharts on a chart of a work instrument. The lesser timeframe of the source chart is, the more precise resulting renko chart is, but the lesse
OrderBook Utilities is a script, which performs several service operations on order book hob-files, created by OrderBook Recorder . The script processes a file for work symbol of the current chart. The file date is selected by means of the input parameter CustomDate (if it's filled in) or by the point where the script is dropped on the chart. Depending from the operation, useful information is written into the log, and optionally new file is created. The operation is selected by the input parame
FREE
This script allows performing a walk-forward analysis of trading experts based on the data collected by the WalkForwardLight MT5 library. The script builds a cluster walk forward report and rolling walk forward reports that refine it, in the form of a single HTML page. This script is optional, as the library automatically generates the report immediate after the optimization in the tester is complete. However, the script is convenient because it allows using the same collected data to rebuild th
FREE
ReturnAutoScale
Stanislav Korotky
5 (2)
The indicator calculates running total of linear weighted returns. It transforms rates into integrated and difference-stationary time series with distinctive buy and sell zones. Buy zones are shown in blue, sell zones in red. Parameters: period - number of bars to use for linear weighted calculation; default value - 96; smoothing - period for EMA; default value - 5; mode - an integer value for choosing calculation mode: 0 - long term trading; 1 - medium term trading; 2 - short term trading; defa
FREE
Order Book, known also as Market Book, market depth, Level 2, - is a dynamically updated table with current volumes of orders to buy and to sell specific financial instument at price levels near Bid and Ask. MetaTrader 5 provides the means for receiving market book from your broker in real time. The expert OrderBook Recorder records market book changes and stores them in local files for further usage in indicators and expert adviser, including testing in the tester. The expert stores market book
FREE
PointsVsBars
Stanislav Korotky
This indicator provides a statistical analysis of price changes (in points) versus time delta (in bars). It calculates a matrix of full statistics about price changes during different time periods, and displays either distribution of returns in points for requested bar delta, or distribution of time deltas in bars for requested return. Please, note, that the indicator values are always a number of times corresponding price change vs bar delta occurred in history. Parameters: HistoryDepth - numbe
FREE
Comparator
Stanislav Korotky
4.75 (4)
This indicator compares the price changes during the specified period for the current symbol and other reference symbol. It allows to analyze the similar movements of highly correlated symbols, such as XAUUSD and XAGUSD, and find their occasional convergences and divergences for trading opportunities. The indicator displays the following buffers: light-green thick line - price changes of the current symbol for TimeGap bars; light-blue thin line - price changes of the reference symbol ( LeadSymbo
FREE
SOMFX1Builder
Stanislav Korotky
5 (1)
If you like trading by candle patterns and want to reinforce this approach by modern technologies, this script is for you. In fact, it is a part of a toolbox, that includes a neural network engine implementing Self-Organizing Map (SOM) for candle patterns recognition, prediction, and provides you with an option to explore input and resulting data. The toolbox contains: SOMFX1Builder  - this script for training neural networks; it builds a file with generalized data about most characteristic pric
FREE
Year2Year
Stanislav Korotky
This indicator shows price changes for the same days in past years. D1 timeframe is required. This is a predictor indicator that finds D1 bars for the same days in past 8 years and shows their relative price changes on the current chart. Parameters: LookForward - number of days (bars) to show "future" price changes; default is 5; Offset - number of days (bars) to shift back in history; default is 0; ShowAverage - mode switch; true - show mean value for all 8 years and deviation bounds; false - s
FREE
Mirror
Stanislav Korotky
This indicator predicts rate changes based on the chart display principle. It uses the idea that the price fluctuations consist of "action" and "reaction" phases, and the "reaction" is comparable and similar to the "action", so mirroring can be used to predict it. The indicator has three parameters: predict - the number of bars for prediction (24 by default); depth - the number of past bars that will be used as mirror points; for all depth mirroring points an MA is calculated and drawn on the ch
If you like trading crosses (such as AUDJPY, CADJPY, EURCHF, and similar), you should take into account what happens with major currencies (especially, USD and EUR) against the work pair: for example, while trading AUDJPY, important levels from AUDUSD and USDJPY may have an implicit effect. This indicator allows you to view hidden levels, calculated from the major rates. It finds nearest extremums in major quotes for specified history depth, which most likely form resistence or support levels, a
EvoLevels
Stanislav Korotky
The indicator displays most prominent price levels and their changes in history. It dynamically detects regions where price movements form attractors and shows up to 8 of them. The attractors can serve as resistance or support levels and outer bounds for rates. Parameters: WindowSize - number of bars in the sliding window which is used for detection of attractors; default is 100; MaxBar - number of bars to process (for performance optimization); default is 1000; when the indicator is called from
ExtraMovingPivots
Stanislav Korotky
This is an intraday indicator that uses conventional formulae for daily and weekly levels of pivot, resistance and support, but updates them dynamically bar by bar. It answers the question how pivot levels would behave if every bar were considered as the last bar of a day. At every point in time, it takes N latest bars into consideration, where N is either the number of bars in a day (round the clock, i.e. in 24h) or the number of bars in a week - for daily and weekly levels correspondingly. So,
Most of traders use resistance and support levels for trading, and many people draw these levels as lines that go through extremums on a chart. When someone does this manually, he normally does this his own way, and every trader finds different lines as important. How can one be sure that his vision is correct? This indicator helps to solve this problem. It builds a complete set of virtual lines of resistance and support around current price and calculates density function for spatial distributi
The indicator draws a histogram of important levels for several major currencies attached to the current cross rates. It is intended for using on charts of crosses. It displays a histogram calculated from levels of nearest extremums of related major currencies. For example, hidden levels for AUDJPY can be detected by analyzing extremums of AUD and JPY rates against USD, EUR, GBP, and CHF. All instruments built from these currencies must be available on the client. This is an extended version of
StatBars
Stanislav Korotky
The indicator provides a statistic histogram of estimated price movements for intraday bars. It builds a histogram of average price movements for every intraday bar in history, separately for each day of week. Bars with movements above standard deviation or with higher percentage of buys than sells, or vice versa, can be used as direct trading signals. The indicator looks up current symbol history and sums up returns on every single intraday bar on a specific day of week. For example, if current
PriceProbability
Stanislav Korotky
This is an easy to use signal indicator which shows and alerts probability measures for buys and sells in near future. It is based on statistical data gathered on existing history and takes into account all observed price changes versus corresponding bar intervals in the past. The statistical calculations use the same matrix as another related indicator - PointsVsBars. Once the indicator is placed on a chart, it shows 2 labels with current estimation of signal probability and alerts when signal
CCFpExtra
Stanislav Korotky
CCFpExtra is an extended version of the classic cluster indicator - CCFp. This is the MT4 version of indicator  CCFpExt available for MT5. Despite the fact that MT5 version was published first, it is MT4 version which was initially developed and tested, long before MT4 market was launched. Main Features Arbitrary groups of tickers or currencies are supported: can be Forex, CFDs, futures, spot, indices; Time alignment of bars for different symbols with proper handling of possibly missing bars, in
PriceProbabilities
Stanislav Korotky
This is a signal indicator for automatic trading which shows probability measures for buys and sells for each bar. It is based on statistical data gathered on existing history and takes into account all observed price changes versus corresponding bar intervals in the past. The core of the indicator is the same as in PriceProbablility indicator intended for manual trading. Unlike PriceProbability this indicator should be called from MQL4 Expert Advisors or used for history visual analysis. The in
FreqoMeterForecast
Stanislav Korotky
The main idea of this indicator is rates analysis and prediction by Fourier transform. Indicator decomposes exchange rates into main harmonics and calculates their product in future. You may use the indicator as a standalone product, but for better prediction accuracy there is another related indicator - FreqoMaster - which uses FreqoMeterForecast as a backend engine and combines several instances of FreqoMeterForecast for different frequency bands. Parameters: iPeriod - number of bars in the ma
FreqoMaster
Stanislav Korotky
The main idea of this indicator is rates analysis and prediction by Fourier transform. The indicator decomposes exchange rates into main harmonics and calculates their product in future. The indicator shows 2 price marks in history, depicting price range in the past, and 2 price marks in future with price movement forecast. Buy or sell decision and take profit size are displayed in a text label in the indicator window. The indicator uses another indicator as an engine for calculations - FreqoMet
筛选:
[删除] 2019.01.14 08:28 
 

用户没有留下任何评级信息

回复评论