Blahtech Market Profile MT5
- 指标
-
Blahtech Limited
 Professional IT developer with over 20 years of experience working with top tier investment banks (Barclays Capital, Credit Suisse, Merrill Lynch, ABN Amro, Mizuho Bank) - LinkedIn profile available on request
 - 版本: 4.1
- 更新: 2 七月 2024
- 激活: 8
Was: $249 Now: $99
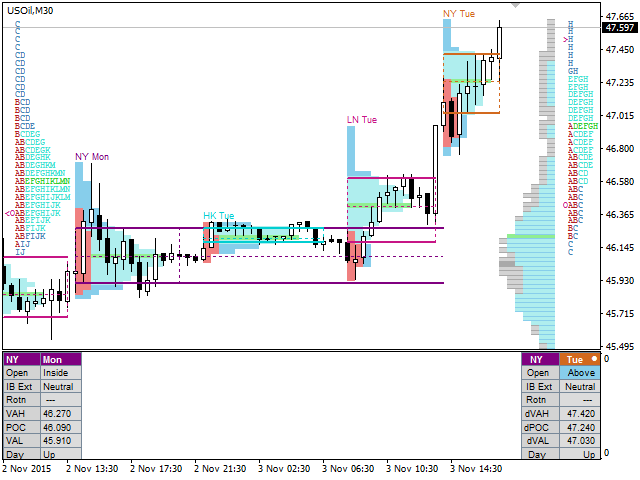
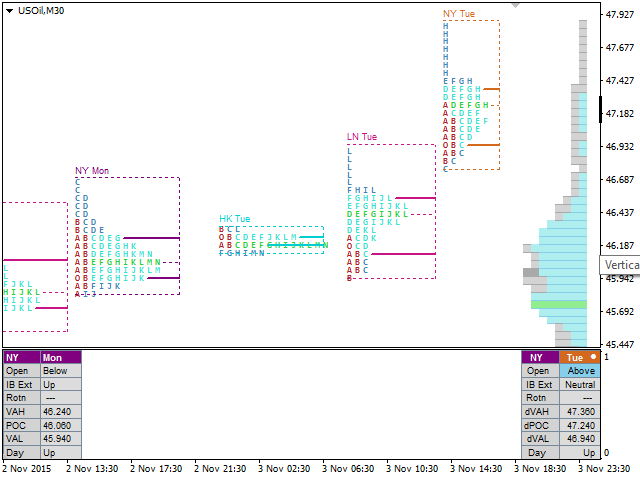
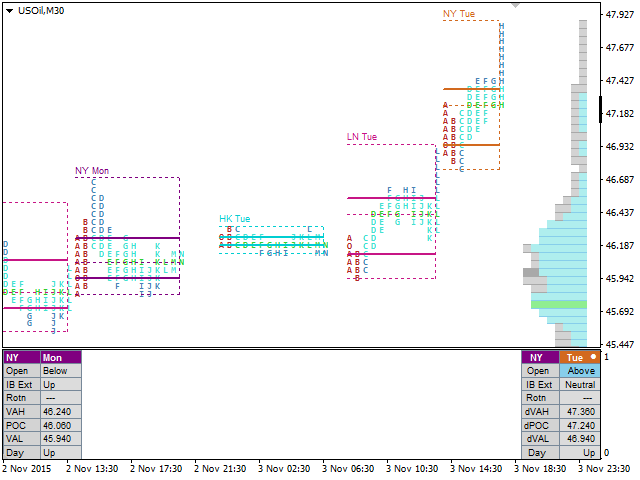
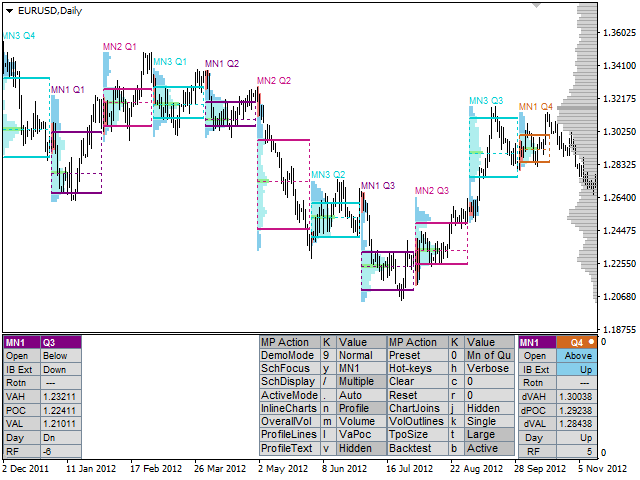
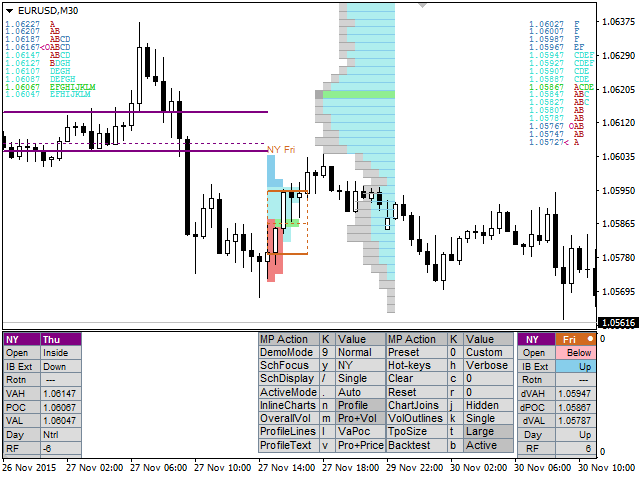
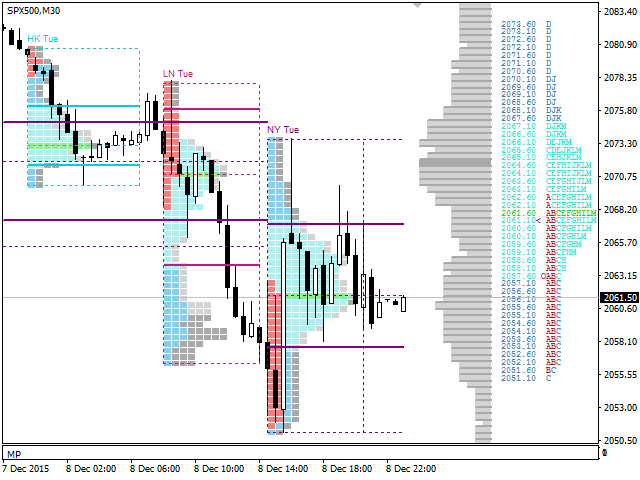
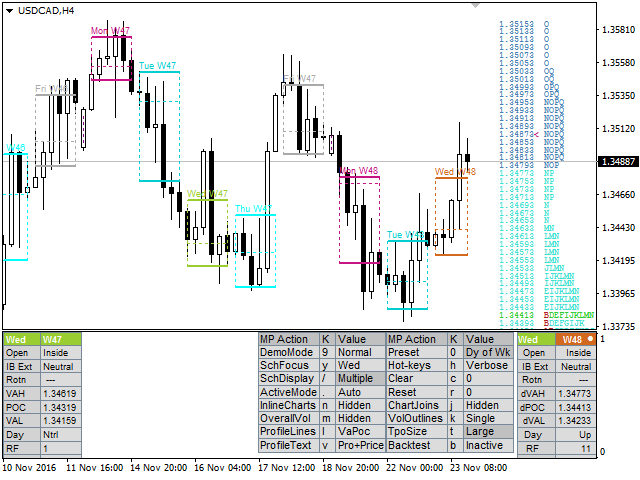
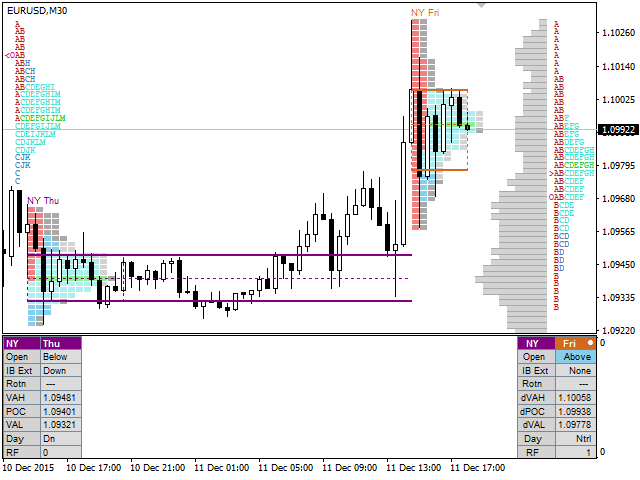
Market Profile defines a number of day types that can help the trader to determine market behaviour. A key feature is the Value Area, representing the range of price action where 70% of trading took place. Understanding the Value Area can give traders valuable insight into market direction and establish the higher odds trade. It is an excellent addition to any system you may be using.
Inspired by Jim Dalton’s book “Mind Over Markets”, this indicator is designed to suit the needs of all profile traders. It delivers functionality usually only available on futures platforms and adds innovations like auto focus switching and backtest mode.
Links [ Documentation | Install | Update | Training | All Products ]
Feature Highlights
- Configuration presets for schedules on higher timeframes
- Auto switching of focus to next active session
- Highlight of business rules – Open, IB Extension and Rotation Rules
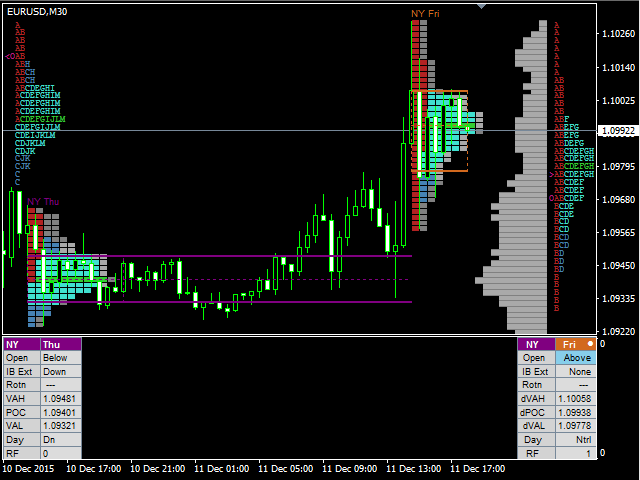
- Backtest directly on the chart
- Custom sessions, intervals and timeframe period
- Overall market and volume profiles
- Text based TPO profiles
- Configurable TPO start letter
- Value Areas, Initial balance, Point of control
- Fast access hot-keys
Full parameter documentation - https://www.mql5.com/en/blogs/post/700844
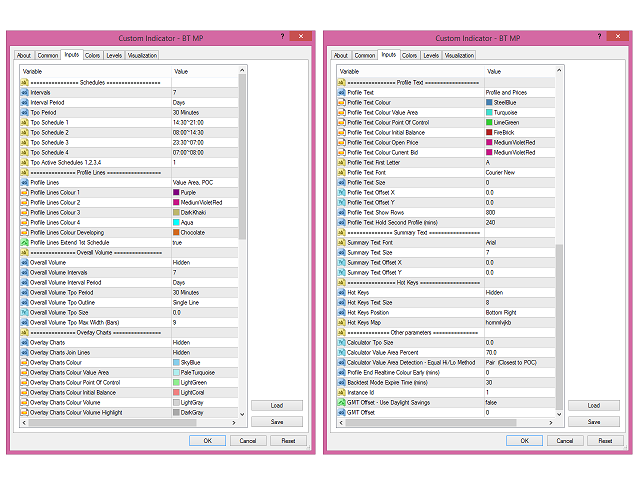
Input Parameters
Presets
- Configuration Preset – Choose custom or predefined schedules. Hotkey “0”
Schedules
- Intervals- Number of interval periods to display
- Interval Period - Timeframe of the intervals (Days)
- TPO Period - Timeframe for each TPO row (30 mins)
- TPO size
- TPO Schedule 1-7
- TPO Schedule Names
- TPO Schedule Display - Single / Multi. Hotkey “/”
- TPO Schedule Active Mode - Auto/Man. Hotkey “.”
- TPO Active Schedules - e.g. 2,1,3
Profile Lines
- Profile Lines - Choose which lines are shown on chart. Hot-Key "L"
- Profile Lines Colour 1-7, styles, fonts
- Profile Lines Width Horizontal
- Profile Lines Width Vertical - (0 to remove)
- Profile Lines Titles - Choose the titles to be displayed on the chart
- Profile Lines Extend Active Schedule - Extend previous active schedule lines to the next interval
Overall Volume
- Overall Volume - Display graphic profile. Hot-Key "M"
- Overall Volume Interval Period - Timeframe of the intervals (Days)
- Overall Volume TPO Period - Timeframe for each TPO row (30 mins)
- Overall Volume TPO size
- Overall Volume TPO Outline - Outline style (Single line). Hot-Key "K"
- Overall Volume Highlight Value Area
- Overall Volume Custom Schedule
Overlay Charts
- Overlay Charts - Display graphic profile. Hot-Key "N"
- Overlay Charts Join Lines - Separators between each TPO. Hot-Key "J"
- Overlay Charts Colours x7
Profile Text
- Profile Text – Display text profile at the sides of the chart. Hot-Key "V"
- Profile Text Colours x6
- Profile Text Show Rows - Set limit for the maximum number of TPO rows to display
- Profile Text First Letter - Start char for TPO letters (A)
Summary Text
- Summary Text Font, Size, positions
- Summary Text Composite Day Text
Hot Keys
- Hot Keys - Display Hot Keys dialog. Hot-Key "H"
- Hot Keys Text Size, Positions
- Hot Key Map - Keyboard hot-key input map - Allows the user to re-assign the hot-keys
Other Parameters
- Instance Id - Unique id for multiple instances per chart
- Calculator Tpo Size Factor - Normal/Large TPO scaling. Hotkey “T”
- Calculator Value Area Percent - TPO within the Value Area (70%)
- Configuration Presets – Overall Volume Intervals – Override for presets
- GMT Offset - Use Daylight Savings - Use Daylight savings. Adjust the time by 1 hour in March/September
- GMT Offset - Manual GMT offset in seconds


N°1 Form the middle of trading, A+++++++++++++++++++