Supply Demand Ranger

5
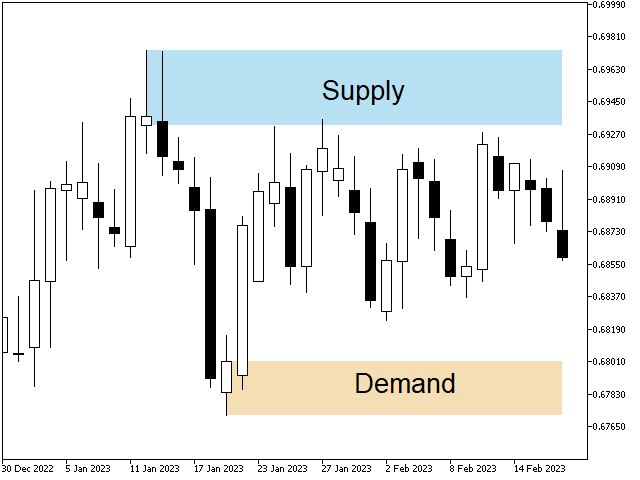
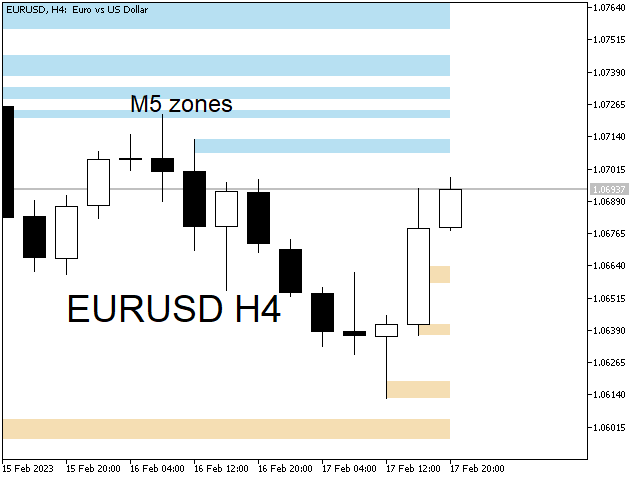
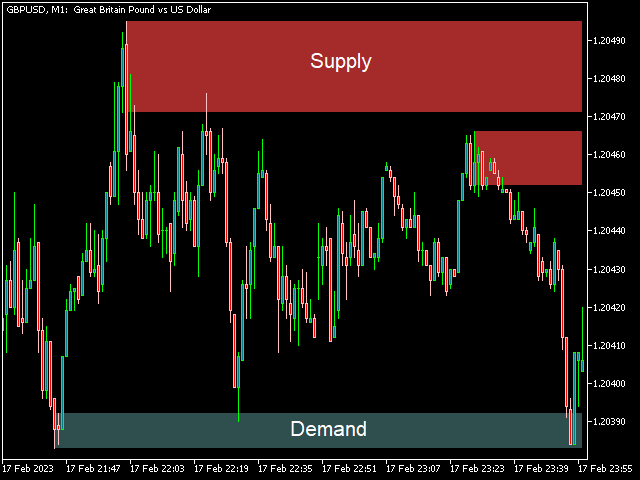
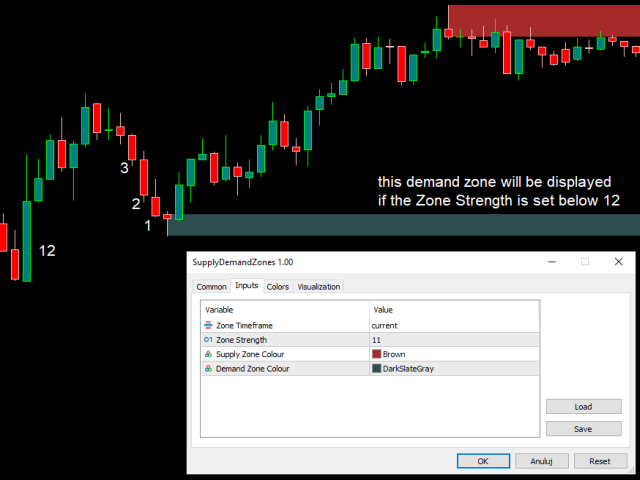
The indicator draws supply and demand zones. The zone timeframe can be set independently of the chart timeframe. For instance, it is possible to set M5 zones on an H4 chart. The importance of zones can be adjusted using the zone strength parameter. Demand zones are displayed if at least one candle in the range of the zone is entirely above the zone. Similarly, supply zones are displayed if at least one candle within the zone is entirely below the zone.
评分 5
Danushka Basnayaka
42
Danushka Basnayaka 2024.12.11 12:53 
 

The Supply Demand Ranger is an incredibly helpful indicator. It has significantly improved my trading accuracy by identifying key supply and demand zones effectively. The interface is user-friendly, and the signals are precise, making it an essential tool for any trader. Additionally, the developer's support is outstanding. They are responsive, professional, and always ready to assist with any questions or issues. It's rare to find such excellent customer support these days. Overall, I highly recommend this indicator to traders looking to enhance their analysis and decision-making

mrobat
19
mrobat 2024.12.03 18:58 
 

Bardzo polecam. W mojej strategii niezastąpiony. Działa świetnie na wszystkich interwałach czasowych.

Karolina Merchel
38
Karolina Merchel 2024.03.14 22:09 
 

wskaznik na poczatku nie dzialal jak ten na mt4, ale po jego przenastawieniu naprawde dziala i jeszcze lepiej jak ten na mt4. super praca. dzekuje panu Krzysztofowi za pomoc z nastawieniem wskaznika.

推荐产品
Auto Fab
Thabang John Wotsa
Indicator Overview AUTO FAB   is a professional, fully-automated Fibonacci retracement indicator for MetaTrader 5 that combines advanced technical analysis with an intuitive control panel. It automatically detects significant swing points and draws Fibonacci retracement levels in real-time, giving traders a powerful tool for identifying potential support/resistance levels and market reversal points.   Core Features 1.   AUTOMATIC SWING POINT DETECTION Smart Algorithm : Automatically identifies s
TRI Visualizer
Yoshimi Mon 三 Ura
TRI Visualizer MT5 – Thermodynamic Market Analysis Overview The TRI (Thermal Range Indicator) Visualizer Enhanced is a rare market analysis indicator that goes beyond conventional technical analysis, applying principles of thermodynamics from physics. It interprets market price fluctuations as “thermodynamic energy,” enabling the highly accurate detection of subtle market changes that are often overlooked. Innovative Mechanisms 1. Dual Calculation Engines Classic TRI Mode Formula: |Close
Mega Indicator MT5
Szymon Palczynski
Price reach indicator. It also serves as the perfect term for supports and resistance. I use it in two experts. The basic tool for professional trading. The indicator analyzes the last 500 bar and uses this to determine the levels ( but it doesn't predict the future ) . Personally, I use it on TF H1.  It is very simple. Four lines on chart and that's all. Only two input parameters.  Thousands of indicators. Why this? Is good ? No! Is very good. Please test the indicator prior to purchasing. You
PipFinite Binary Options PRO MT5
Karlo Wilson Vendiola
4.29 (14)
This LEGIT Indicator Can Accurately Predict the Outcome of One Bar. Imagine adding more filters to further increase your probability! Unlike other products, Binary Options PRO can analyze past signals giving you the statistical edge. How Increase Your Probability Information revealed here www.mql5.com/en/blogs/post/727038 NOTE: The selection of a Good Broker is important for the overall success in trading Binary Options. Benefits You Get Unique algorithm that anticipates price weakness. Gene
可以说,这是您可以为MetaTrader平台找到的最完整的谐波价格形成自动识别指标。它检测19种不同的模式,像您一样认真对待斐波那契投影,显示潜在的反转区域(PRZ),并找到合适的止损和获利水平。 [ 安装指南 | 更新指南 | 故障排除 | 常见问题 | 所有产品 ] 它检测19种不同的谐波价格形态 它绘制了主要,衍生和互补的斐波那契投影(PRZ) 它评估过去的价格走势并显示每个过去的形态 该指标分析其自身的质量和性能 它显示合适的止损和获利水平 它使用突破来表明合适的交易 它在图表上绘制所有样式比率 它实现了电子邮件/声音/视觉警报 受斯科特·M·卡尼(Scott M. Carney)的书的启发,该指标旨在满足最纯粹和最熟练的交易者的需求。但是,它采取了一种使交易更容易的方式:在向交易发出信号之前,它会等待Donchian朝正确方向突破,从而使交易信号非常可靠。 斐波那契投影与向量无关 它实现了电子邮件/声音/推送警报 它绘制了ABCD投影 重要提示: 为了符合 Scott M. Carney先生 的商标申诉,某些图案名称已重命名为不言自明的替代方式, Scott M.
PipFinite Trend PRO MT5
Karlo Wilson Vendiola
4.84 (557)
Breakthrough Solution For Trend Trading And Filtering With All Important Features Built Inside One Tool! Trend PRO's smart algorithm detects the trend, filters out market noise and gives entry signals with exit levels. The new features with enhanced rules for statistical calculation improved the overall performance of this indicator. Important Information Revealed Maximize the potential of Trend Pro, please visit www.mql5.com/en/blogs/post/713938 The Powerful Expert Advisor Version Automatin
Crypto_Forex 指标 PINBAR 模式适用于 MT5,无需重绘,无延迟。 .............................................................................. - “PINBAR 模式”指标是一款非常强大的价格行为交易指标。 - 指标可检测图表上的 PinBar: - 看涨 PinBar - 图表上显示蓝色箭头信号(见图)。 - 看跌 PinBar - 图表上显示红色箭头信号(见图)。 -   支持电脑和移动设备提醒 。 - “PINBAR 模式”指标非常适合与支撑/阻力位结合使用。 .................................................... 点击这里查看高质量的交易机器人和指标! 本产品为独家产品,仅在本 MQL5 网站上提供。
Doctor Edge Strategy Pro – Range & Breakout Zones Doctor Edge Strategy Pro is a professional indicator designed to simplify market reading based on range and breakout zones. It combines concepts of Price Action, ICT, and Smart Money Concepts, providing an automated and precise approach for traders of synthetic indices, cryptocurrencies, and Forex pairs. How It Works Doctor Edge Strategy Pro automatically draws on the chart: The range zone (lateral accumulation); The upper breakout zone (gr
CandleSignals
Roman Surmanidze
What this indicator does. Detects candlestick patterns such as: Hammer – indicates a possible bullish or bearish trend. Engulfing – a strong momentum signal. Doji – market uncertainty or potential reversal. Three White Soldiers – a strong uptrend. Three Black Crows – a strong downtrend. Morning Star – the beginning of an uptrend. Evening Star – the beginning of a downtrend. Shows signals on the chart: Can send a voice, email or pop-up notification when a pattern appears.
# 回撤指标 V4.0 - 掌控交易的必备工具 ## 通过完整的实时绩效概览改变您的交易 在要求严苛的外汇和差价合约交易世界中,**了解您的实时绩效**不是奢侈品,而是**绝对必需**的。**回撤指标 V4.0** 不仅仅是一个简单的指标:它是您的**专业仪表板**,为您提供清晰、精确和即时的交易账户状态视图。 --- ## 为什么这个指标将永远改变您的交易 ### 90% 交易者面临的问题 您是否曾经遇到过以下情况之一? **您不确切知道自己的状况** - 您的 MT5 平台显示数字,但您必须心算您的真实表现。 **您发现回撤为时已晚** - 当您意识到已经损失了 15% 的资金时,已经太晚了,无法有效应对。 **您缺乏历史可见性** - 无法快速知道本周、本月或今年是否盈利。 **您浪费时间分析交易** - 您必须打开多个窗口、进行计算,并失去对市场的关注。 **您没有概览** - 有多少持仓?我的全局盈亏是多少?我今天的表现如何? ### 解决方案:一体化专业仪表板 **回撤指标 V4.0** 通过提供一个**完整的控制面板*
Harmonic Pattern Hunter
Shingidzano Lesetedi
Harmonic Pattern Hunter Harmonic Pattern Hunter is a technical indicator for MetaTrader 5 that automatically identifies and draws high-probability harmonic patterns directly on the chart. It is designed to assist traders who use harmonic analysis as part of their trading methodology. How It Works The indicator scans historical and live price data for completed XABCD harmonic structures using Fibonacci ratio validation. When a valid pattern is detected, it draws the full pattern geometry, marks t
FILH Index Pro
Aiman Saeed Salem Dahbag
Indicator Description: The Advanced Force Index combines volume and price to determine the strength  of the trend. It has been developed to provide an accurate measurement of  seller and buyer power in the market, with multiple smoothing and display options. Key Features: Two display modes: Colored Histogram (bicolor) or Solid Line 4 Moving Average methods: SMA, EMA, SMMA, LWMA 7 Price types: Close, Open, High, Low, Median, Typical, Weighted Both volume types supported: Tick Volum
FREE
Click2FiboDrawer – Instantly Draw Fibonacci Retracement Lines with 2 Clicks Click2FiboDrawer is a powerful manual drawing tool for discretionary traders who use Fibonacci retracements in their technical analysis. With just two mouse clicks, you can draw clean and precise Fibonacci levels directly on your chart — no clutter, no menus, no hassle. Even during fast-paced scalping sessions, this tool enables you to quickly add Fibonacci retracement levels and react to market moves in real-time. It’s
##   ONLY GOLD ##   Тiльки Золото ## **Mercaria Professional Trading Zones - Complete Guide** ## **Mercaria Professional Trading Zones - Повний посібник** ### **How Mercaria Zones Work / Як працюють зони Mercaria** **English:** Mercaria Zones is an advanced trading indicator that identifies high-probability support and resistance areas using ZigZag extremes combined with mathematical zone calculations. The indicator works on multiple timeframes simultaneously, providing a comprehensive view
Naturu
Ivan Stefanov
5 (1)
“Naturu” 是一个使用大自然对称性作为算法的手动指标。 用简单策略和隐藏智慧,掌控市场! 加载指标后,您会看到两条线——上线(Top)和下线(Bottom)。 单击一次即可激活某条线。要移动,只需点击您想放置该线的那根K线。 您设定一个高点和一个低点,指标会自动计算: 洋红色区域,显示多空双方兴趣最接近之处,也就是最有可能成为支撑/阻力的区域。 灰色区域,标示下一层次的关注区。 青绿色线条,表示多方的目标价位。 金色线条,表示空方的目标价位。 手动指标赋予您完全的控制和灵活性,让您根据实时市场环境和个人直觉调整级别。它们迫使您更深入地亲自分析价格走势,帮助您真正理解支撑、阻力和形态是如何形成的。依靠人工判断,可以过滤掉自动系统常常误判的大量“噪音”,减少错误信号。而且,因您亲自设定每个级别,可在突发新闻或极端行情时立即调整,无需等候代码更新。 隐藏于简单游戏背后的神圣力量!
Visual CrossPulse Dynamics Indicator
AL MOOSAWI ABDULLAH JAFFER BAQER
Visual CrossPulse Dynamics: Trade with the Market's True Rhythm Unlock a new level of market insight with Visual CrossPulse Dynamics, a sophisticated trading indicator designed to adapt to ever-changing volatility and reveal the true direction of the trend. Are you tired of indicators that lag in fast-moving markets or give false signals during consolidation? The Visual CrossPulse Dynamics indicator solves this problem by using an advanced, adaptive algorithm that intelligently adjusts to the m
US30NinjaMT5
Satyaseelan Shankarananda Moodley
US30 Ninja is a 5 minute scalping indicator that will let know you when there is a trade set up (buy or sell). Once the indicator gives the trade direction, you can open a trade and use a 30 pip stop loss and a 30 pip to 50 pip take profit. Please trade at own own risk. This indicator has been created solely for the US30 market and may not yield positive results on any other pair. 
Fractal 358 Plus
Renato Fridschtein
Fractal 358 Plus is a predictive indicator that provides the clearest sight of price movements. Identifying graphic patterns such as Caixote (Crate), Pivot and Inside Candle , it shows entries and exits spots, as well as threats to your trades in the markets. It comes ready to use with B3 Mini Index (WIN$ series) and can be adjusted to use with any asset and timeframe. Fractal 358 unravels price movement Based on the Fibonacci sequence, Fractal 358 is a new and different way of reading and und
RBreaker
Zhong Long Wu
RBreaker Gold Indicators 是黄金期货一种短线日内交易策略,它结合了趋势跟踪和日内反转两种交易方式,既能捕捉趋势行情的利润,又能在行情反转时及时止盈并顺势反手。 该策略曾连续15年被美国《Futures Truth》杂志评选为前十大最赚钱的交易策略之一,具有很长的生命周期,至今仍在国内外普遍使用与研究。 本指标结合了2026年期货黄金的走势,依据14日ATR指标,分别定义了突破系数A,观察系数B,反转系数R更合理的数值,非常不错的指标,已实现年稳定盈利,值得推荐~ 以上指标适合高波动品种,参数适合期货黄金,股指期货等,如果需要其他品种行情,需要单独设定 突破系数A,观察系数B,反转系数R,进行回测才能使用。 欢迎指标售后有问题可以加+V:504282029
Candle hunter
Ruslan Khasanov
5 (1)
圖形分析指標。 在圖表上標記主要的日本燭台形態。 目前,交易者可以使用以下一組模式:  - Bearish/Bullish Abandoned Baby;  - Bearish Advance Block;  - Bearish Deliberation;  - Bearish/Bullish Belt Hold;  - Bearish/Bullish Engulfing;  - Bearish Shooting Star;  - Bearish Evening Star;  - Bearish Evening Doji Star;  - Bearish/Bullish Doji Star;    - Bearish/Bullish Tri-Star;  - Bearish Hanging Man;  - Bearish/Bullish Harami;  - Bearish/Bullish Harami Cross;  - Bearish Two Crows;  - Bearish Identical Three Crows;  - Bearish Three Black Crows
DAILY OH/OL SDEV QUANT MODEL - STATISTICAL TRADING WITH PRECISION RISK MANAGEMENT TRADE WITH MATHEMATICAL CERTAINTY - KNOW YOUR EXACT STOP-LOSS AND TAKE-PROFIT BEFORE YOU ENTER This indicator analyzes 5,000+ days of price history to give you: Exact entry levels (sigma bands locked at daily open) Exact stop-loss distance (from M
Stratos Pali mt5
Michela Russo
4.5 (8)
Stratos Pali Indicator is a revolutionary tool designed to enhance your trading strategy by accurately identifying market trends. This sophisticated indicator uses a unique algorithm to generate a complete histogram, which records when the trend is Long or Short. When a trend reversal occurs, an arrow appears, indicating the new direction of the trend. Important Information Revealed Leave a review and contact me via mql5 message to receive My Top 5 set files for Stratos Pali at no cost ! Down
Trend Wave MT5
Mehrnaz Eshaghzadehal
The Trend Wave indicator for MetaTrader 5 ( MT5 ) is a reliable tool designed to help traders effectively identify market trends and potential reversals . By utilizing oscillating wave patterns, this indicator provides clear visual signals, enabling traders to capitalize on price movements . Whether you are a day trader or a swing trader , this indicator is a versatile addition to your trading toolkit, simplifying complex market analysis.
ALIEN Dashboard
Youssef Esseghaiar
ALIEN DASHBOARD FULL EDITION – Professional ICT & Precision Trading Dashboard for MT5 ( HYBRID ENGINE ) Overview The   Alien Dashboard Full Edition   is a comprehensive, all‑in‑one technical indicator for MetaTrader 5 that merges the most powerful concepts from Inner Circle Trader (ICT) methodology with advanced precision‑entry logic, multi‑timeframe analysis, and an intuitive on‑chart dashboard. Designed for serious traders who want to visualise institutional order flow, identify high‑probabili
The diamond top and bottom are reversal patterns. It represents a rally to a new high with a drop to a support level followed by a rally to make a new high and a quick decline, breaking the support level to make a higher low. The bounce from the higher low is then followed by a rally, but making a lower high instead. Once this behavior is identified, prices then break the trend line connecting the first and second lows and start to decline further. You can find MT4 version hier Indicator shows
相对强弱指数(RSI) 多货币扫描仪 MT5 是一款创新的交易工具,旨在帮助交易者有效地同时监控多个货币对。通过利用强大的 RSI 指标,该扫描仪提供市场状况的全面概述,帮助交易者识别各个时间框架内的潜在交易机会。 该指标通过以用户友好的格式呈现关键信号,提供了显著的优势。交易者可以根据自己的策略自定义设置,使其成为初学者和经验丰富的交易者提升市场分析和决策过程的理想解决方案。 MQL产品安装指南 | 在 MT4/MT5 上更新已购买的MQL产品 | 常见故障排除指南 | 指标设置 / 指南 主要特点 缓冲区集成:将指标值暴露为可访问的缓冲区,允许 Expert Advisor 读取自动交易信号。 可视化箭头信号:在信号蜡烛图上直接显示清晰的买入/卖出箭头,便于视觉阅读。 快速且可回测:基于 MetaTrader 的本机 OnCalculate() 引擎构建,确保快速执行并兼容历史回测。 弹出警报:在信号事件上发送 MetaTrader 警报弹窗,让您不错过任何交易设置。 推送通知:为您的 MetaTrader 移动应用提供实时推送通知,便于随时监控。 电子邮件警报:在信号事件上发送电
"Impulses and Corrections 5" is created to help traders navigate the market situation. The indicator shows multi-time frame upward and downward "Impulses" of price movements. These impulses are the basis for determining the "Base" , which is composed of zones of corrections of price movements, as well as "Potential" zones for possible scenarios of price movement. Up and down impulses are determined based on a modified formula of Bill Williams' "Fractals" indicator. The last impulse is always "U
Maximum Trend Arrows OT MT5
Mulweli Valdaz Makulana
STRICTLY FOR BOOM INDEX ONLY!!!!! Here I bring the Maximum Trend Arrows OT1.0 MT5 indicator. This indicator is made up of a combination of different trend indicators for entries and exits, for entries an orange arrow will paint on the chart below the current market and a red flag for closing of trades and it produces buy arrows only. When the orange arrow appears, it will appear along with it's sound to notify you. The 1H timeframe is recommended, don't use it anywhere else than on the 1H timefr
Engulfing with EMAs Indicator Unlock the power of advanced candlestick pattern detection with the Engulfing with EMAs Indicator , a cutting-edge tool designed for MetaTrader 5. This futuristic indicator combines the precision of engulfing pattern analysis with the trend-following strength of Exponential Moving Averages (EMA 21 and EMA 50), empowering traders to identify high-probability setups across all currency pairs and timeframes. Key Features: Comprehensive Engulfing Detection : Detects b
该产品的买家也购买
ARIPoint
Temirlan Kdyrkhan
ARIPoint is a powerful trading companion designed to generate high-probability entry signals with dynamic TP/SL/DP levels based on volatility. Built-in performance tracking shows win/loss stats, PP1/PP2 hits, and success rates all updated live. Key Features: Buy/Sell signals with adaptive volatility bands Real-time TP/SL/DP levels based on ATR Built-in MA Filter with optional ATR/StdDev volatility Performance stats panel (Success, Profit/Loss, PP1/PP2) Alerts via popup, sound, push, or email Cu
SuperScalp Pro
Van Minh Nguyen
4.63 (24)
SuperScalp Pro – 高级多重过滤剥头皮指标系统 SuperScalp Pro 是一款高级剥头皮交易指标,将经典 Supertrend 与多种智能确认过滤器结合,帮助识别交易机会。它可高效运行于 M1 至 H4 多个时间周期,并针对 XAUUSD、BTCUSD 及主要外汇货币对进行了优化。 该指标提供清晰的 Buy 和 Sell 信号,并基于 ATR 自动计算入场价、止损和止盈水平,帮助交易者更有效地管理风险。Fibonacci Take Profit 功能可在关键价格水平提前平仓,并在到达这些水平时发送通知,从而提升交易管理效率与稳定性。 默认配置已启用 Fibonacci Take Profit,专注于更稳定、更持续的交易体验。您只需将指标加载到图表即可立即开始使用,无需额外设置。对于高级用户,所有参数均可完全自定义,以适应不同交易策略和偏好。 SuperScalp Pro 集成了 EMA、RSI、ADX、Volume、VWAP、Bollinger Bands 和 MACD Divergence 等多种过滤器,有助于减少虚假信号并提高入场质量。指标还包含图表内交互控制面
Divergence Bomber
Ihor Otkydach
4.9 (89)
购买该指标的每位用户将额外免费获得以下内容: 原创工具“Bomber Utility”,该工具会自动跟踪每一笔交易,设置止损和止盈点,并根据策略规则自动平仓; 适用于不同交易品种的指标设置文件(Set 文件); 三种不同风险模式下的 Bomber Utility 设置文件:“最低风险”、“平衡风险” 和 “观望策略”; 一套详细的 视频操作手册,帮助您快速完成安装、配置并开始使用本交易系统。 注意: 要获取以上所有赠品,请通过 MQL5 的私人消息系统联系卖家。 我为您介绍原创的自定义指标 “Divergence Bomber”(背离轰炸机),它是一套基于 MACD 背离交易策略 的“全功能”交易系统。 该技术指标的主要任务是识别 价格与 MACD 指标之间的背离,并发出交易信号(包括推送通知),指示未来价格可能的运动方向。平均而言,这些信号的准确率超过 98%。有关该指标如何工作的详细说明,请观看本页面上的视频演示。 该系统使用 止损订单 和 动态回撤平仓机制 来管理交易。 Divergence Bomber 指标的主要特点: 支持交易的品种: AUDCAD、AUDCHF、AUDSG
Entry In The Zone and SMC Multi Timeframe is a real-time 2-in-1 market analysis tool that combines market structure analysis and a No Repaint BUY / SELL signal system into a single indicator, built on Smart Money Concepts (SMC) — a widely adopted framework used by professional traders to understand market structure. This indicator helps you see the market more clearly, make decisions based on structure rather than guesswork, and focus on high-probability zones where price is more likely to react
Power Candles MT5
Daniel Stein
5 (8)
Power Candles V3 - 自我优化的强度指标 Power Candles V3 把货币与品种的强度直接转化为图表上可执行的交易方案。指标不再仅根据强度给K线着色,而是在后台持续运行实时自动优化,为您正面对的品种给出最佳 Stop Loss、Take Profit 与信号阈值。一键采用,Entry、Stop Loss、Take Profit 线就以精确价格绘制在图表上,提醒消息中直接包含方向。 本工具是 Stein Investments 生态系统的一部分 - 18+ 款工具,加上 Max,您的一对一 AI 交易导师。  随时在线,深入了解每一款指标,在您需要梳理思路的那一刻就在那里。  立即认识他: https://stein.investments 每根收盘K线运行 3,000+ 次交易模拟。9 种强度状态。2 种策略并行测试。一键采用最优配置。 为什么需要这个 大多数强度指标只给您一个数值,然后留下三个问题:相信哪个阈值、用哪个 Stop Loss、走哪个交易方向。Power Candles V3 在每根收盘K线上自动回答这些问题。结果就是一个完整的交易方案 -
Gann Made Easy MT5
Oleg Rodin
5 (4)
Gann Made Easy   是一个专业且易于使用的外汇交易系统,它基于使用先生理论的最佳交易原则。 W.D.江恩。该指标提供准确的买入和卖出信号,包括止损和获利水平。您甚至可以使用推送通知在旅途中进行交易。 购买后请联系我,即可免费获得交易指导和超棒的额外指标! 您可能已经多次听说过江恩交易方法。通常 Gann 的理论不仅对于新手交易者而且对于那些已经有一定交易经验的人来说都是非常复杂的东西。这是因为江恩的交易方法在理论上并不那么容易应用。我花了几年时间来完善这些知识,并将最好的原则应用到我的外汇指标中。 该指标非常易于应用。您所需要的只是将其附加到您的图表并遵循简单的交易建议。该指标不断进行市场分析工作并寻找交易机会。当它检测到一个好的入口点时,它会为您提供一个箭头信号。该指标还显示止损和获利水平。 换句话说,当您像先生一样进行交易时,该指标会为您提供最佳江恩建议。江恩亲自告诉你此时此刻该做什么。但最好的部分是您不需要了解任何有关江恩交易原则的知识,因为该指标会为您完成整个市场分析工作。
SignalTech MT5
Yue Wang
5 (21)
SignalTech MT5 is an unique fully rule based trading system for EURUSD, USDCHF, USDJPY, AUDUSD, NZDUSD, EURJPY, AUDJPY, NZDJPY, CADJPY.  All the winning trades with chart setups are published on the comments page. 2026-05 2802 Pips (Until 05-15 NY Closed) 2026-04 2243 Pips 2026-03 2165 Pips 2026-02 2937 Pips 2026-01 2624 Pips 2025-12 1174 Pips It can generate signals with Buy/Sell Arrows and Pop-Up/Sound Alerts. Each signal has clear Entry and Stop Loss levels, which should be automatically flag
购买此指标即可免费获得我的专业交易管理器。 首先,值得强调的是,这个交易系统是一个非重绘、非重画和非滞后的指标,这使得它非常适合手动和机器人交易。 在线课程,手册和下载预设。 “智能趋势交易系统 MT5”是专为新手和经验丰富的交易者量身定制的综合交易解决方案。它结合了超过 10 个优质指标,具有 7 多个强大的交易策略,使其成为适用于各种市场条件的多功能选择。 趋势跟随策略:提供精确的入场和止损管理,以有效地跟随趋势。 反转策略:识别潜在的趋势反转,使交易者能够利用区域市场的机会。 剃头策略:专为快速准确的日内交易和短期交易而设计。 稳定性:所有指标都不会重绘、不会重画和不会滞后,确保可靠的信号。 定制:支持自定义策略,以满足个人交易偏好。超过 7 种策略和组合可帮助您找到最佳策略。 信号清晰度:提供箭头信号,以指示清晰的入场和退出点。 实时警报:通过交易进出警报使交易者保持了解。 深入分析:提供更高时间框架的趋势分析和实时交易监控。 自适应颜色编码:利用蜡烛颜色编码来显示成交量、趋势和反转蜡烛信号。通过蜡烛颜色分析市场方向。 “智能趋势交易系统 MT5”赋予交易者必要的工具,以便在
SMC Intraday Formula
Kareem Abbas
5 (9)
让我们先坦诚一点。 没有任何一个指标可以单独让你实现盈利。如果有人告诉你可以,那他是在向你兜售一个梦想。任何显示完美买卖箭头的指标都可以被做得看起来毫无瑕疵——只需要放大历史中的某一段并截取成功交易的截图。我们不会这样做。 SMC Intraday Formula 是一个工具。 它为你读取市场结构,标记出概率最高的价格区域,并用简单直白的语言准确告诉你当前智能资金的行为轨迹。你仍然需要做决定。你仍然需要执行交易。但现在,你是带着精确性执行,而不是靠希望。 我们已经在黄金(XAUUSD)以及主要外汇货币对的日内剥头皮交易中使用该指标将近三年。这是我们在 M1、M5、M15 和 M30 上的日常主力工具。它之所以有效,是因为它不试图预测未来——它展示的是当前正在形成的高概率交易机会,并解释 为什么 。 它与其他所有指标有什么不同? 大多数交易指标只做一件事。移动平均线交叉。振荡指标触及某个水平。出现一个箭头。你进场交易。你亏损。你责怪指标。重复。 SMC Intraday Formula 将多个机构级概念整合为一个统一的市场解读: - 斐波那契共振引擎 不只是普通的斐波那契水平——该指标
介绍     Quantum Breakout PRO   ,突破性的 MQL5 指标,正在改变您交易突破区域的方式!由拥有超过13年交易经验的资深交易员团队开发,     量子突破 PRO     旨在通过其创新和动态的突破区域策略将您的交易之旅推向新的高度。 量子突破指标将为您提供带有 5 个利润目标区域的突破区域的信号箭头,以及基于突破框的止损建议。 它既适合新手交易者,也适合专业交易者。 量子 EA 通道:       点击这里 重要的!购买后请私信我领取安装手册。 建议: 时间范围:M15 货币对:GBPJPY、EURJPY、USDJPY、NZDUSD、XAUUSD 账户类型:ECN、Raw 或 Razor,点差极低 经纪商时间:GMT +3 经纪商:IC Markets、Pepperstone with Raw 和 Razor 的点差最低 规格: 不重漆! 最多 5 个建议利润目标区域 建议止损水平 可定制的盒子。您可以设置自己的 Box Time Start 和 Box Time End。 接触 如果您有任何疑问或需要帮助,请通过私人消息与我联系。
Azimuth Pro
Ottaviano De Cicco
5 (7)
Azimuth Pro V2:MT5合成分形结构分析与确认入场 概述 Azimuth Pro 是 Merkava Labs 推出的多层级波段结构指标。四层嵌套波段层级、锚定波段的VWAP、ABC形态识别、三时间框架结构过滤以及收盘确认入场——一个图表,一个从微观波段到宏观周期的完整工作流程。 这不是盲目的信号产品。它是一个以结构为先的工作流程,专为重视位置、背景和时机的交易者打造。 V2上市优惠 — Azimuth Pro V2售价USD 399(接下来的100份)。最终价格:USD 499。 1. V2的变化 合成多时间框架引擎 高时间框架分析从零开始重建,采用与Meridian Pro相同的专有合成架构。更清晰的HTF背景、稳定的实时行为、无经典MTF同步问题。合成引擎还解锁了 固定比率时间框架级联 (x2、x3、x4、x6)——不再在经纪商的固定时间框架之间任意跳转,您可以按图表时间框架的固定倍数分析结构,在每个尺度上保持相同的分形关系。 确认入场箭头 作为稳定且可恢复的执行层而设计的收盘确认箭头。当ABC设置形成且自适应确认逻辑在收盘K线上验证方向时,箭头会写入下一根K线的
Meridian Pro
Ottaviano De Cicco
5 (2)
Meridian Pro 2.00:MT5 专业多周期趋势矩阵 Meridian Pro 2.00 是面向 MetaTrader 5 的专业自适应趋势矩阵。它结合了原始 Meridian 趋势引擎、清晰的图表 ribbon、收盘柱确认箭头、8 周期 dashboard、Fuel 动量、加权共识、合成 HTF 处理,以及直接显示在当前图表上的高周期环境线。 目标很简单:在一个有纪律的 workflow 中读取当前趋势、多周期结构、强度、动量和 EA-ready 状态,而不是在多个图表上堆叠互不关联的指标。 Meridian Pro 的不同之处 一个自适应引擎 - 同一套波动率感知 Meridian 逻辑应用于 M1 到 W1。 合成 HTF 架构 - 高周期行由低周期数据推导,减少传统零售 MTF 中常见的 repaint、同步延迟和 broker-dependent HTF 质量问题。 完整矩阵输出 - Bias、Strength、Fuel 和加权 Consensus 一起显示,而不是拆成独立工具。 图表执行层 - ribbon 和箭头专注于当前周期,选配 HTF 线在同一图表上增加高
FX Trend MT5 NG
Daniel Stein
5 (4)
FX Trend NG:新一代多市场趋势智能分析工具 概述 FX Trend NG 是一款专业的多时间周期趋势分析与市场监控工具,帮助您在几秒钟内全面了解市场结构。 无需在多个图表之间来回切换,您可以立即看到哪些品种处于趋势中、哪里动能正在减弱,以及哪些时间周期之间存在强烈共振。 限时发布优惠 – 仅需 $30(6个月) 或 $80 终身授权 即可拥有 FX Trend NG 。 已经是 Stein Investments 客户? -> 发送消息 以获取专属客户群访问权限。 需要帮助或安装指导? -> 请访问 Stein Investments 官方页面 。 1. FX Trend NG 的核心优势 三状态趋势逻辑 —— 不只是 Buy 或 Sell • 大多数指标仅显示两种状态:Buy 或 Sell。 • FX Trend NG 增加第三种状态: Fade 。 • Fade 表示趋势强度正在减弱,在完全反转之前提前发出信号。 这种结构化逻辑让您看到趋势变化过程,而不仅仅是简单方向信号。 多时间周期分析(M1 至 MN1) • 从短线交易到中长线交易全面覆盖。 • 快速识别趋势
首先,值得强调的是,这个交易工具是非重绘、非重画和非滞后的指标,非常适合专业交易。 在线课程,用户手册和演示。 智能价格行动概念指标是一个非常强大的工具,既适用于新手,也适用于经验丰富的交易者。它将超过20个有用的指标合并到一个指标中,结合了高级交易思想,如内圈交易员分析和智能资金概念交易策略。该指标侧重于智能资金概念,提供有关大型机构交易方式的见解,帮助预测它们的动向。 它在流动性分析方面尤其擅长,有助于理解机构的交易方式。它擅长预测市场趋势,并仔细分析价格波动。通过将您的交易与机构策略对齐,您可以更准确地预测市场走向。该指标多才多艺,擅长分析市场结构,识别重要的订单区块,并识别各种模式。 它擅长识别BOS和CHoCH等模式,理解动量的转变,并突出显示供需强劲的关键区域。它还擅长发现强大的不平衡,并分析价格创造更高高点或更低低点的模式。如果您使用斐波那契回撤工具,该指标可以满足您的需求。它还可以识别相等的高点和低点,分析不同的时间框架,并通过仪表板显示数据。 对于使用更高级策略的交易者,该指标提供了工具,如公平价值差指标和优惠和折扣区域的识别。它特别关注高时间框架订单区块,并
Basic Harmonic Patterns Dashboard MT5
Mehran Sepah Mansoor
4.36 (11)
该仪表盘显示所选符号的最新可用谐波形态,因此您可以节省时间并提高效率 /  MT4 版本 。 免费指标:  Basic Harmonic Pattern 指标列 Symbol:   显示所选符号 Trend:     看涨或看跌 Pattern:    形态类型(Gartley、蝴蝶、蝙蝠、螃蟹、鲨鱼、Cypher 或 ABCD) Entry:     入口价格 SL: 止损价 TP1: 第一止盈价 TP2: 第二次获利价格 TP3: 第三次获利价格 Current price:    当前价格 Age (in bars):   最后绘制的模式的年龄 主要输入 Symbols :   从 "28 种主要货币对 "或 "选定符号 "中选择。 Selected Symbols :   希望监控的符号,用逗号分隔("EURUSD,GBPUSD,XAUUSD")。如果您的经纪商为货币对设置了后缀或前缀,您必须在以下两个参数中添加(货币对前缀或货币对后缀)。 Max Iteration:   调整模式的最大迭代次数(如果该值越小,则模式越少,性能越快;如果该值越大,则模式越多,性能越慢)
KT Alpha Hunter Arrows MT5
KEENBASE SOFTWARE SOLUTIONS
大多数箭头指标只给你一个信号,然后让你自己去判断剩下的一切。KT Alpha Hunter Arrows 为你提供完整的交易计划。 每一个信号箭头出现时,都会同时绘制一套完整计划:入场线、止损位、四个止盈目标,以及实时优势判断,告诉你当前这个交易品种和时间周期是否值得交易。随附的 Trade Manager EA 会在你手动入场后负责后续执行,让你在市场波动剧烈、情绪干扰明显时也能保持交易纪律。不重绘。仅在K线收盘后确认信号。适用于 Forex、黄金、指数以及任何你在 MT5 上交易的品种。 核心功能 不重绘买入和卖出箭头,只在K线收盘后生成。 每个信号都会显示入场线、结构性止损位和四个止盈目标。 Edge Dashboard 会分别评估当前图表上的买入和卖出机会。 判断系统包括:No Edge、Marginal、Tradeable、Good 或 Strong。 一键 Auto Optimize 按钮可根据当前品种和时间周期自动优化设置。 完整套装包含 Trade Manager EA,并提供五种专为本指标设计的预设交易管理方案。 Prop Firm Risk Panel 可在图表上
FX Power MT5 NG
Daniel Stein
5 (31)
FX Power:分析货币强度,助您做出更明智的交易决策 概述 FX Power 是一款专业工具,帮助您全面了解主要货币和黄金在任何市场条件下的真实强度。通过识别强势货币用于买入,弱势货币用于卖出, FX Power 简化了交易决策,并帮助您发现高概率的交易机会。不论您是想跟随趋势还是通过极端的 Delta 值预测反转,这款工具都能完美适应您的交易风格。别再盲目交易——用 FX Power 让您的交易更加智慧。 1. 为什么 FX Power 对交易者极具价值 实时货币和黄金强度分析 • FX Power 实时计算并显示主要货币和黄金的相对强度,助您全面了解市场动态。 • 监控领先或落后资产,轻松识别值得交易的货币对。 全面的多时间框架视图 • 跟踪短期、中期和长期时间框架的货币和黄金强度,以便将您的交易策略与市场趋势保持一致。 • 无论是快进快出的短线交易还是更长期的投资策略, FX Power 都能为您提供所需的信息。 Delta 动态分析用于趋势和反转 • 极端 Delta 值常常预示反转机会,而平缓的 Delta 变化则确认趋势延续。 • 使用 Delta 分析,轻
Atomic Analyst MT5
Issam Kassas
3.94 (31)
首先值得强调的是,该交易指标是非重绘、非延迟的指标,这使其成为手动和机器人交易的理想选择。 用户手册:设置、输入和策略。 Atomic Analyst是一种PA价格行动指标,利用价格的力量和动量来寻找市场上更好的机会。配备了高级过滤器,可帮助去除噪音和假信号,并提高交易潜力。使用多层复杂的指标,Atomic Analyst扫描图表,并将复杂的数学计算转化为任何初学者都能理解并用来做出一致交易决策的简单信号和颜色。 “Atomic Analyst”是专为新手和经验丰富的交易者量身定制的综合交易解决方案。它将高级指标和一流功能融合为一体的交易策略,使其成为所有类型交易者的多功能选择。 日内交易和剥头皮策略:专为快速准确的日内交易和短期交易而设计。 日内和摆动交易策略:可用作追求价格大幅波动的日内和摆动交易者的可靠工具。 多货币和市场:凭借其可靠的精度,在不同的工具和市场上运作。 多个时间框架:可在多个时间框架上使用,性能良好。 稳定性:所有指标均不重绘、不重绘和不滞后,确保可靠的信号。 信号清晰度:提供箭头信号,用于清晰的入场和出场点。 实时警报:通过交易入场、SL和TP警报通知交易者
Trend Screener Pro MT5
STE S.S.COMPANY
4.85 (104)
使用趋势筛选指标释放趋势交易的力量:由模糊逻辑和多货币系统提供支持的终极趋势交易解决方案! 使用趋势筛选器(由模糊逻辑提供支持的革命性趋势指标)提升您的趋势交易。 它是一个强大的趋势跟踪指标,结合了超过 13 种高级工具和功能以及 3 种交易策略,使其成为使您的 Metatrader 成为趋势分析器的多功能选择。 限时优惠:趋势筛选指标终身仅需 65  美元。 ( 原价 250$ ) (优惠延长) 体验趋势筛选器 100% 无需重新绘制的准确性,确保您的交易决策不受过去价格变化的影响。 释放多时间框架和多货币功能的多功能性,使您能够以无与伦比的信心在外汇、商品、加密货币和指数领域进行交易。 利用 Trend Screener 的综合策略套件增强您的交易: - 趋势跟踪策略和趋势延续策略 :趋势筛选器的趋势跟踪策略提供清晰的趋势延续信号,让您有效捕捉趋势走势并管理风险。 - 反转策略和早期入场点策略 :趋势筛选器的反转策略可检测市场方向的潜在变化,使您能够预测趋势反转并利用疲弱的市场趋势。通过早期入场点,您可以在潜在的趋势变化之前定位自己 获取可观的利润。 - 倒卖策略: 趋势筛选器的倒
Quantum TrendPulse
Bogdan Ion Puscasu
5 (25)
介绍 Quantum TrendPulse   ,这是一款终极交易工具,它将 SuperTrend   、   RSI 和 Stochastic 的强大功能整合到一个综合指标中,以最大限度地发挥您的交易潜力。该指标专为追求精准和效率的交易者而设计,可帮助您自信地识别市场趋势、动量变化以及最佳进入和退出点。 主要特点: 超级趋势整合: 轻松跟随当前的市场趋势并乘上盈利浪潮。 RSI 精度: 检测超买和超卖水平,非常适合把握市场逆转时机,可用作 SuperTrend 的过滤器 随机精度: 利用随机振荡在波动的市场中寻找隐藏的机会, 用作超级趋势的过滤器 多时间范围分析: 从 M5 到 H1 或 H4,在不同时间范围内关注市场动态。 可定制的警报: 当您的自定义交易条件得到满足时收到通知,这样您就不会错过任何交易。 无论您是新手还是经验丰富的交易员,   Quantum TrendPulse 都能为您提供所需的优势,帮助您增强策略并自信地进行交易。借助这一强大的指标,将洞察力转化为利润 — 掌控您的交易! ***购买 Quantum TrendPulse,即可免费获得 Quantum Tr
Grabber System MT5
Ihor Otkydach
4.83 (23)
向您介绍一款优秀的技术指标——Grabber,它是一套即开即用的“全包式”交易策略。 在一个代码中集成了强大的市场技术分析工具、交易信号(箭头)、提醒功能和推送通知。 每位购买该指标的用户还可免费获得以下内容: Grabber辅助工具:用于自动管理已开仓位 视频操作指南:逐步教学如何安装、设置和使用该指标进行交易 原创Set文件:可快速自动配置,帮助实现最佳交易效果 忘掉其他策略吧!只有Grabber能够真正激励你在交易中攀登新高峰! Grabber策略的主要特点: 交易周期:从M5到H4 适用资产:任意,但我推荐我亲自测试过的品种(GBPUSD、GBPCAD、GBPCHF、AUDCAD、AUDUSD、AUDSGD、AUDCHF、NZDUSD、NZDCAD、EURCAD、EURUSD、EURAUD、EURGBP、EURCHF、USDCAD、USDSGD) 交易时间:全天候 24/7 交易效果:我分享自己的真实交易结果,并在此教学如何操作: https://www.mql5.com/ru/market/product/134563?source=Site+Market+MT5+Indic
Gem SIGNAL
Shengzu Zhong
GEM Signal Pro GEM Signal Pro 是一款適用於 MetaTrader 5 的趨勢跟隨指標,專為希望在圖表上獲得更清晰訊號、更有結構的交易設定,以及更實用風險管理的交易者而設計。 它不僅僅顯示一個簡單的箭頭,GEM Signal Pro 還能以更清晰、更易讀的方式呈現完整的交易思路。當條件確認完成後,指標可在圖表上顯示進場價、止損價與止盈目標,幫助交易者更有效率地評估交易設定。 運作方式 該指標首先根據其內部邏輯識別有效的初始訊號。 當確認條件滿足後,GEM Signal Pro 會在圖表上顯示完整的交易設定。這讓交易者可以更清楚地看到交易結構,並減少手動分析與計算的工作量。 圖表上的交易價位 對於已確認的訊號,GEM Signal Pro 可顯示: 進場價 止損價 止盈 1 止盈 2 止盈 3 風險報酬比 這讓交易設定更容易理解,也有助於讓圖表分析更有條理。 內建風險管理 風險管理是此指標設計的重要部分。 止損位基於近期市場結構,結合附近的擺動高低點與可選的 ATR 緩衝距離。這能讓交易價位更貼近當前市場條件,而不只是依賴固定距離。 圖表資訊面板 GEM Si
Entry Points Pro for MT5
Yury Orlov
4.48 (138)
这款指标用于 MT5,可提供准确的入场交易信号,且无重绘。 它可应用在任何金融资产:外汇、加密货币、贵金属、股票、指数。 它将提供极其精准的评估,并告诉您何时开仓和平仓的最佳时机。 观看 视频 (6:22),其中包含一个仅处理单一信号的示例,该信号即可值回指标购价! 大多数交易者在 Entry Points Pro 指标的帮助下,在第一个交易周内即改善了他们的交易结果。 订阅我们的 Telegram 群 ! Entry Points Pro 指标的益处。 入场信号无重绘 如果信号出现,并得到确认,则它不会再消失;不像是重绘指标,它会导致重大的财产损失,因为它们可以在显示信号后再将其删除。 无差错开仓 指标算法可令您找到入场交易(买入或卖出资产)的理想时机,从而提高每位交易者的成功率。 Entry Points Pro 可操作任何资产 它允许您在 MT5 平台上交易任何经纪商的加密货币、股票、贵金属、指数、大宗商品和货币。 提供任何方向的信号 Entry Points Pro 指标提供针对任意价格走势的入场交易信号 - 上涨、下跌或横盘(横向)。 最大盈利潜力 离场信号
Market Structure Order Block Dashboard MT5 是一款专为希望直接在图表上解读市场结构和主要价格反应区域的交易者设计的MT5指标。它结合了BOS、ChoCH、订单块(Order Blocks)、公允价值缺口(FVG)、流动性、Kill Zones、成交量分布图以及一个紧凑的面板,便于快速分析。 本指标面向使用市场结构、ICT和Smart Money概念作为决策框架的交易者。它可以帮助以更结构化的方式识别趋势延续、可能的反转、价格失衡、流动性目标和关注区域。 面向买家的资源 购买后可通过MQL5私信申请获取完整的PDF使用指南和参数配置建议。通过MQL5私信提供直接技术支持。 1.20版本带来两项重要新增: Pending BOS / Pending ChoCH 检测 和 可拖动面板 (按住面板标题栏即可将其拖动到图表任意位置,不影响图表本身)。当K线收于前一摆动点之外时,Pending Breaks 立即显示待确认的结构突破,无需等待经典的摆动确认。 重要 本产品仅为指标。它不会自动开仓、平仓或管理仓位。它不是EA(智能交易系统)。 主要功能 市场
Trend Forecaster
Alexey Minkov
5 (7)
Trend Forecaster – Since 2023. The Trend Forecaster indicator utilizes a unique proprietary algorithm to determine entry points for a breakout trading strategy. The indicator identifies price clusters, analyzes price movement near levels, and provides a signal when the price breaks through a level. The Trend Forecaster indicator is suitable for all financial assets, including currencies (Forex), metals, stocks, indices, and cryptocurrencies. You can also adjust the indicator to work on any time
RelicusRoad Pro MT5
Relicus LLC
4.96 (24)
RelicusRoad Pro: 量化市场操作系统 终身访问限时 70% 折扣 - 加入 2,000+ 交易员社区 为什么大多数交易者即使拥有“完美”指标也会失败? 因为他们在真空中交易 单一概念 。没有背景的信号是赌博。要持续获胜,您需要 共振 (CONFLUENCE) 。 RelicusRoad Pro 不是一个简单的箭头指标。它是一个完整的 量化市场生态系统 。它描绘价格运行的“公允价值之路”,区分市场噪音和真实的结构性突破。 停止猜测。开始用机构级“路”逻辑进行交易。 核心引擎:“Road” (路) 算法 系统的核心是 Road Algo ,一个实时适应市场条件的动态波动率通道。它投射出 安全线 (平衡) 和价格可能反转的 扩展水平 。 Simple Road: 典型市场的标准结构映射。 Smooth Road: 针对震荡盘整的降噪计算。 Breakout Road: 专为识别波动率扩张和爆发性走势而调整。 1. 算法动量与确认 我们的“剥头皮箭头”不只是简单的交叉。它们利用 高阶多项式逻辑 过滤噪音,确保信号与主周期一致。我们检测动量、价格行为和 Road 结构汇聚的精确入场
Btmm state engine pro
Garry James Goodchild
5 (4)
BTMM State Engine Pro is a MetaTrader 5 indicator for traders who use the Beat The Market Maker approach: Asian session context, kill zone timing, level progression, peak formation detection, and a multi-pair scanner from a single chart. It combines cycle state logic with a built-in scanner dashboard so you do not need the same tool on many charts at once. What it does Draws the Asian session range; session times can follow broker server offset or be set in inputs. Tracks level progression (L
Hydra Trend Rider is a non-repainting, multi-timeframe trend indicator that delivers precise buy/sell signals and real-time alerts for high-probability trade setups. With its color-coded trend line, customizable dashboard, and mobile notifications, it's perfect for traders seeking clarity, confidence, and consistency in trend trading. Setup & Guide:  Download  MT4 Version here. To learn how to use the Indicator: Indicator Manual & Guide -   Read Here Follow our MQL5 channel for daily market ins
Trend Lines PRO MT5
Roman Podpora
5 (1)
趋势线专业版 -     有助于了解市场真正转变的方向。该指标显示了真正的趋势反转点以及主要参与者重新入场的点位。 你看     BOS线路   无需复杂设置或不必要的干扰,即可在高时间框架内显示趋势变化和关键水平。信号不会重绘,并在K线收盘后仍保留在图表上。 MT4 版本   - 与 RFI LEVELS PRO 指示器结合使用时,可发挥其最大潜力 该指标显示的内容: 真正的转变   趋势线(BOS线) 一旦信号出现,它就始终有效!这与会重绘的指标有着重要的区别,后者可能会发出信号后又改变信号,从而导致资金损失。现在,您可以更精准、更准确地进入市场。此外,还有一个功能:在箭头出现后,K线会着色,直到达到目标价位(止盈)或出现反转信号为止。 重复条目   以及主要玩家的充值 为了提高寻找入场点时的视觉清晰度,我们创建了一个模块,该模块首先显示买入/卖出区域,并在该区域内寻找最佳入场点。此外,我们还加入了智能逻辑来管理止损位,该逻辑会随着时间的推移逐步降低止损位的大小,从而降低入场时的初始风险( 移动止损位 )。 信号强度水平     (BOS) 该指标采用三个显著性等级来衡量趋势变化
Weltrade Spike Sentinel
Batsirayi L Marango
5 (1)
Introducing Indicator for PainX and GainX Indices Traders on Weltrade Get ready to experience the power of trading with our indicator, specifically designed for Weltrade   broker's PainX and GainX Indices.  Advanced Strategies for Unbeatable Insights Our indicator employs sophisticated strategies to analyze market trends, pinpointing optimal entry and exit points.  Optimized for Maximum Performance To ensure optimal results, our indicator is carefully calibrated for 5-minute timeframe charts on
作者的更多信息
Integrated Dashboard Scanner
Krzysztof Janusz Stankiewic
5 (1)
集成仪表盘扫描器 – 您的市场指挥中心 (v2.0) 简短描述: 不要再浪费时间手动切换数十个图表了。 集成仪表盘扫描器 是一款功能强大的多品种、多时间周期扫描工具,让您能从单一面板监控您选择的所有交易品种。 经过重大的架构改革,2.0版本比以往任何时候都更快、更稳定、更强大。   您可以即时收到价格形态、背离和趋势信号的视觉警报,然后一键跳转到相关图表。 主要特点 节省时间:   一个面板覆盖整个市场——不再需要手动切换图表。 全面分析:   四个完全可配置的扫描模块, 现已包含MACD趋同分析。 即时反应:   一键即可将目标图表切换到正确的交易品种和时间周期。 完全自定义:   调整交易品种、指标参数、面板样式和警报通道。 坚如磐石的稳定性:   每个仪表盘实例现在都以唯一的ID运行,消除了在同一终端上使用多个扫描器时的冲突。 无阻塞UI与实时状态:   即使有大量交易品种,面板加载时也不会冻结您的终端。一个新的状态标签能让您随时了解其操作(同步、扫描、监控)。 智能化性能:   扫描器采用异步、逐一品种的数据初始化方式。如果某个品种的数据加载缓慢,不会阻塞其他品种。 经过大规模
MT5 Macd Divergence Scanner
Krzysztof Janusz Stankiewic
This indicator helps you monitor multiple currency pairs and timeframes all at once. It displays the occurrence of divergences between price and the MACD indicator in a clear and easy-to-read table. Monitoring multiple timeframes and currency pairs in one place helps traders identify a divergence without needing to switch between charts. Divergences can be bullish or bearish. For example, if the price forms a higher high while the MACD forms a lower high, this indicates bearish divergence. On th
MACD Divergence and TFR for MT5
Krzysztof Janusz Stankiewic
5 (1)
该指标通过分析连接价格和MACD直方图峰值或谷值的线的斜率来识别背离。 看涨背离(趋同):   当连接MACD谷值的线与连接相应价格谷值的线具有相反的斜率并趋同时发生。 看跌背离:   当连接MACD峰值的线与连接相应价格峰值的线具有相反的斜率并发散时发生。 当检测到背离信号时,指标会在对应信号的价格水平和时间上在图表中标注点。 额外功能: 该指标集成了 Darek Dargo的交易系统 中的信号,称为 TFR(The First Red) 。如果背离和TFR信号同时发生,指标会在图表中显示方向箭头,突显强化信号。 MACD直方图: 为了更清晰地显示,直方图采用不同颜色: 红色柱状 表示值高于前一根柱子。 绿色柱状 表示值低于前一根柱子。 当直方图在零线以下从红色变为绿色时,表明可能存在买入机会。相应地,当直方图在零线以上从绿色变为红色时,表明可能存在卖出机会。 背离和TFR信号作为过滤器,增强了这些信号的可靠性。 技术细节: MACD直方图计算为12周期和26周期指数移动平均线的差值。信号线未参与背离模式,以确保专注于直方图的动态。
Supply Demand FVG Zones
Krzysztof Janusz Stankiewic
5 (1)
Supply or demand zones refer to price areas where a significant amount of supply or demand had previously entered the market, causing prices to either fall or rise. If the price returns to the demand or supply zone, it is likely to bounce off due to the large number of orders previously placed within the zone. These orders will be defended in these areas. The Fair Value Gap (FVG) is a concept used to identify imbalances in the equilibrium of buying and selling. Fair Value Gaps are formed in a t
MACD Divergence and TFR for MT4
Krzysztof Janusz Stankiewic
5 (1)
The indicator identifies divergence by analyzing the slopes of lines connecting price and MACD histogram peaks or troughs. Bullish Divergence (Convergence): Occurs when the lines connecting MACD troughs and corresponding price troughs have opposite slopes and are converging. Bearish Divergence: Occurs when the lines connecting MACD peaks and corresponding price peaks have opposite slopes and are diverging. When a divergence signal is detected, the indicator marks the chart with dots at the pric
The First Red MT5
Krzysztof Janusz Stankiewic
基于达里乌什·达戈(Dariusz Dargo)创建的策略,“The First Red”指标旨在识别并标记图表上符合“The First Red”策略及其扩展条件的蜡烛图,例如“Second Red”、“First Green”和“Second Green”。该策略主要分析局部极值和MACD振荡器的信号。 第一根红色蜡烛(First Red Candle):   当蜡烛形成局部最高点且MACD直方图转向看跌时,将其标记为“First Red”。 图表符号:红色向下箭头位于蜡烛上方。 第二根红色蜡烛(Second Red Candle):   紧随“First Red”之后的第二根看跌蜡烛,确认趋势方向的改变。 图表符号:红色数字“2”位于蜡烛上方。 第一根绿色蜡烛(First Green Candle):   当蜡烛形成局部最低点且MACD直方图转向看涨时,将其标记为“First Green”。 图表符号:绿色向上箭头位于蜡烛下方。 第二根绿色蜡烛(Second Green Candle):   紧随“First Green”之后的第二根看涨蜡烛,确认趋势方向的改变。 图表符号:绿色
Purpose of the Inside Bar and Outside Bar Breakout Scanner Indicator: The Inside Bar & Outside Bar Breakout Scanner  is an advanced dashboard designed to scan multiple instruments and timeframes simultaneously. Its primary function is to identify two powerful candlestick patterns—the  Inside Bar (IB)  and the  Outside Bar (OB) —and then to detect and classify breakouts from these formations. The indicator presents its findings in a clean, organized table, signaling potential trend continuation o
Symbol
Krzysztof Janusz Stankiewic
For those who monitor charts from afar, this utility is essential. It displays the chart symbol, time frame, and bid price as text. Users can adjust the text position, color, and font size. It’s also a useful tool for forex video publishers. There will be no more complaints about which symbol and time frame are displayed on the screen, even if the content is viewed on a phone. Symbol prefixes such as “_ecn” or “_stp” can be removed from the displayed symbol.
FREE
Supply Demand FVG
Krzysztof Janusz Stankiewic
3 (2)
The indicator offers a comprehensive suite of features for identifying key market areas, including: Supply Zones Demand Zones Fair Value Gaps (FVG) and provides alerts whenever price reaches a supply or demand zone. Key Features: Historical Zones: In addition to active zones, the indicator now includes historical supply, demand, and FVG zones, allowing for a deeper analysis of past price behavior. Flexible Zone Timeframes: Zones can be plotted independently of the chart's timeframe, enabling sce
MT4 Macd Divergence Scanner
Krzysztof Janusz Stankiewic
该指标提供了一种高效的方法,可同时监控多个货币对和不同周期。通过在清晰易读的表格中直观展示价格与MACD之间的背离,它使交易者无需频繁切换图表即可发现潜在的市场转折点。 背离可能表示多头或空头动能的变化。例如,当价格创出新高但MACD未能相应创出更高的高点时,就出现看跌背离。相反,当价格创出更低的低点而MACD却形成更高的低点时,就出现看涨背离。 在指标的表格中,每个品种(如EURUSD、GBPUSD)垂直列于左侧,所选周期(如M5、H1、D1)水平排列在顶部。一个简单的点表示未检测到背离;当出现“UP”或“DN”(下)的标记时,就突显了一个潜在的交易信号。绿色的“UP”意味着可能的买入机会,而红色的“DN”意味着可能的卖出机会。发现信号后,指标还可根据您的设置,通过弹窗、邮件或推送通知进行提醒。与往常一样,建议结合更高周期分析、移动平均线及关键支撑和阻力位等方法来确认交易信号。 该工具提供两种扫描模式:一种只关注当前图表的品种,另一种扫描您自定义的品种列表。如果您需要同时扫描多个品种,只需在设置中用逗号(不加空格)分隔输入每个品种名称。在这种情况下,将表格放置在单独的图表窗口中,可能
The First Red MT4
Krzysztof Janusz Stankiewic
基于达里乌什·达戈(Dariusz Dargo)创建的策略,“The First Red”指标旨在识别并标记图表上符合“The First Red”策略及其扩展条件的蜡烛图,例如“Second Red”、“First Green”和“Second Green”。该策略主要分析局部极值和MACD振荡器的信号。 第一根红色蜡烛(First Red Candle):   当蜡烛形成局部最高点且MACD直方图转向看跌时,将其标记为“First Red”。 图表符号:红色向下箭头位于蜡烛上方。 第二根红色蜡烛(Second Red Candle):   紧随“First Red”之后的第二根看跌蜡烛,确认趋势方向的改变。 图表符号:红色数字“2”位于蜡烛上方。 第一根绿色蜡烛(First Green Candle):   当蜡烛形成局部最低点且MACD直方图转向看涨时,将其标记为“First Green”。 图表符号:绿色向上箭头位于蜡烛下方。 第二根绿色蜡烛(Second Green Candle):   紧随“First Green”之后的第二根看涨蜡烛,确认趋势方向的改变。 图表符号:绿色
筛选:
osobistyw
29
osobistyw 2025.07.09 09:50 
 

用户没有留下任何评级信息

Danushka Basnayaka
42
Danushka Basnayaka 2024.12.11 12:53 
 

The Supply Demand Ranger is an incredibly helpful indicator. It has significantly improved my trading accuracy by identifying key supply and demand zones effectively. The interface is user-friendly, and the signals are precise, making it an essential tool for any trader. Additionally, the developer's support is outstanding. They are responsive, professional, and always ready to assist with any questions or issues. It's rare to find such excellent customer support these days. Overall, I highly recommend this indicator to traders looking to enhance their analysis and decision-making

mrobat
19
mrobat 2024.12.03 18:58 
 

Bardzo polecam. W mojej strategii niezastąpiony. Działa świetnie na wszystkich interwałach czasowych.

Karolina Merchel
38
Karolina Merchel 2024.03.14 22:09 
 

wskaznik na poczatku nie dzialal jak ten na mt4, ale po jego przenastawieniu naprawde dziala i jeszcze lepiej jak ten na mt4. super praca. dzekuje panu Krzysztofowi za pomoc z nastawieniem wskaznika.

Krzysztof Janusz Stankiewic
1921
来自开发人员的回复 Krzysztof Janusz Stankiewic 2024.03.14 22:58
Ilość stfef można regulować za pomocą parametru Zone Strength.
The number of zones is regulated by the Zone Strength parameter.
best regards
inkja
122
inkja 2023.12.24 20:51 
 

Simple and does what it's supposed to do. Happy with it

回复评论