 MetaTrader 5
 专家
专家
 指标
指标
 程序库
程序库
 实用工具
实用工具
 窗口小部件
窗口小部件
 规则
规则
适用于MetaTrader 5的技术指标 - 150
 技术指标的信号外汇和股票市场的开仓交易和平仓交易起着至关重要的作用。指标的本质就是一种交易品种的数学转换,旨在预测未来的价格变化。
测试技术指标可以更有利于预测市场行为并从中获利。
技术指标的信号外汇和股票市场的开仓交易和平仓交易起着至关重要的作用。指标的本质就是一种交易品种的数学转换,旨在预测未来的价格变化。
测试技术指标可以更有利于预测市场行为并从中获利。 
Accelerator Signal Pro
Stop guessing where a move ends. Accelerator Signal Pro reads the ACCELERATION of price the way Bill Williams intended, then pinpoints the exact swing tops and bottoms for you with clean, non-repaint BUY and SELL arrows. No more staring at a histogram wondering "is this the turn?" - the indicator makes the decision and puts a triangle on the chart, right at the pivot.
Built for traders who want to ACT, not agonize.
======================================================

CustomRange VolumeProfile This indicator builds a Volume Profile for any part of the chart you want to study . Instead of resetting per day, you choose the range - either by dragging two vertical lines yourself, or by letting the indicator snap the range to a ZigZag swing leg automatically . It then draws the horizontal volume histogram together with the three key levels: the Point of Control (POC) , the Value Area High (VAH) and the Value Area Low (VAL) . Two Ways To Set The Range MANUAL - two

产品简介 6in1 Confluence System 是一款专为 MT4 和 MT5 双平台设计的多指标共振副图指标。它创新性地将 MACD、KDJ、RSI、LWR、BBI、MTM 这 6 种经典技术指标融合在一个副图窗口中,通过可视化的圆点矩阵实时展示多空力量对比。当 6 个指标同时指向同一方向时,系统会发出高概率的共振信号,帮助交易者在复杂行情中快速识别趋势共识,捕捉确定性极高的买卖时机。 核心功能 6 指标可视化矩阵 系统在副图窗口中绘制 6 行圆点矩阵,分别对应 MACD、KDJ、RSI、LWR、BBI、MTM 六个指标。每根 K 线对应的 6 个圆点会根据各指标的多空状态实时变色: 红色圆点代表该指标当前看多 , 绿色圆点代表该指标当前看空 。这种设计让交易者无需切换多个副图,即可一眼看清所有指标的多空共识,大幅提升决策效率。右侧会显示各指标的名称标签,方便对照识别。 做多信号 All Bull (全多共振) :当 6 个指标(MACD、KDJ、RSI、LWR、BBI、MTM)同时看多时触发,并在副图顶部显示红色向上箭头和 "All Bull" 文字。

产品简介 Triple Divergence Hunter 是一款专为 MT4 和 MT5 双平台设计的多指标背离检测副图指标。它深度整合了 MACD、KDJ、RSI 三大经典动能指标,通过严密的交叉与极值对比算法,精准捕捉价格与指标之间的顶底背离现象。同时,指标内置自定义 K88/D88 动能趋势系统,帮助交易者在趋势末端提前识别反转信号,在复杂行情中捕捉高胜率的左侧或右侧交易机会。 核心功能 K88/D88 动能趋势系统与超买超卖参考线 系统基于 34 周期极值计算构建自定义 KDJ 模型,生成 K88 主线与 D88 辅线。K88 线会根据多空状态自动变色: 多头状态显示为红色 , 空头状态显示为绿色 。副图固定 0-100 坐标系,并内置 80 和 20 两条水平参考线,用于界定超买与超卖区域。 MT5 版本额外支持 K88/D88 柱状图填充显示 ,让动能转换与多空力量对比更加直观立体。 做多信号 (底背离 Bottom Divergence) MACD Bot (MACD底背离) :当价格创出新低,但 MACD 的 DIF 线未创出新低,且在 DIF 上穿 D

概述 SMARiels 是 MetaTrader 5 图表指标,用于结构性价格分析。用户用两条竖线选择价格区间。在该区间内,指标计算水平价位、方向斜率、区域力度、区域触及、失衡,以及按带符号区域得分得到的最强 Strong BUY 与 Strong SELL 轨道。 这是分析工具。它不下单,也不能替代风险管理。Strong BUY 和 Strong SELL 轨道显示买压或卖压集中的位置。它们是参考位,不是交易订单。 图表对象 在所选区间内绘制的水平位: 实体最高与最低极值 SMA Up、SMA 和 SMA Down SMA Up Mid、SMA Mid 和 SMA Down Mid 最低与最高之间的 Gann 0.5 中点 当区域得分达到最低分时显示 Strong BUY 和 Strong SELL 轨道 竖线: Start line — 所选区间的起点 End line — 所选区间的终点 两条竖线均可拖动。计算只使用 Start 与 End 之间的 K 线。 使用方法 将指标挂到图表上。 把 Start line 放在要研究的价格结构起点。 把 End line 放在该结构终点。

Professional Multi-Timeframe HTF Ultimate Complete is an advanced, all-in-one institutional trading suite designed for MetaTrader 5. It projects up to 6 Higher Timeframes (HTF) directly onto your current chart, giving traders complete top-down market visibility without switching timeframes. HTF Candle Overlay , Fair Value Gaps (FVG) , Volume Imbalance (VI) , Liquidity Sweeps , 50% Midpoints , Multi-EMA Trend Streams , and a Live Bar Countdown Timer into a single, zero-lag tool.

一款双轴结构性价位指标,用于识别当前市场控制、区间记忆以及开放价格路径。 你从未意识到自己真正需要的交易优势。 Kito Level Reactor 是一款适用于 MetaTrader 5 的结构性价格水平指标。 它专为希望了解重要价位的交易者设计,不仅帮助判断关键价位在哪里,还帮助分析该价位目前正在如何影响价格。 该指标将市场控制划分为两种独立形式。 Active Control Spine 这是当前市场控制权最频繁发生转换的附近价位。 它主要用于提供以下市场背景: 当前方向偏向; 价格重新收复关键位; 向下跌破; 假突破; 首次回测。 Range-Memory Axis 这是一个具有重要历史意义的分界价位,过去曾多次区分主要的多头阶段和空头阶段。 它主要用于提供以下市场背景: 更大级别的反转; 区间转换; 假突破; 高时间周期目标。 当两个轴指向同一方向时,控制面板会显示 Dual Control 。 当两个轴的方向不一致时,指标会显示 Control Conflict ,提醒交易者降低方向判断的信心,并等待更清晰的市场结构。 主要功能 默认使用 H1、H4 和 D1 进行多时间

TS Parameter Advisor MT5 – 一鍵式自動追蹤停損參數計算器 B3 MT5
TS參數顧問MT5 這是一個輕量級的支撐指標,能夠分析任何交易品種的近期價格走勢,並自動計算可直接使用的追蹤停損參數。 它本身不會開倉、平倉或管理任何交易。 它的唯一作用是衡量當前市場的「波動」或「平靜」程度,並將該衡量結果轉化為具體的點值,以便直接輸入到 One Click B3 MT5 智慧交易系統的追蹤停損引擎中。
與其透過反覆試驗來猜測追蹤停損設置,或在每次波動性變化時手動重新調整它們,不如使用這款工具來監控市場,並保持數據隨時可用且最新。
重要提示-這不是一個獨立的指標
該工具本身不管理停損或止盈,也不獨立執行任何交易邏輯。 它專為與 One Click B3 MT5 智慧交易系統配合使用而設計。 如果沒有在同一交易品種上執行 One Click B3 MT5,此指標只會顯示按鈕,而不會控制停損/停盈功能。 若您沒有擁有或使用 One Click B3 MT5,本產品將不提供任何交易功能。
此指示器實際的作用
此指標會回顧您自行選擇的近期K線,並設定您自行選擇的

Support Resistance 是一款适用于 MetaTrader 5 的可视化指标,通过已确认的 ZigZag 枢轴识别潜在的支撑位和阻力位。 该指标旨在帮助交易者从多个时间周期研究市场结构。它不会生成自动买卖信号,也不会执行交易。 主要功能
根据 ZigZag 的高点和低点识别支撑位和阻力位。 使用两个相关的时间周期来源,以提供更广泛的市场背景。 在 MN1 至 H1 周期中,结合图表当前周期及其直接上级参考周期。 在 M30 及更低周期中,使用 M30 和 H1 作为参考组合,以减少短期市场噪音。 使用基于 ATR 的距离合并相近的枢轴水平。 根据市场波动性调整水平之间的接近程度。 保留原始枢轴,并限制水平的过度移动。 跟踪与 ZigZag 枢轴的结构性接触。 根据累积的结构性接触次数改变线条颜色和粗细。 识别支撑位与阻力位之间已确认的角色转换。 显示每个主要水平的价格和最后活动时间。 对来自直接上级时间周期的水平,在标签中显示来源时间周期。 将短期 ZigZag 水平绘制为红色点线。 当主要水平的突破在K线收盘后得到确认时生成提醒。 可独立启用平台弹窗、电子邮件、移动推

DESCRIPTION ATR MultiTF Sniper — Non-Repainting Multi-Timeframe Confluence Signals ATR MultiTF Sniper is a buy/sell signal indicator built on trend confluence across three timeframes (M15, H1 and H4 by default), combined with an ADX trend-strength filter to avoid signals during sideways markets. Every signal is calculated strictly on closed candles, so once an arrow appears, it never moves or disappears. How it works • EMA crossover on the base timeframe (default EMA 9/21) detects a potenti

ProbAlgo is an institutional‑grade trading indicator engineered to mirror the analytical discipline used inside major banks and hedge funds. Its core strength is not just detecting when to trade — but knowing when not to trade. By combining probabilistic modeling, volatility diagnostics, liquidity behavior, and structural market filters, ProbAlgo isolates the rare moments when conditions genuinely support a high‑quality entry. Instead of chasing every move, ProbAlgo evaluates the market through

SWIFT ALGOMATIC PRO - MT5 Indicator
The 80% Edge on BTCUSD M15
SWIFT ALGOMATIC PRO isn't just another moving average crossover system - it's a precision-engineered algorithmic weapon forged in the fires of real market warfare. While the masses chase lagging indicators and repainting gimmicks, this powerhouse delivers something far more valuable: certified non-repainting signals with documented 80% profitability on BTCUSD 15-minute charts.
What Makes This Beast Different?
Institutional-Grade

Priced at $39.
Test it risk-free first: the Free Demo runs the full indicator on historical data in Strategy Tester before you spend a cent.
Built by the same author behind Order Block & FVG Confluence (5-star reviewed).
Get multi-timeframe supply/demand zones with a built-in EMA/RSI entry trigger and ATR-based risk management — a complete entry plan, not just zones drawn on a chart.
Supply and Demand Zones (MTF) is a price-action indicator for MetaTrader 5 that identifies real institutional

产品简介 Multi Dimensional Bottom Finder 是一款专为 MT4 和 MT5 双平台设计的高阶副图震荡与多维共振指标。它打破了传统单一 KDJ 或 RSI 指标的局限,通过融合多周期随机震荡算法、CCI 极值分析、成交量异动检测与乖离率修复模型,构建了一套极具深度的底部猎手系统。该指标能够敏锐捕捉市场在极度超卖区域的动能反转,并通过多维度共振过滤出极高胜率的战略级抄底信号,是波段交易者和左侧交易者不可或缺的副图利器。 核心功能 多维震荡柱状图与趋势平滑线系统 系统在副图绘制了丰富的视觉元素以反映市场微观结构: KHLD7 多色柱状图 通过品红、红、蓝、青四种颜色及 50 中轴的分段,直观展现动能的强弱与多空状态的切换; KHLD13 低位柱 (红/绿)专门用于放大和捕捉底部区域的微弱反转动能; KHLD22 青线 与 KHLD23 棕线 作为中短期趋势的平滑跟踪线,辅助判断震荡区间的突破方向。副图内置 0、50、100 三条水平参考线以界定超买、中轴与超卖区域。 MT5 版本额外支持更精细的柱状图分段着色、超买超卖点线以及 80 虚线参考

LQ Kill Zones Simple. Clean. Reliable.
Trade the most active market sessions with clarity. LQ Kill Zones is a lightweight MetaTrader 5 indicator that automatically highlights the most important trading sessions directly on your chart. Whether you trade Smart Money Concepts, ICT, Price Action, or your own strategy, knowing when the market is most active can help you better understand price behavior. Features Automatic Kill Zone visualization Clean and lightweight design Easy-to-read sessio

Palier Engine Pro – Institutional Levels Professional MT5 Indicator
Trade Institutional Price Levels
Palier Engine Pro is a professional MetaTrader 5 indicator designed to automatically display institutional price levels used by professional traders to identify high-probability support and resistance areas.
The indicator generates a c

Quick MACD – Professional MACD Indicator Professional MT5 Indicator
Trade Momentum With Confidence
Quick MACD is a professional MetaTrader 5 indicator designed to deliver fast, accurate and easy-to-read MACD signals for trend identification, momentum analysis and market reversals.
Built for traders who demand speed and clarity, Q

Impact VOSS – Volume Order Smart Signals Professional MT5 Indicator
Trade With Institutional Order Flow
Impact VOSS is a professional MetaTrader 5 indicator designed to analyze Volume, Order Flow and Smart Signals in real time, helping traders identify institutional activity and high-probability trading opportunities.
By combining adv

MQL5 博客 = https://www.mql5.com/en/blogs/post/773190
MT4 版本 = https://www.mql5.com/en/market/product/187704
MT5 版本 = https://www.mql5.com/en/market/product/187705
背离筛选器 [tambangEA] 是一款多品种、多时间周期的分析仪表盘,旨在识别多个市场中的常规背离和隐藏背离,无需交易者手动打开和检查每个图表。
该指标将品种排列成行,时间周期排列成列。每个仪表盘单元格显示最新的背离分类、操作偏差、当前状态和信号时长。
点击任意仪表盘单元格即可将活动图表直接切换到相应的品种和时间周期,然后在价格图表和震荡指标窗口中查看完整的背离结构。
四种背离类型
看涨常规背离
价格形成更低的低点,而震荡指标形成更高的低点。
仪表盘解读:
买入反转
这种情况可能表明空头动能减弱,并可能出现上涨反转。
看跌常规背离
价格形成更高的高点,而震荡指标形成更低的高点。
仪表盘解读:
卖出反转
这种情况可能表明多头动能减弱

Candle Time Remaining Pro is an essential utility for traders who need precise time awareness for candle closes. It displays a real-time countdown timer directly on your charts, ensuring you never miss a candle close or entry signal again.
Designed with performance and clarity in mind, Candle Timer Pro is lightweight, highly configurable, and smoothly updates every second—even during low market volatility.
Key Features: - Smooth Second-by-Second Countdown: Powered by an internal timer for con

ApexForge MA Radar Advanced 是專為追求更高效率與更完整市場資訊的交易者所打造的進階版本。在免費版的核心功能基礎上,新增多項專業分析工具,讓您能更快速掌握均線變化、趨勢強度與市場結構,大幅提升交易判斷效率。 Advanced 版本支援多種移動平均線類型(SMA、EMA、SMMA、LWMA),可自動偵測並依價格位置排序,搭配方向箭頭、標準化斜率強度分析、均線價格顯示、面板顯示控制、自訂色彩設定,以及方向變化與排列變化通知,讓您不需反覆檢查每一條均線,即可快速掌握市場現況。 本產品採用低 CPU 使用率設計,即使同時開啟多張圖表,也能維持流暢運作,非常適合需要長時間監控市場的交易者。所有資訊皆集中於簡潔面板中,降低圖表雜訊,同時保留完整的趨勢判讀能力。 如果您希望在免費版的基礎上,獲得更完整的均線分析、更靈活的自訂功能,以及即時提醒機制, ApexForge MA Radar Advanced 將是兼顧功能與價格的最佳選擇,適合專業交易者、波段交易者,以及希望提升交易效率的使用者。

ApexForge MA Trend Strength Professional 是 ApexForge 系列中功能最完整、最強大的旗艦版本,專為追求專業分析與高效率交易的使用者打造。除了完整的 MA 趨勢強度分析外,Professional 版本提供更多進階功能、更多自訂選項,以及更高的分析自由度,滿足從剝頭皮、日內交易到波段交易等不同操作需求。 指標可自動分析圖表中的移動平均線斜率,並以 Strong Down、Down、Flat、Up、Strong Up 五段式趨勢強度清楚呈現市場狀態,協助交易者快速判斷趨勢是否正在增強、減弱或進入盤整。透過直覺化的介面設計,即使同時監控多個商品與多個時間週期,也能迅速掌握整體市場方向。 Professional 版本支援完整的介面客製化,包括更新頻率、面板位置、顏色配置、文字大小及更多專業設定,並採用極致輕量化架構,不依賴 Tick 更新、不重繪歷史資訊,長時間運行依然保持流暢,適合需要同時開啟多張圖表的專業交易環境。 本指標並非提供買賣訊號,而是提供客觀且一致的趨勢評估,協助交易者建立更有紀律的交易流程。無論搭配價格行為、均線策略、支撐壓力或

EntropyM is an advanced market‑intelligence indicator engineered to detect and quantify randomness directly on the chart. Built on modern entropy theory and probabilistic modeling, EntropyM reveals whether the market is producing true signal or pure noise — a distinction that most retail tools fail to capture. At its core, EntropyM measures the entropy level of price action: High entropy → chaotic, random, unpredictable market conditions Low entropy → structured, readable, probability‑aligned en

How many times have you opened a trade with a rough mental estimate of your risk, only to be surprised by the real number once your Stop Loss gets hit? SL/TP Values removes that guesswork: it displays real-time, on-chart labels showing the actual monetary value of your Stop Loss and Take Profit — before you commit to the trade. What it does for you: Automatically converts the pip/point distance of your SL and TP into real money, based on your lot size and the instrument you're trading. Updates t

ADAPTIVE TREND DASHBOARD PRO
See the trend. Trade the bias. Skip the noise. ========================================================================
Most indicators bury you in arrows and repainting signals. Adaptive Trend Dashboard Pro does the opposite: it gives you ONE clean adaptive trend line and ONE professional dashboard that tells you, at a glance, what the market is really doing - so YOU make the decision with confidence.
Built on Perry Kaufman's Adaptive Moving Average (AMA), the tr

XauSLS 是一款专为黄金(XAUUSD)打造的 MetaTrader 5 分析工具。它将黄金交易者通常需要用多个独立指标才能实现的五项功能整合在一起:
- 交易时段 — 悉尼、东京、伦敦、纽约,以及可选的法兰克福时段,以清晰、不重叠的彩色时间轴形式显示在价格下方。时段时间直接以经纪商时间(时:分)设置,因此显示始终与图表本身保持一致。
- 流动性水平 — 前一日高/低点、当日高/低点,以及前一周高/低点,均基于经纪商自身的日/周K线构建。
- 流动性扫荡(Sweep)检测 — 当价格以可设定的最小幅度(以点数或相对ATR计)突破其中一个水平,并在可设定的K线数内收盘回到区间内时予以标记。未确认和已确认的扫荡分别以视觉上不同的图表箭头显示。
- 市场结构 — 具有可调回溯周期的分形高低点摆动检测,结构突破(BOS)与市场情绪转变(CHoCH)分类,以及可选的相对ATR幅度过滤器以忽略次要摆动。结构还会在另外三个可自由选择的更高周期上独立追踪。
- 组合事件 — 当已确认的流动性扫荡后,在同一周期上出现相匹配的结构突破时,指标会将其标记为"Setup Candidate"(

产品简介 Low Buy High Sell Radar 是一款专为 MT4 和 MT5 双平台设计的全能型主图趋势跟踪与波段交易指标。它通过构建动态趋势线变色系统,结合多周期震荡算法(TSI 与 RSI)、量价动能模型与信号冷却过滤机制,为交易者提供从趋势确认、超买超卖识别到精准入场离场的全方位交易信号。该指标逻辑严密、视觉清晰,并配备完善的信号冷却与多通道提醒机制,是构建主图交易系统的理想选择。 核心功能 动态趋势线与均线系统 系统在主图绘制两条核心趋势识别元素: MA60 品红线 作为 60 周期简单移动平均线,提供中长期趋势基准参考; 动态趋势线 以白色中轴线为基础,当短期动能持续上升时自动转为 红色粗线 ,当短期与中期动能同步走弱时转为 绿色粗线 ,直观反映多空主导权的切换。交易者仅需观察趋势线颜色即可快速判断当前市场的主导方向。系统在最新 K 线右侧显示白色 实时收盘价标签 。 MT5 版本额外支持 K 线变色染色功能 ,上涨染蓝色、下跌染红色、持平染灰色、趋势转多染黄色,让趋势状态与反转形态通过 K 线颜色直观呈现。 做多信号 Low Buy (低吸):当短期震

Stochastic Divergence Matrix 28 scans all 28 major Forex pairs across up to 21 MetaTrader 5 timeframes. It converts confirmed stochastic divergences into weighted pair scores, individual currency scores and an inclusive delta for every major currency pair. Stochastic Divergence Matrix 28 is a multi-currency and multi-timeframe analytical indicator for MetaTrader 5. The indicator scans the complete matrix of 28 Forex pairs formed by the eight major currencies: USD, EUR, GBP, JPY, AUD, CAD, CHF an

NETZER SIGNALS – HalfTrend Visual O NETZER SIGNALS é um indicador visual de acompanhamento de tendência desenvolvido para o MetaTrader 5. Baseado na lógica HalfTrend, ele identifica possíveis mudanças na direção do mercado e apresenta os sinais diretamente no gráfico por meio de linhas coloridas, canais dinâmicos e setas de compra e venda. O indicador foi projetado para oferecer uma leitura simples e objetiva do mercado, ajudando o trader a visualizar tendências, reversões e possíveis pontos de

Hull Suite Strip is a MetaTrader 5 trend-following indicator converted from the popular TradingView Hull Suite. It supports HMA, EHMA and THMA calculations and displays a smooth, colour-changing ribbon directly behind the candles. The ribbon changes colour according to trend direction and includes solid or layered-gradient filling, configurable boundaries, higher-timeframe analysis and trend-change alerts.

TrendCluster Matrix is an adaptive trend-following indicator designed to help traders identify market direction, trailing stop levels, and potential trend transition areas directly on the chart. Unlike a standard SuperTrend with one fixed multiplier, this indicator analyzes multiple SuperTrend factor values at the same time. It then groups their recent performance into different clusters and selects a final adaptive factor based on the user’s chosen mode: Best, Average, or Worst cluster. This al

Fractal Market Structure CHoCH BOS MT5 Fractal Market Structure CHoCH BOS MT5 is a price-action indicator designed to identify market structure through confirmed fractal formations. Instead of relying only on traditional swing-point calculations, the indicator analyzes structured candle patterns to locate important highs and lows, detect changes in directional behavior, and display relevant market structure events directly on the chart. The indicator can identify bullish and bearish Break of Str

Market Structure Leviathan Market Structure Leviathan is a price-action indicator designed to present important structural movements directly on the trading chart. It automatically detects confirmed swing highs and swing lows, classifies market structure, identifies structural breakouts, and displays optional 50% retracement levels between significant price points. The indicator helps traders understand whether the market is forming higher highs, higher lows, lower highs, or lower lows. This in

DESCRIPTION Supertrend Volume Confirm — Trend Signals Confirmed by Volume and RSI Supertrend Volume Confirm is a buy/sell signal indicator based on the classic Supertrend, with two additional confirmation filters: volume and RSI. Unlike more complex multi-timeframe systems, this indicator works on a single timeframe, designed for traders who want something direct and easy to read. It works on any market symbol (forex, gold, indices, stocks, crypto) thanks to its default use of tick volume, unive

Boss E Indicator
Short description
Visual market-structure indicator for MetaTrader 5 combining accumulation ranges, liquidity sweeps, CISD confirmation, fair value gaps, retracement entries and a compact dashboard.
Full description
Boss E Indicator is a visual market-structure tool for MetaTrader 5. It converts a discretionary sequence often described as accumulation, manipulation and distribution into configurable, objective rules that can be applied consistently across charts.
The indica

MTF Inside / Outside Bar Detector The market tells you before it moves. Are you watching? There are moments on the chart when price compresses, breathes, builds energy — and then explodes in one direction. Those moments have a name: Inside Bar and Outside Bar . Traders who spot them in time get in earlier, with less risk and more clarity. The problem is that when you're trading on the 1-minute chart, those patterns are almost invisible. They form on higher timeframes, and by the time you notice

Quantora Precision Signals Pro is a MetaTrader 5 indicator that identifies BUY and SELL signals based on completed candle conditions and internal calculation logic. Signals are generated only after candle close. When a valid signal is detected, the indicator displays the corresponding entry reference and dynamically calculated price levels based on the Average True Range (ATR). The indicator is designed to provide structured signal information for chart analysis. It does not open, modify or clos

Definition and theoretical foundation SuperTrend Ribbon is a volatility-adjusted trend-following indicator designed to identify the prevailing market direction, highlight possible regime reversals and provide a dynamic reference for structural risk management. The underlying SuperTrend method combines price with the Average True Range , or ATR. ATR measures volatility rather than direction by considering the current high–low range and any gap relative to the previous close. The SuperTrend then p

The Relative Strength VoLume ( aka PVL ) is a useful indicator for analyzing the pressure that changes in volume exert on price over a given period. This indicator can be used to identify pullbacks, verify breakouts, or confirm the continuation of a trend.
Entry strategies that can be used with the help of this indicator include trading on overbought or oversold conditions or entering a trend during pullbacks. Additionally, these conditions can be used as exit strategies when o

Definition and theoretical foundation Donchain Trend Ribbon is a market-structure and breakout-regime indicator based on the Donchian channel methodology. “Donchain Trend Ribbon” is the product name, while the underlying technical method is the Donchian channel . A traditional Donchian channel is formed from the highest high and lowest low over a selected lookback period: Upper Donchian Boundary = Highest high recorded over the previous N candles. Lower Donchian Boundary = Lowest low recorded ov

FZ-100 Flow Matrix — Structural Supply & Demand Intelligence Most supply and demand indicators stop at drawing rectangles. FZ-100 Flow Matrix goes further by transforming market structure into a complete decision framework. It identifies the origin of institutional-style displacement, confirms the resulting zone, evaluates its quality, monitors the retest, validates the reaction, and generates a structured risk map—all directly on your MetaTrader 5 chart. FZ-100 is designed for traders who want

THREE LAYERS OF SMC MARKUP IN ONE TOOL Liquidity pools, order blocks and a volume profile — the Smart Money markup that traders usually assemble from three separate indicators. SMC Liquidity OB Profile draws all of it in one tool, with a single block of input parameters and one visual language. Why not just stack three free SMC overlays? Because three overlays means three settings lists, three visual styles and triple the load on your chart. Here everything is computed in a single lightweight

Центр SmartTrading — Внутридневные уровни и диапазоны торговых сессий Описание / Основной опис : SmartTrading Hub — это легкий, высокооптимизированный инструмент для построения внутридневных графиков, разработанный для трейдеров, использующих ICT, концепцию «умных денег» (SMC) и анализ ценового действия. Он автоматически отображает ключевые дневные уровни открытия, равновесные диапазоны недельного/дневного диапазона и диапазоны открытия сессий непосредственно на графике MetaTrader 5. Автоматизи

说明: Evil Doji(Злой Додж)是一款技术分析指标,用于在图表上可视化假突破(Fakey)形态。它根据最近 N 根K线动态构建支撑位和阻力位,跟踪价格突破关键位后回归区间的走势,并在确认K线 收盘后 绘制信号箭头——箭头位置在后续跳动或历史重算时不会改变。该指标不会自动开仓或平仓,只标示形态形成的位置;是否入场及如何执行,由交易者本人或独立的交易机器人决定。 与 FBH 生态系统的关系 Evil Doji(Злой Додж)是 FBH 生态系统的一部分,该生态系统汇集了基于 False Breakout Hunter 策略的多款产品。除本指标外,生态系统中还包括用于自动化交易的智能交易系统 False Breakout Hunter(FBH Expert)。 Evil Doji 的工作原理 通过三种模式之一计算关键位:极值(最高价/最低价)、K线实体(开盘价/收盘价)或典型价格(Typical Price)。 跟踪价格突破关键位后回归区间的走势。 根据K线实体大小与波动区间的比例过滤信号,剔除部分冲量K线。 在确认K线收盘后绘制信号箭头。 启用声音提醒后,播放 MQL

VP Sweep Signals PRO builds on the free VP Sweep Signals with three genuine upgrades: delta volume confirmation (fewer, higher-quality signals), a weekly Volume Profile alongside the daily one, and everything else you already know from the free version — Volume Profile POC/VAH/VAL, sweep-and-reclaim detection, and kill-zone filtering.
What's new in PRO: - Delta-confirmed signals — every sweep/reclaim signal is checked against the day's cumulative delta volume (an approximation of buy vs. sell

Risk Lot Size Panel 是 MetaTrader 5 图表面板,根据风险与止损距离给出建议手数。它不下单、不修改持仓、不生成入场信号。你查看建议手数后,用自己的方式或其他工具下单。 功能 - 风险为资金百分比或固定金额(账户货币) - 资金基数:余额、净值或自定义金额 - 止损为点数或绝对价格 - 多/空 → 以 Ask/Bid 为入场,止损在下方/上方 - 通过 OrderCalcProfit 计算手数(必要时回退到点值算法) - 手数按品种最小/步长/最大规范化 - 大号 COPY LOT 行便于读取(仅显示) - 定时器与新 K 线实时刷新 - 深色石板或浅色主题;角落、尺寸、字体可调 适用对象 - 下单前需要清晰风险→手数读数的手动交易者 - 与免费图表工具(如 Session Box Hours、Trend Arrow NR)搭配的付费辅助 - 想在图表上定仓、又不需要完整交易管理器的人 要求 - MetaTrader 5 - 挂到你要计算手数的品种图表(或在输入中覆盖品种) - 不需要 Algo Trading(不下单) 使用方法 1. 将 RiskLotC

Ninja Dual EMA Cross PRO Crossover Detection with Trend Filter, ADX Strength Confirmation & Zero Repaint Imagine this: you no longer need to glue your eyes to the screen waiting for the perfect EMA crossover. You don’t have to wonder whether that crossover has enough power or if it’s going with the dominant market flow. Now there’s a single tool that does it all for you, with surgical precision, without ever failing you. Ninja Dual EMA Cross PRO is that tool. You build your two‑moving‑averag

Equity Atlas — 看懂您的交易历史
Equity Atlas 是一款用于 MetaTrader 5 的只读型账户绩效分析指标。它把已平仓交易历史整理为清晰的统计面板,提供累计曲线、灵活过滤条件、浮动盈亏记录和详细的周期统计。
它适用于主观交易者、自动化系统用户、投资组合管理者,以及所有希望了解账户结果来源的用户。Equity Atlas 不会开仓、平仓或修改任何订单。
核心分析
• 在同一个自适应面板中查看综合、日、周、月、季度和年度结果。 • 周期页面将累计曲线、明细表和固定的 Total 汇总行组合显示。 • 默认按账户货币金额统计,也可以切换为按盈利点数统计。 • 点数可按平仓成交、手数加权或持仓归一化三种方式汇总。
过滤与分类分析
• 可分析全部历史,也可按开始和结束日期、品种范围、自定义品种列表、一个或多个 Magic、订单注释以及 BUY/SELL 方向过滤。 • 所有已启用的过滤条件都会显示在面板顶部,当前分析范围始终清晰可见。 • Symbol、Magic 和 Comment 独立页面会对品种和策略进行排序,并显示汇总值与比例条形图。 •

Order Block & FVG Confluence PRO builds on the base OBF indicator with one genuine upgrade: delta volume confirmation. Every BOS/Order Block/FVG signal is checked against the day's real cumulative order flow before it fires — fewer, higher-conviction signals, not more noise.
What's new in PRO: - Delta-confirmed signals — a BUY only fires when the day's cumulative delta volume (an approximation of buy vs. sell pressure derived from where each candle closes within its range) is net positive; a S

MarketLevelsEdge is a market-structure overlay for MetaTrader 5 that plots the key levels institutional and retail order flow actually react to — previous day/week high and low, session VWAP, and daily open — and fuses them into a single, easy-to-read confluence score. It does not generate trade signals on its own: it is built to sit alongside your own strategy, sharpening your read of market bias and flagging the price zones where reversals or breakouts are statistically more likely to happen.

Launch price: 30 USD - price will increase after the first purchases, so early buyers lock in this rate.
Reversal Magnet Lines plots the closing price of each of the last N trading days (configurable from 15 to 180 days) as horizontal lines directly on the chart. These prior-day close levels frequently act as short-term support and resistance, where price either reverses or breaks through with momentum.
Based on an analysis of 52 trading days on JPN225, price interacted with these levels in mo

Launch price: 30 USD - price will increase after the first purchases, so early buyers lock in this rate.
Smart Volume Zone marks the trading candle with the highest tick volume within the last N trading days (configurable, default 10) and highlights it directly in the terminal's native Volumes panel, with no separate window and no third-party dependency.
How it works: the indicator scans every M1 candle within each of the last N days, finds the single highest-volume candle per day, then compar

Launch price: 30 USD - price will increase after the first purchases, so early buyers lock in this rate.
Multi Anchor VWAP lets you place a Volume Weighted Average Price line starting from any candle you choose, instead of only resetting automatically at the start of a session, day, week or month.
How it works: press the H or L button, then click the candle you want to anchor to, or use the Up and Down arrow keys to move to it and confirm with Enter. The VWAP line starts exactly at that candle

Triple Period VWAP plots three Volume Weighted Average Price lines at once: daily, weekly and monthly. Each line resets automatically at the start of its own period instead of rolling continuously, so you always see where the average price stands for the current day, the current week and the current month side by side.
Colors follow a familiar convention: magenta for the daily line, blue for the weekly line, and dark green for the monthly line. Line width and colors are configurable.
Features:

MultiTF OrderBlocks Pro is a powerful, unrepainting Smart Money Concepts (SMC) indicator designed for precision day traders and scalpers. It automatically identifies and draws institutional Order Blocks from multiple higher timeframes directly onto your current chart, allowing you to easily spot high-probability reversal zones and areas of deep liquidity without constantly switching timeframes. Built strictly on price-action logic, the indicator detects valid Order Blocks that are confirmed by

TRADER EDUCATION PRO v4.0 - MT5 İşlem Girişi ve Piyasa Okuma Göstergesi TRADER EDUCATION PRO v4.0, MetaTrader 5 kullanıcılarının piyasa koşullarını daha sistematik bir şekilde değerlendirmelerine ve uygun işlem giriş koşullarını belirlemeyi öğrenmelerine yardımcı olmak için geliştirilmiş, çoklu zaman dilimli bir eğitim göstergesidir. Sadece AL veya SAT mesajları göstermek yerine, gösterge trendi, piyasa yapısını, önemli fiyat bölgelerini, momentumu, mum formasyonunun onayını ve risk-ödül oranın

Pair Log Ratio Divergence is a professional indicator designed for Pairs Trading . It measures the divergence between two financial instruments using the logarithmic price ratio instead of simple price differences. The logarithmic approach allows accurate comparison of instruments with different price scales while providing a stable equilibrium model. The indicator calculates: logarithmic price ratio dynamic equilibrium line current deviation from equilibrium This makes it possible to identify s

Trading Sessions FX with Automatic DST Trading Sessions FX with Automatic DST automatically draws the four major Forex trading sessions directly on your chart using clean border-only boxes that accurately surround each session's price action. The indicator automatically handles Daylight Saving Time (DST) for Sydney, London, and New York, while also detecting your broker's GMT offset. No manual calculations are required—session boxes always appear exactly where they should. Key Features Four Ma

O Preço Médio Master MT5 exibe o preço médio de equilíbrio em tempo real das posições abertas, particularmente com o volume total de COMPRA, VENDA e LÍQUIDO. O indicador é atualizado automaticamente à medida que as posições são adicionadas, diminutas ou fechadas e desejam o nível de equilíbrio diretamente no gráfico.
Average Price Master MT5 é um indicador para MetaTrader 5 que calcula e exibe em tempo real o preço médio de equilíbrio (Average Price / Zero a Zero) das posições abertas no

Вот перевод текста на китайский язык (упрощенное иероглифическое письмо), оформленный в строгом, понятном и профессиональном стиле, подходящем для MQL5 Market: 机构级 SMC 与共振引擎 (MTF 扫描仪) 机构级 SMC 与共振引擎是一款专为 MetaTrader 5 开发的专业 Smart Money Concepts 指标。它专为高频动态结构映射而设计,能够自动识别、评分和筛选机构供求区域 (Supply and Demand),同时通过交互式扫描面板实时监控多个资产和时间框架。 核心功能特性 自动化供求区域检测 机构枢轴半径引擎:精准定位关键市场转折点,无需任何滞后指标。 高精度区域映射:自动计算实体与影线的比例,精准绘制需求区(取开盘价与收盘价的最大值至最低价)和供应区(取最高价至开盘价与收盘价的最小值)。 实时缓解 (Mitigation) 清理:动态监控有效区域。一旦某个区域失效或被价格突破,系统会立即从图表中清

KS Candle Box Bull Bear Pro 是一款专为 MetaTrader 5 (MQL5) 平台开发的图表窗口指标,它将“高时间周期区间框”与“前几根K线的高低价位线”结合在了一起。
主要功能
**周期区间框(核心功能)**
针对选定的高时间周期(参数 `InpPeriod`,默认为 H4;同时也支持 D1、W1、MN1)绘制半透明矩形框。
区间框覆盖了每个周期内从最高价到最低价的范围。
颜色由K线走势决定:
看涨(收盘价 ≥ 开盘价)→ 浅绿色填充 (C'240, 255, 240')
看跌 → 浅粉/红色填充 (C'255, 228, 225')
支持自定义回溯周期数(默认 10 个周期)、透明度以及是否显示边框。
当前(正在形成)的区间框会延伸至实时价格/时间位置。
**前两根K线的高低价位线**
针对选定周期,绘制前一根(Prev-1)和前两根(Prev-2)K线的最高价与最低价水平线。
颜色:Prev-1 为道奇蓝 (DodgerBlue),Prev-2 为橙色 (Orange)(均可自定义)。
支持向右延伸射线以及显示价格标签。

Macro Flow Levels é uma ferramenta de análise institucional avançada projetada para traders que buscam acompanhar a movimentação dos grandes players nos mercados intraday.
O indicador combina análise de variação percentual macro, VWAP diária, análise de volume (VSA), fluxo monetário (MFI) e destaque de candles de abertura de mercado em um único painel limpo e intuitivo.
Principais Recursos:
1. Níveis Percentuais Customizáveis (%): - Mapeamento automático de níveis de desvio percentual (+0.5%

Quant Analytics Short description (for the product summary field) Quant Analytics turns your raw trade history into a full quantitative performance report — right inside MetaTrader 5. A dark, on-chart P/L calendar for daily use, plus a one-click HTML export with the same depth of analysis you'd expect from a dedicated trading journal: drawdown, Monte Carlo, Kelly, Omega, MAE/MFE, rolling Sharpe, and more. Full description See your trading the way a quant would — without leaving MetaTrader 5. Mo

Gold Confluence XAUUSD 本指标 仅适用于 XAUUSD(现货黄金) ,因为所有参数设置和算法计算均针对该交易品种的特性及其高波动性进行了专门优化。 核心计算模块 RSI(相对强弱指数) MACD(指数平滑异同移动平均线) Momentum(动量指标) 信号确认过滤器 趋势过滤器(Trend Filter)
信号会根据价格相对于移动平均线(MA)的位置进行确认。 DXY 过滤器(美元指数)
在指标直方图中以 黄色曲线 显示。 成交量过滤器(Volume Filter)
当当前成交量明显低于平均成交量时,信号将被视为 未确认 。 交易时段过滤器(Trading Session Filter)
支持伦敦交易时段和纽约交易时段,并可自定义交易时间。同时还包括 伦敦与纽约交易时段重叠 的时间区间。 1. 右侧信息显示 成交量指标。 DXY(美元指数)过滤器,数值范围为 -100 至 +100 。 1.1 成交量强度 同时显示 买方成交量 或 卖方成交量 的百分比,并配合**成交量强度标识(Volume Strength Identifier)**进行显示。 1
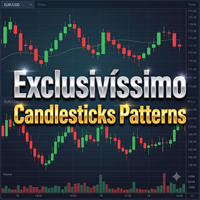
Exclusivissimo Candlesticks Patterns is an institutional-grade Price Action indicator designed for MetaTrader 5. Built upon the strict, classic literature of Steve Nison, this tool does not merely look for visual shapes; it mathematically filters market context to provide only high-probability reversal and continuation signals. Forget cluttered charts and false signals. This indicator features a Strict Hierarchical Engine that prioritizes macro patterns over micro patterns, ensuring your chart r

本指标以历史曲线的形式绘制八种主要货币的相对强弱,数据由 28 个主要货币对分解而来。面板告诉您当前的状况,本指标则展示市场如何走到今天:哪种货币一直在走强,哪种已经掉头,以及排名在何处易主。 全部八条序列均以有完整文档的指标缓冲区形式开放,EA 可以直接读取货币强弱数值。 分解原理 八种货币中的每一种都出现在二十八个货币对中的七个里。它的强度就是这七个读数的平均值,并在其作为报价货币时反转符号——AUDJPY 下跌意味着日元走强,而非走弱。 每个货币对恰好影响两种货币,对基础货币为正、对报价货币为负,因此在全部二十八个货币对上这些贡献相互抵消,八个强度值之和为零。指标以此作为内部校验:若数值不能相互抵消,则说明分解有误。这也意味着读数是相对的而非绝对的。一种货币并非自身强势,而只是相对于这一组中的其余货币强势。 由于计算读取的是货币而非图表,无论指标挂在哪个品种上,出现的都是同样的八条曲线。 历史曲线能展示而快照无法展示的内容 排名告诉您今天的次序。历史则告诉您这一次序维持了多久、领先者仍在攀升还是已经转向,以及两种货币何时互换了位置。交叉之处就是排名易主之时。 可以关闭单独的货币,

TDST Sniper Improved: The Support & Resistance Indicator That Never Repaints Stop chasing levels that disappear. Most indicators lie to you—they redraw, repaint, and change their mind after the fact. TDST Sniper Improved doesn't play games. What you see is what you get. Forever. Based on the legendary work of Thomas DeMark (popularized by James Pearl), this indicator identifies high-probability support and resistance clusters that hold their ground across all timeframes—from M5 scalping

Heiken Ashi and Renko Pro is a professional indicator that combines two methods of price movement analysis in one convenient MetaTrader 5 subwindow. This indicator helps assess trend direction, filter market noise, and track price movements.
Advantages:
1. Two types of analysis in one indicator
Heiken Ashi and Renko are displayed simultaneously in a single subwindow, allowing you to compare the smoothed market direction with the actual price movement.
2. Reduced visual market noise
Heiken Ash

Fractal Confirmed Zones Pro MT5 is designed for traders who want objective, confirmation-based supply and demand zones instead of subjective rectangles drawn around every consolidation. The indicator detects significant market extremes, identifies the candle streak that created the move, and confirms the zone only after price closes beyond the originating structure. After a Layer-1 zone is confirmed, the indicator can automatically inspect the current and lower timeframes to locate the first val

Fractal FVG Pro MT5 Fractal FVG Pro is a professional Fair Value Gap indicator built for traders who want more than a basic three-candle imbalance detector. Instead of drawing every small gap on the chart, the indicator uses configurable ATR and displacement filters to identify cleaner FVG structures, track how much of each gap has been filled, and automatically search lower timeframes for a more precise nested Layer-2 FVG. The result is a structured two-layer imbalance system: Layer 1: the prim
您知道为什么MetaTrader市场是出售交易策略和技术指标的最佳场所吗?不需要广告或软件保护,没有支付的麻烦。一切都在MetaTrader市场提供。
