Multi Anchor VWAP
- 指标
- 版本: 4.13
- 更新: 23 八月 2026
- 激活: 5

Launch price: 30 USD - price will increase after the first purchases, so early buyers lock in this rate.
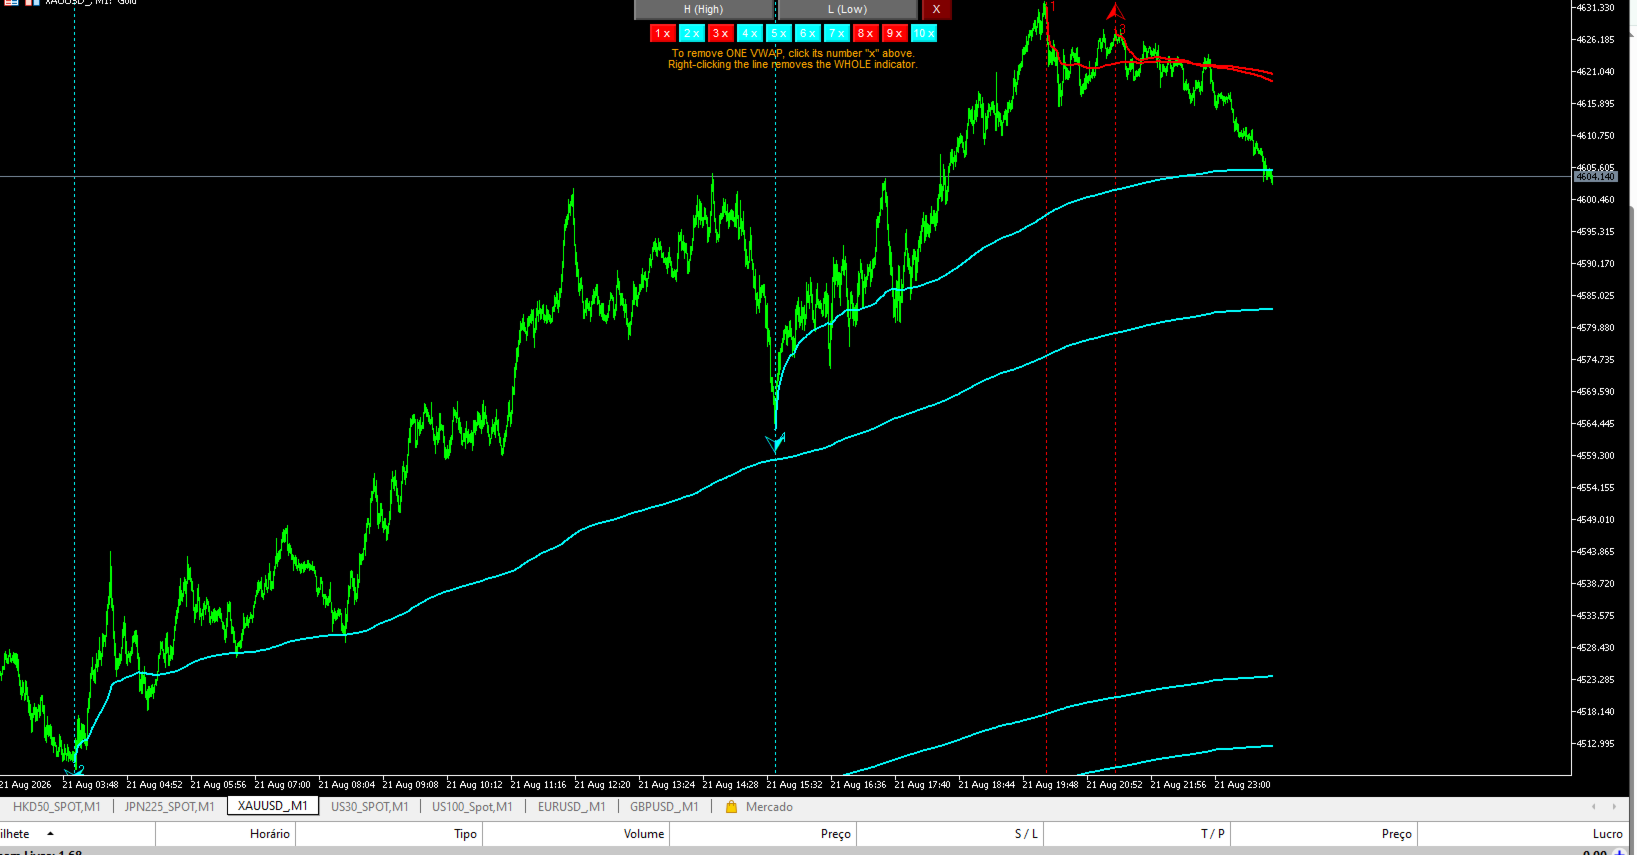
Multi Anchor VWAP lets you place a Volume Weighted Average Price line starting from any candle you choose, instead of only resetting automatically at the start of a session, day, week or month.
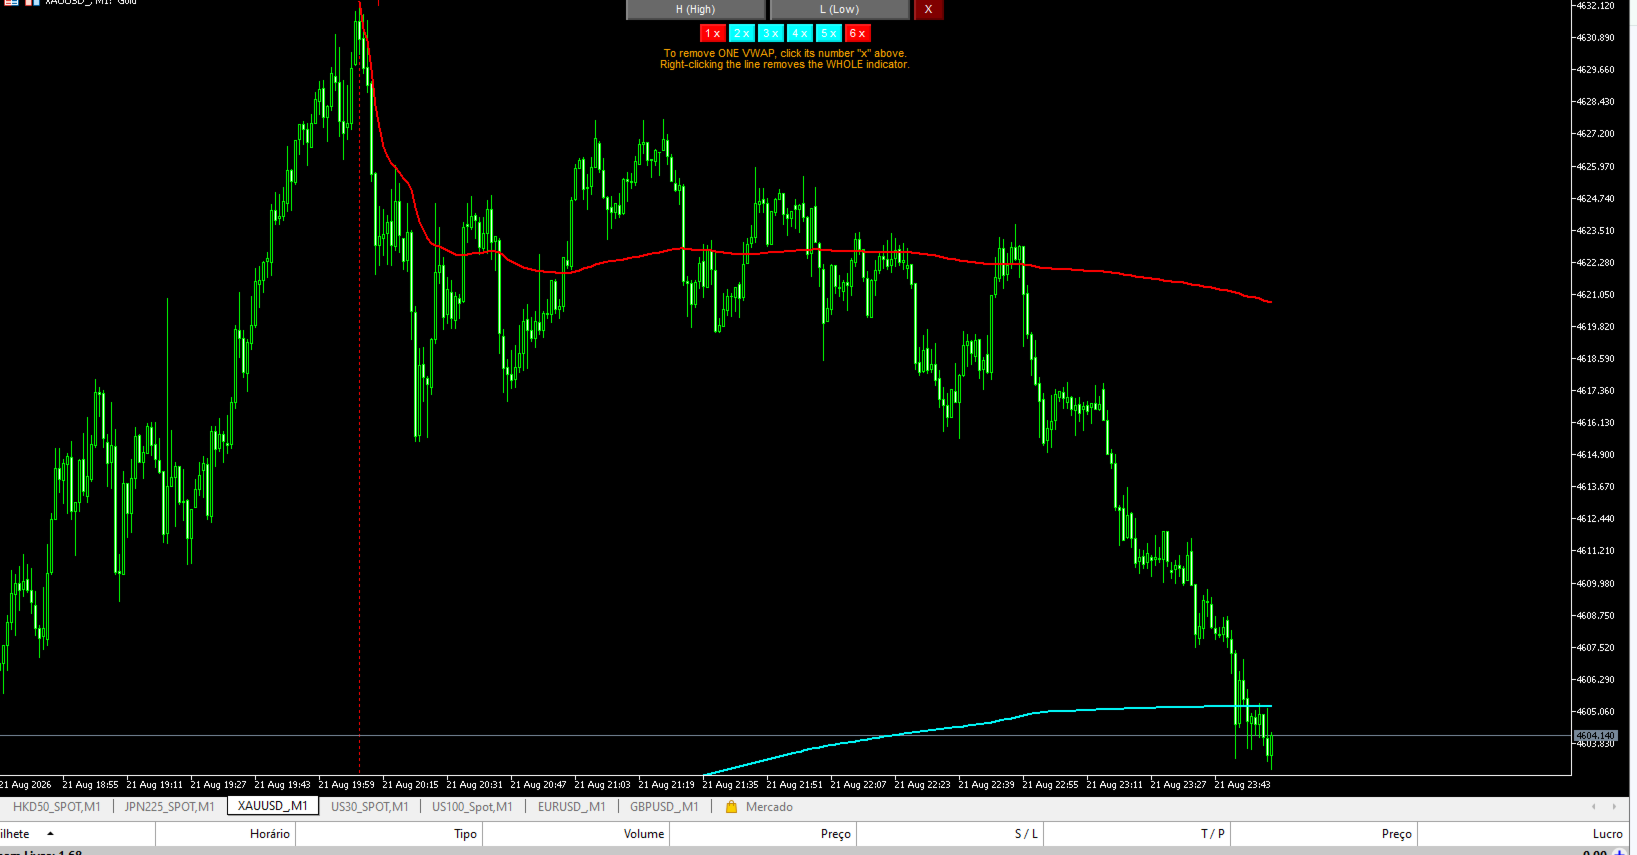
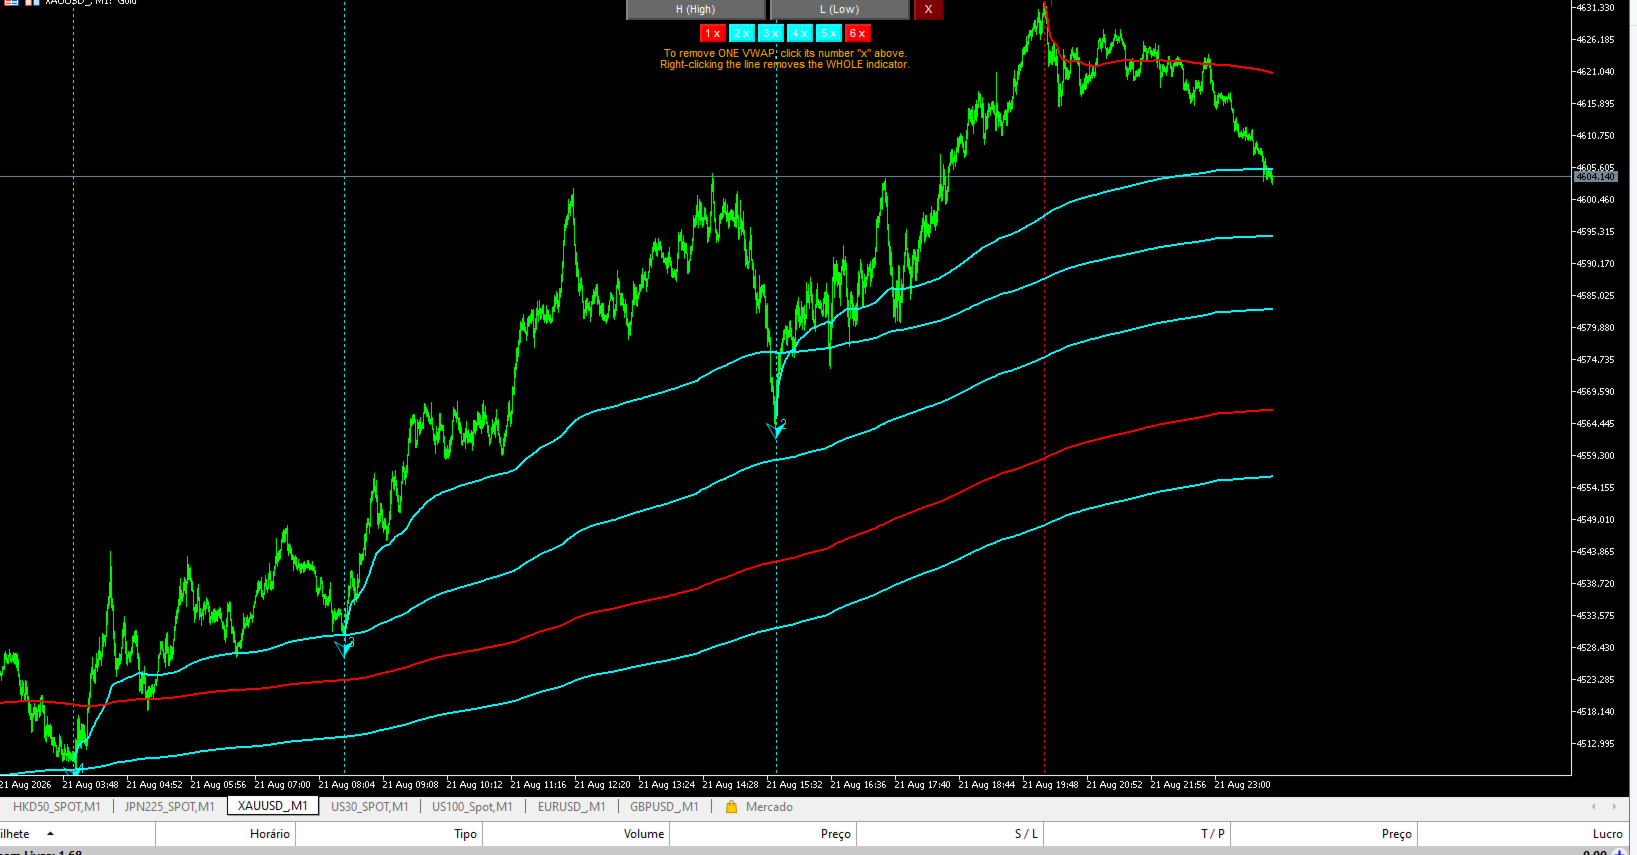
How it works: press the H or L button, then click the candle you want to anchor to, or use the Up and Down arrow keys to move to it and confirm with Enter. The VWAP line starts exactly at that candle's high or low and accumulates forward from there. You can place several anchors at once, up to 20, each one tracked and colored independently, red for High anchors and light blue for Low anchors by default, fully configurable.
Features:
- Multiple simultaneous anchors, each with its own numbered button to remove it individually.
- Keyboard navigation with the arrow keys, Enter or Space, as an alternative to clicking, for precise candle selection.
- A live preview arrow follows the mouse before you confirm the anchor point.
- Colors, line width and panel position are configurable.
- No repainting: each VWAP line only extends forward from the moment it was anchored.
- Works on any symbol, timeframe and account type.
How traders use it:
Anchoring VWAP at a specific high, low, or event, such as a news candle, a session open, or a swing point, shows the average price paid by market participants since that reference point. Price trading above an anchored VWAP is often read as strength relative to that reference, and below it as weakness. Multiple anchors let you compare several reference points on the same chart at once.
This is a visual analysis tool. It does not open, modify or close trades.