YouTube'dan Mağaza ile ilgili eğitici videoları izleyin
Bir alım-satım robotu veya gösterge nasıl satın alınır?
Uzman Danışmanınızı
sanal sunucuda çalıştırın
sanal sunucuda çalıştırın
Satın almadan önce göstergeyi/alım-satım robotunu test edin
Mağazada kazanç sağlamak ister misiniz?
Satış için bir ürün nasıl sunulur?
MetaTrader 4 için Uzman Danışmanlar ve göstergeler - 52

Multi Timeframe Indicator includes a lot of functions and can be considered as a universal helper for a trader. It's main objective is to display up to 10 indicators at a time using just one small brick per each of them. These indicators involve Awesome Oscillator, CCI, DeMarker, MACD, RSI, RVI, Stochastic, Larry Williams' Percent Range, Bulls Power and Bears Power. An important function of the indicator is an ability to monitor signals from different timeframes. You can choose different combina
FREE

This is a custom MT4 indicator called “Elsna Moving Average” . It plots three moving averages (MA1, MA2) on the chart with customizable periods, shifts, methods, and applied prices. MA1 & MA2 can optionally be used to create fill areas (histogram-like shading) based on a color-fill setting You can show or hide each MA individually. The indicator is designed for trend identification and visualization , helping traders see MA relationships and potential support/resistance zon
FREE
Highly configurable Accumulation and Distribution (AD) indicator. Features: Highly customizable alert functions (at levels, crosses, direction changes via email, push, sound, popup) Multi timeframe ability Color customization (at levels, crosses, direction changes) Linear interpolation and histogram mode options Works on strategy tester in multi timeframe mode (at weekend without ticks also) Adjustable Levels Parameters:
Ad Timeframe: You can set the lower/higher timeframes for Ad. Ad Bar Shif
FREE

R Alligator göstergesi Bill Williams tarafından tanıtıldı, 3 düzleştirilmiş hareketli ortalamanın yardımıyla trendi takip ediyor.
Varsayılan olarak aşağıdaki değerler kullanılır: 13 dönemlik düzleştirilmiş hareketli ortalama (Çene olarak bilinir) 8 dönemlik düzleştirilmiş hareketli ortalama (Diş olarak bilinir) 5 dönemlik düzleştirilmiş hareketli ortalama (Dudaklar olarak bilinir)
R Alligator göstergesi, hareketli ortalamaları yumuşatarak yanlış trend işlemlerinin sayısını azaltır.
Temel Tic
FREE

R Wavy Dash göstergesi, fiyat verilerini ticarete giriş ve çıkış için çalışan mükemmel bir trend takip eden sinyaller göstergesine dönüştürür. Ana grafikte renkli bir sinyal çizgisi olarak görünür ve bağımsız bir ticaret aracı olarak kullanılabilir.
R Wavy Dash göstergesi çok güvenilirdir, hafiftir ve ticaret platformunuzu yavaşlatmaz.
Anahtar noktaları Trend sinyali göstergesi Çaylak dostu yeniden boyanmaz Gösterge koleksiyonunuza eklemeye değer Bu gösterge, olası bir trend tersine çevirme o
FREE
Highly configurable OBV indicator.
Features: Highly customizable alert functions (at levels, crosses, direction changes via email, push, sound, popup) Multi timeframe ability Color customization (at levels, crosses, direction changes) Linear interpolation and histogram mode options Works on strategy tester in multi timeframe mode (at weekend without ticks also) Adjustable Levels Parameters:
OBV Timeframe: You can set the lower/higher timeframes for OBV. OBV Bar Shift: Y ou can set the offset
FREE

A simple but very powerful EA. It uses two moving averages as a basis for opening orders, which when they cross, orders will be opened. The open order will be closed in two situations: When there is a new crossover opposite the previous one, in this case the price touches the slower moving average, or when it reaches the automatic Take Profit margin. If the price goes in the opposite direction, it will open new orders at the new crossings of the moving averages to calculate the average price and
FREE

This EA is literally a reverse of Recovery Zone Assistance, as its name says ... It is an assistant, an expert advisor that monitors all the orders for the asset in which it has been placed, no matter if that order was by some other expert advisor or by the trader placed on the Manually, he will start his work after each order that is negative. Find Recovery Zone Assistance on https://www.mql5.com/en/market/product/68909 This Expert Advisor is based on this sistem on video "Recovery Zone" on
FREE

***IMPORTANT: This free indicator works with the paid for Strong Weak Forex Expert Advisor. The EA also depends on the following custom indicators: Strong Weak Parabolic Strong Weak Symbols Strong Weak Values Strong Weak Indicator Download them for free in the Market. The EA will not work without it. These are all custom indicators which the Strong Weak Forex Expert Advisor relies on to generate trading signals. If you have any problems with installation send me a message.
FREE

Fisher Yur4ik Indicator is a momentum indicator originated by Yuri Prokiev (Russian). I combined the Fisher Test indicator with other indicators to sieve/filter signals. It is not used as a standalone indicator but in combination to filter out Price Action signals. I have uploaded this indicator (Fisher test) for download alongside the 3Bar_Play signal indicator for signals to appear. It is free.
FREE

The parabolic stop and reverse (PSAR) indicator was developed by J. Welles Wilder, Jr. as a tool to find price reversals which can be utilized as stop-loss levels as well as trade triggers. The notable difference about the PSAR indicator is the utilization of time decay. The PSAR indicator forms a parabola composed of small dots that are either above or below the trading price. When the parabola is below the stock price, it acts as a support and trail-stop area, while indicating bullish up t
FREE
Check out other great products from https://www.mql5.com/en/users/augustinekamatu/seller
This indicator is the best so far at estimating reversal points especially on high time frames. It does not repaint and is based on a combination of moving averages computed using custom functions. No inputs required, it is simple plug and play. The principles used ensure that it can be used on CFDs, Commodities and Stock with incredibly great results. With proper money management and portfolio balancing
FREE

The Mono Waves indicator is designed to display the wave behavior of the market on a chart. Its appearance is presented on slide 1. This indicator uses the PPPC (Point-Percent Price Channel) indicator, which can be downloaded for free from the Market . When the market moves up, the upper border of the price channel is built on High candlestick prices (for more details, see the description of the PPPC indicator at the link given above). The higher the High prices rise, t
FREE
Loop Pattern EA is an automatic long term strategy trader. Minimum trading account 10,000. Best performance on GBPUSD 1h. This EA calculates amount of candles back controllable by the user and applies certain function:
if (calculate_Green_Body()>calculate_Red_Body() && calculate_Green_High()<calculate_Red_Low() && newcandle()) { buy(); } ... There are no stoploss or takeprofit and the trades closes then the opposite signal arrives. this EA operates only once per bar
FREE
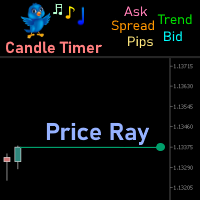
Price Ray indicator is a utility that will improve the way you trade. Primarily, it shows the Bid, Ask or Last price as a line ray which beams till the current candle, last visible chart candle or extended to all candle bars. The enhanced features in this indicator provide information in an area where you focus most, right next to the current candle. You can select text to be shown above or below the Price ray. The indicator is fully customizable, allowing it to fit any strategy requirements. Th
FREE

The Multi-Timeframe High Low Points (MTF High Low Points) indicator is a powerful tool for traders using MetaTrader 4 (MT4) to analyze price movements across different timeframes. This versatile indicator helps traders identify significant support and resistance levels by displaying the highest and lowest price points within a specified number of bars on multiple timeframes simultaneously. Key Features: Multi-Timeframe Analysis: MTF High Low Points allows traders to monitor high and low price le
FREE

Summary: This EA places a single trade at a time in a RANDOM direction (buy or sell) and uses a simple TP & SL. A lot multiplier is also optional. Once a trade hits TP/SL, it will place another trade in a random direction. And so on. Since it only ever has 1 trade open at a time, it can be used on any broker. Which means it can be used on US brokers with the FIFO rule. Inputs are few and everything is based in Points too. So it can be used on any chart reliably and easily. You will be amazed how
FREE

The technical indicator, in real time, searches for candlesticks that exceed the size set in the settings and gives signals about them. As a rule, such abnormally large candles appear either at the beginning of strong impulses or at the end of a directional price movement. At the beginning of the pulse, the signal can serve as a basis for searching for an entry point, at the end of the movement, it is a sign of a climax and may indicate the near end of the trend. The reference size for filtering
FREE

T-Explorer is a Real Time Optimized MetaTrader 4 tool that provides tradable information based on the 10 of the most popular and reliable technical indicators in many timeframes. Our machine learning models calculate the optimum rules and configuration for each indicator in order to provide high probability signals of success. Users are able to customize T-Explorer by selecting suitable timeframes and mode ( FAST, MEDIUM, SLOW ) for the indicators to be used. T-Explorer aggregates and combines o
FREE

7 yıl sonra, kendi indikatörlerimi ve Uzman Danışmanlarımı ücretsiz olarak paylaşmaya karar verdim.
Eğer bunları faydalı bulursanız, lütfen 5-yıldız ile destek gösterin! Geri bildirimleriniz ücretsiz araçların gelmeye devam etmesini sağlar! Daha fazla ücretsiz aracımı ve canlı sinyalimi buradan görebilirsiniz buraya tıklayın
_________________________________ Engulf Dedektörü - Basitleştirilmiş İşlem İndikatörü Forex piyasasında yutan (engulfing) formasyonlarını tespit etmek i
FREE
Bu, Haber Filtresini kullanmak için gereken komut dosyasıdır. Bu komut dosyası filtrelemek istediğiniz herhangi bir grafiği seçer ve girdileri Haber Filtresi programına gönderir. Her girdi o grafiğe özeldir, böylece her grafik için farklı girdiler ayarlama esnekliğine sahip olursunuz. Haber Filtresi (ücretsiz demo) bağlantılarını aşağıda bulabilirsiniz: Haber Filtresi Kılavuzu + İndirme Bağlantıları
Haber seçimi
Haber kaynağı, Forex Factory'nin ekonomik takviminden alınmaktadır. Seçim USD, EUR,
FREE

Prop Trader's Guardian: The Ultimate Risk Manager
(Product for MetaTrader 4)
Protect your capital and secure your funded account with the Prop Trader's Guardian. This is not just another drawdown checker; it's an account-level circuit breaker designed specifically for the strict rules of proprietary trading firms. When your daily limit is hit, it doesn't just close trades—it locks down your entire terminal to prevent any further activity until the next trading day.
The Prop Firm Trader's Dil

Ürün Başlığı Smart Momentum (MT4) – SmartView serisinin bir parçası Kısa Açıklama MetaTrader platformunda benzersiz bir kullanıcı deneyimi sunan Momentum göstergesi. Daha önce mevcut olmayan gelişmiş özellikler sunar, çift tıklama ile ayarları açma, silmeden göstergeleri gizleme/gösterme ve gösterge penceresini tam grafik boyutunda görüntüleme gibi. SmartView Indicators serisinin geri kalanı ile sorunsuz çalışacak şekilde tasarlanmıştır. Genel Bakış SmartView serisi, yenilikçi özellikler aracılı
FREE

Ürün Başlığı Smart Awesome (MT4) – SmartView serisinin bir parçası Kısa Açıklama MetaTrader platformunda benzersiz bir kullanıcı deneyimi sunan Awesome göstergesi. Daha önce mevcut olmayan gelişmiş özellikler sunar, çift tıklama ile ayarları açma, silmeden göstergeleri gizleme/gösterme ve gösterge penceresini tam grafik boyutunda görüntüleme gibi. SmartView Indicators serisinin geri kalanı ile sorunsuz çalışacak şekilde tasarlanmıştır. Genel Bakış SmartView serisi, yenilikçi özellikler aracılığı
FREE

Ürün Başlığı Smart CCI (MT4) – SmartView serisinin bir parçası Kısa Açıklama MetaTrader platformunda benzersiz bir kullanıcı deneyimi sunan CCI göstergesi. Daha önce mevcut olmayan gelişmiş özellikler sunar, çift tıklama ile ayarları açma, silmeden göstergeleri gizleme/gösterme ve gösterge penceresini tam grafik boyutunda görüntüleme gibi. SmartView Indicators serisinin geri kalanı ile sorunsuz çalışacak şekilde tasarlanmıştır. Genel Bakış SmartView serisi, yenilikçi özellikler aracılığıyla Meta
FREE
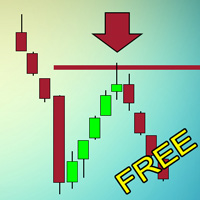
Индикатор, который ищет качественные точки входа в рынок и отображает их в виде стрелок. Действует по сложному алгоритму. Сначала ищет на графике специальные уровни, которые обязательно должны быть пробиты импульсом. Если цена возвращается к этому уровню в виде свечи с длинной тенью и маленьким телом и касается уровня только тенью - возникает точка входа. Не перерисовывается! Лучше всего выглядит и отрабатывает на Н1.
Может использоваться как: Индикатор уровней, где цена будет останавливат
FREE

The M.O.D.E stands for " Multiple Oscillator Divergence Exit ". It is an indicator which signals a divergence between the price, and multiple oscillators. It is initially an exit indicator because it signals the weakening of a trend, but it could be used as an entry signal if used analytically Key Features: Check many divergences at once Non repainting Sends Alerts and Push Notifications You could load the M.O.D.E onto a single chart, and be able to see the divergences happening on multiple os
FREE

L'indicatore Trend Reversal è uno strumento tecnico progettato per identificare potenziali inversioni di trend sul mercato, basandosi sulla formazione di Pin Bar . È particolarmente efficace su time frame come H1 (orario) , dove i pattern di inversione tendono a essere più affidabili. L'indicatore segnala le inversioni di trend disegnando un pallino rosso per indicare un potenziale trend ribassista e un pallino verde per un potenziale trend rialzista. Come Funziona l'Indicatore L
FREE

SmartChanelFree is a universal indicator for all types of markets. This indicator should have in its arsenal every trader, since it represents a classic approach to analyzing the price of a trading instrument and is a ready-made trading strategy. The indicator forms the upper, average price movement limit. Attention !!! This version of the indicator is trial and works only on the chart with the period M1. The full version of the indicator can be found at: https://www.mql5.com/en/market/product/
FREE

Close All SELL Orders for MT4 script - closes absolutely all orders, whether pending or market ones.
Orders are closed at the current profit/loss indicators at the time of closing.
The script is suitable for moments when you need to quickly close all orders at the current indicators.
The script is very easy to use, just drag the script onto the chart and it will do its job.
Add me as a friend, I have many other useful products.
FREE

Product Title Clean Fractal Pro — RSI Fractal Bias Indicator: Precision Signals with H4 Edge Unlock high-probability trades on M30 charts with this non-repainting powerhouse . It combines: H4 RSI Bias (>50 for bullish, <50 for bearish) to filter major trends. 20-period SMA (Typical Price) for dynamic support/resistance. M30 RSI Momentum (above 40 for buys, below 60 for sells) to time entries. Fractal Confirmation (lower fractal for buys, upper for sells) on closed bars for rock-solid, lag-fre

Economic Calendar Viewer
This economic events reader is adapted to load data from a csv file. You can prepare the csv file yourself according to this template, you can do it in notepad or csved. The file should normally be named Calendar-MM-DD-YYYY.csv. And contain lines with data column headers according to this example. In the Impact column, i.e. impact on the market depending on the importance of the event, the names accepted from the least important are: None, Low, Medium, High. In columns
FREE

Introducing Force Jurik—a powerful indicator designed to enhance trading insights by combining custom moving averages based on Jurik with the MetaTrader 4 indicator, Force Index.
Jurik moving averages are renowned for their precision and smoothness, making them ideal for analyzing price movements in the forex market. They offer traders a reliable method of identifying trends and filtering out market noise, ultimately providing clearer signals for decision-making.
The Force Index, a popular Me
FREE
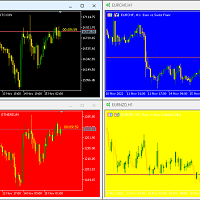
Hello again This is a free indicator that provides you with a panel at the corner of your chart to change your background. If you want to hide it, you should click on the minimize button above the buttons. Let me know what other free indicators you need! If those are easy I will make them for you ;) Many other tools are in the row. So wait and look! Hope to Enjoy it Sepehr (Faran)
FREE
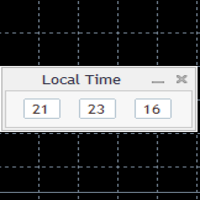
Simply clock. Local time as default. There are possible to Select: Local Time /Server Time /GMT Time as input. Please take into account that the local time is the most accurate. However ,this clock always uses local time seconds, even If GMT / Server Time Is selected. I solved it this way to get more accuracy. Delays can occur when changing minutes or hours, if local time is not selected.
FREE

Latest Changes in 1.6 : Added Signal Modes input. Mode 1 : HPF positive go long blue, HPF negative go short red. Mode 2 : slow envelope only, HPF above upper envelope go long blue, HPF below lower envelope go short red. Mode 3 : HPF above both upper envelopes - go long blue, HPF below both lower envelopes go short red. Mode 4 : Go long blue if HPF crosses above upper slow, but fast upper should be below slow upper at the time, exit when HPF crosses below upper fast, reverse logic for short red
FREE

LotSize Indicator Discover the appropriate lot size to use in your trades based on the available margin. This indicator provides valuable information for risk management. If the indicator shows a value of 0, it means that your balance or available margin is insufficient for trading. It is important to maintain adequate margin levels for safe trading practices. This indicator is exclusively designed for the MT4 platform, a popular and reliable trading platform in the market. With the LotSize Indi
FREE
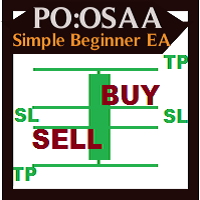
The PO_OSAA:Simple Beginner EA is a simple and user friendly ea,designed to open and close order. It is designed to be use alone. The PO_OSAA:Simple Beginner EA will open a new market order base on the author algorithm and modify it with TakeProfit and StopLoss. Examples: if conditions BUY, the ea will open buy order, Ea will modify the StopLoss with xPip and TakeProfit with(xPip)*3. This ea can be use by every level of forex trader.It can be use with all time frames.
Features Placing of order
FREE
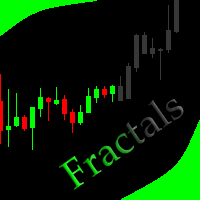
This indicator allows to hide Bill Williams Fractals (on all MT4 timeframes) from a date define by the user with a vertical line (Alone) or a panel (with "Hidden Candles"). Indicator Inputs: Indicator Color Indicator Width Information on "Fractals" indicator is available here: https://www.metatrader4.com/en/trading-platform/help/analytics/tech_indicators/fractals ************************************************************* Hey traders!! Give me your feeds! We are a community here and we hav
FREE

Your Chart göstergesi ile ticaret deneyiminizi geliştirin! Bu ücretsiz ve yüksek derecede özelleştirilebilir araç, trader'ların birden fazla zaman dilimini tek bir temiz mum çubuğu gösterimine birleştirmelerine olanak tanır, orijinal grafiği değiştirmeden. Your Chart ile, her bir özel mum için çubuk sayısını ayarlayabilirsiniz – örneğin, her 18 M1 mumunu bir tanesine birleştirerek piyasa trendlerine daha geniş bir bakış açısı sağlar. Ana Özellikler: Özelleştirilmiş Mum Oluşumu : Bir mumu oluştur
FREE
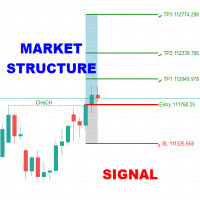
The Market Structure Signal indicator is designed to detect Change of Character (CHoCH) and Break of Structure (BOS) in price action, helping traders identify potential trend reversals or continuations. It combines market structure analysis with volatility (ATR) to highlight possible risk/reward zones, while also supporting multi-channel alerts so that no trading signal is missed. Interpretation Trend Analysis : The indicator’s trend coloring, combined with BOS and CHoCH detection, provide

This indicator calculates gann support and resistance prices with use gann pyramid formulation and draw them on the chart. And If you want, Indicator can alert you when the current price arrive these pivot levels. Alert Options: Send Mobil Message, Send E-mail, Show Message and Sound Alert Levels: S1, S2, S3, S4, S5, R1, R2, R3, R4, R5 Inputs: GannInputPrice: Input price for gann pyramid formulation. GannInputDigit: How many digit do you want to use for calculation formula. (The number and the
FREE

Export Order History Free ! Meta Trader 4 script Please leave a review about this product to help other users benefit from it. Export trades history into a CSV file ( Excel sheet ) The summary is saved into a file in MQL4\Files folder. Choose / A ccount history / C ustom period from your MT4 Select period Click OK to Export file directory Open MT4 data folder CSV file ( Excel sheet ) Order > Open time > Close time > Type > Symbol > Size > Entry price > Exit price > T/P >
FREE

Wolf Scalper Expert Advisor
Wolf Scalper is a fully automated scalping robot that uses a very efficient breakout strategy, advanced money management and probabilistic analysis. Most effective in the price consolidation stages that occupy the bulk of the market time. Proven itself on real accounts with an excellent risk-to-reward ratio. Does not need forced optimization, which is the main factor of its reliability and guarantee of stable profit in the future. Suitable for both beginners and exper
FREE

Purpose: The function of this indicator is to draw 3 moving averages (MA's) lines on the main MT4 price chart. The MA's are from 3 different timeframes specified by the user independent of the chart that is currently displayed. When you toggle your chart view through different time frames, the 3 MA's will continue to display the MA lines for the time frames specified in the properties. Example: The default settings map out three 50 bars MA's for H4, D1 and W1 time frames. During intraday tradi
FREE

The MA ribbon is not a single indicator but rather an overlay of multiple moving averages (typically four to eight or more) of varying lengths plotted on the same price chart. Visual Appearance: The resulting lines create a flowing, ribbon-like pattern across the price chart. Components: Traders can use different types of moving averages, such as Simple Moving Averages (SMA) or Exponential Moving Averages (EMA), and adjust the time periods (e.g., 10, 20, 30, 40, 50, and 60 periods) to suit t
FREE

This free EA is built on a robust strategy designed for long-term stability and performance.
The best results are achieved by optimizing the parameters and adapting them to your broker’s conditions (transaction costs, latency, leverage). For a more powerful edition (with additional filters, advanced risk management, and asset-specific presets) or a MT5 version feel free to contact me.
️ Test Parameters
Pair : GBPUSD Timeframe : H3 Initial Deposit : 10 000 Leverage : 1:30
FREE

1. Make sure you trade only with GBP/USD on an 1h chart as this model is built specifically for the hourly Cable trading. 2. If you are backtesting the EA during weekends, make sure to specify a reasonable spread (such as 30 or 50) instead of using current spread because the market is not trading and the current spread may be some awkward number. During weekdays, feel free to use current spread as it is the correct current spread value. 3. If you want to have an even more stable-performing EA,
FREE

The indicator is based on identifying engulfing candlestick patterns within the current timeframe. When such patterns are found, it generates buy and sell signals represented by up and down arrows, respectively. However, the user is responsible for determining the prevailing trend. Once the trend is identified, they should trade in line with the corresponding signal that aligns with the trend direction.
FREE
Questo indicatore per MT4 traccia automaticamente i punti di pivot giornalieri sul grafico, fornendo livelli chiave di supporto e resistenza basati sui prezzi di apertura, chiusura, massimo e minimo del giorno precedente. I punti pivot aiutano i trader a identificare potenziali aree di inversione e zone di prezzo critiche, migliorando la precisione nelle decisioni operative quotidiane."
FREE

This EA manage your trailing stop loss on every manual opened position and he lead your position to profit. This is free tool that can be used from any trader and is special good for rookie traders. You must to try it and you can feel how your positions go to profit.
I'm a professional forex trader for about 4 years now and I'm specialized in automated trading systems (EA's) and scalping trading strategies. I've tried a lot in my journey and finally found the tools that make consistent results
FREE
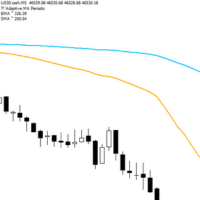
Adaptive Flow MAs is a moving average indicator designed to naturally adjust to market movements. Unlike traditional averages, it dynamically adapts its periods based on recent volatility and the current trend. The EMA closely follows rapid price swings to capture every impulse, while the SMA remains smoother, providing a stable and reliable reference. With a clean display showing the current adaptive periods, this tool helps traders feel the “flow” of the market without visual clutter. It’s cr
FREE
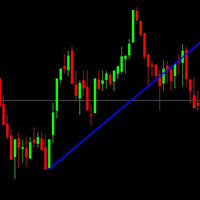
This is just a simple indicator that show Alert when the Current candle Close Below the Trendline. Previous candle do not affect the Alert.
The indicator is tied to the Trendline so if the Trendline is accidentally deleted, the Alert will not work. The indicator will draw another Trendline if the current Trendline is deleted.
Removing the indicator will removed the Trendline.
There are 4 type of Alert to set: Popup Alert, Signal Alert, Push Notification, Comment.
FREE
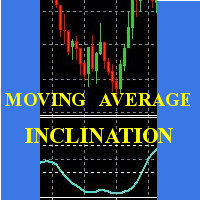
Scalp using the behavior of a short moving average, the indicator gives the slope and identifies the "hyper" moments.
Operational advice:
Use M1 chart. Period 20 : open buy after two rising lows; sell after two max downhill; avoid countertrend openings; when the line goes flat put a stop at the opening price. Avoid actions in low volatility timeslots. When the curve that draws the min / max is very flat, it is better to postpone at least 15'.
Period 50 : matches the trend, when it is at the
FREE
The purpose of this new version of the MT4 standard indicator provided in your platform is to display in a sub-window multiple timeframes of the same indicator. See the example shown in the picture below. But the display isn’t like a simple MTF indicator. This is the real display of the indicator on its timeframe. Here's the options available in the FFx indicator: Select the timeframes to be displayed (M1 to Monthly) Define the width (number of bars) for each timeframe box Alert pop up/sound/ema
FREE
Discover our sophisticated Expert Advisor (EA) designed for the MetaTrader 4 (MT4) market: IT Bollinger Bands. This free EA exploits a trading strategy based on Bollinger Bands, offering a powerful approach to optimizing your operations in the financial market. Key Features : Bollinger Bands Strategy: Our EA uses Bollinger Bands, a popular approach in technical analysis. Based on the period (20), the standard deviation (2), and the shift of the bands, our EA identifies trading opport
FREE

Change All Timeframe – Instantly Sync Timeframes Across All MT4 Charts Effortlessly change the timeframe of all open charts in MT4 with a single action! The Change All Timeframes script saves time by ensuring all charts update simultaneously, streamlining multi-timeframe analysis. One-Click Timeframe Sync – Instantly change the timeframe on all open charts at once.
Save Time & Effort – No need to adjust each chart manually—boost your trading efficiency.
Seamless Multi-Timeframe Analysis –
FREE

Genaral: Not martingale, not a grid; Use on EURUSD Use on M5 EA was opimized only on 2020 year
Signals: There is a good rational algorithm. Work of 3 indicators: WRP, DeMarker, CCI (from 3 timeframes) (you can set a separate Timeframe for each indicator)
Stop Loss/Take Profit: There is a good money management system (there are several type for trailing stop loss); There is virtual levels of Stop Loss / Take Profit; There is smart lot (percent by risk) or fix lot
Important: EA can work on
FREE

Sweeper PRO – Advanced Candle Sweep Detector (3-in-1) For any questions, technical issues, or support requests, feel free to contact us through any of the following channels: WhatsApp Support: Contact1 Contact2 Email:
Money.transporter@gmail.com Overview Sweeper PRO is a powerful and fully customizable indicator designed to detect three unique types of candle sweeps — smart entry and reversal patterns commonly used by professional price action traders.
It automatically identifies po

Candle Pattern Alert indicator alerts when the last price closed candle matches the set input parameters. You can choose to scan through all the symbols in Market Watch or enter your favorite symbols and also you can enter time frames you need to scan. --------- Main settings- ------- Select all symbols from Market Watch? - if Yes the program scans through all the symbols displayed in Market Watch, if No - only selected in next input symbols are scanned
Enter symbols separated by commas - enter
FREE
Trade Assistant MT4 Introducing Tipster Trendlines 2: The Future of Manual Trading is Here! This is a Trade Assistant for MT4. Are you ready to elevate your trading game? Tipster Trendlines 2 isn’t just another tool; it’s your ultimate trading companion —designed to empower you, save time, and help you trade smarter. For 9 years, this tool has been a game-changer for traders who value control, precision, and results. Now it’s your turn to experience its magic. What Makes Tipster Trendlines 2 S
FREE

如果产品有任何问题或者您需要在此产品上添加功能,请联系我 Contact/message me if you encounter any issue using the product or need extra feature to add on the base version.
PA Touching Alert is a tool to free you from watching price to touch certain critical price level all day alone. With this tool, you can set two price levels: upper price and lower price, which should be greater than/ less than the current price respectively. Then once price touches the upper price or lower price, alert and/or notification would be sent
FREE
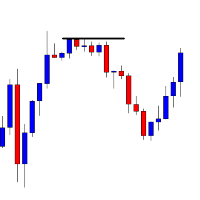
A very simple Ea that put Buy or Sell at Break-out of Maximun of the day before. Here the external variable: 1 Lots (Lot for Buy and Sell() 2 Stop (Stop for Buy and Sell with value * Point) 3 Take (Take for Buy and Sell with value * Point) 4 UpMax (A value that increase the open position on Buy) 4 DownMin(A value that decrease the open position on Sell) This Ea work on all Forex Graphics
For all dubts or problem contact me at crashmens@gmail.com
FREE

RJT SALAMANDER, the indicator as in a video game
VERSION 2
Pilot your PRICE spaceship inside the cavern and avoid the collision against the stalactites (green) and stalagmites (red), dodging these obstacles to win.
When these objects are forming (or disappearing) then you must make the decision how to move your ship (just like in a video game)
Depending on the market and the size of the candles/bars you can adjust the calculation of stalactites and stalagmites (based on the last bars) in the
FREE

Get This: The Ultimate Power Tool for Traders—Draw My Levels! Believe me, folks, this is BIG. This isn’t just some regular, everyday tool—this is *the* essential tool for your trading arsenal. “Draw My Levels” is a simple, elegant, and powerful script that’ll take your trading game to a whole new level. You want precision? You want control? You want to see where the real action is happening on the chart? Then this script is for you. Why Do You Need This Script? Let me tell you, if you’re a trade
FREE

The purpose of this new version of the MT4 standard indicator provided in your platform is to display in a sub-window multiple timeframes of the same indicator. See the example shown in the picture below. But the display isn’t like a simple MTF indicator. This is the real display of the indicator on its timeframe. Here's the options available in the FFx indicator: Select the timeframes to be displayed (M1 to Monthly) Define the width (number of bars) for each timeframe box Alert pop up/sound/ema
FREE
Designed especially for GBPUSD 30m market. Minimum trading account 1000 $. The EA trading engulfing candle formations combined with adx indicator. There are 3 main methods of orders placement and management, all three methods are profitable with different results for user to chose. tested on a specific market and timeframe but can operate on other markets ass well.
developed, tested and optimized on " VantageMarkets " platform.
FREE

The indicator shows the maximum and minimum number of lots, as well as the size of the symbol spread. This information is needed to make a quick market entry decision based on the deposit maximum. The calculation considers free funds and funds sufficient for opening one lot. Such situations are common when you participate in various forex contests or trade in the market using your funds to the maximum, as well as during periods of increased or decreased volatility. The indicator provides the nec
FREE

The indicator plots an affine chart for the current instrument by subtracting the trend component from the price. When launched, creates a trend line in the main window. Position this line in the desired direction. The indicator plots an affine chart according to the specified trend.
Input parameters Maximum number of pictured bars - the maximum number of displayed bars. Trend line name - name of the trend line. Trend line color - color of the trend line. Black candle color - color of a bullish
FREE

Perseus is a free Expert Advisor for GBPJPY . It based on MACD and Bollinger Bands . It has been tested for 10 years of history (from year 2011). Tested by Monte Carlo with 200 simulations too. All trades are cover by StopLoss . Doesn't use Martingale or other dangerous startegies. Perseus using fixed lot size, which you can set in settings. Perseus settings are optimized for the best results . There is no need to change it.
Recommendations Symbol: GBPJPY Timeframe: H1 Deposit: 300 USD Br
FREE
MetaTrader platformunun uygulama mağazası olan MetaTrader mağazasından bir alım-satım robotunun nasıl satın alınacağını öğrenin.
MQL5.community ödeme sistemi, PayPal, banka kartları ve popüler ödeme sistemleri aracılığıyla yapılan işlemleri destekler. Daha iyi bir müşteri deneyimi için satın almadan önce alım-satım robotunu test etmenizi şiddetle tavsiye ederiz.
Alım-satım fırsatlarını kaçırıyorsunuz:
- Ücretsiz alım-satım uygulamaları
- İşlem kopyalama için 8.000'den fazla sinyal
- Finansal piyasaları keşfetmek için ekonomik haberler
Kayıt
Giriş yap
Gizlilik ve Veri Koruma Politikasını ve MQL5.com Kullanım Şartlarını kabul edersiniz
Hesabınız yoksa, lütfen kaydolun
MQL5.com web sitesine giriş yapmak için çerezlerin kullanımına izin vermelisiniz.
Lütfen tarayıcınızda gerekli ayarı etkinleştirin, aksi takdirde giriş yapamazsınız.