YouTube'dan Mağaza ile ilgili eğitici videoları izleyin
Bir alım-satım robotu veya gösterge nasıl satın alınır?
Uzman Danışmanınızı
sanal sunucuda çalıştırın
sanal sunucuda çalıştırın
Satın almadan önce göstergeyi/alım-satım robotunu test edin
Mağazada kazanç sağlamak ister misiniz?
Satış için bir ürün nasıl sunulur?
MetaTrader 4 için Uzman Danışmanlar ve göstergeler - 57
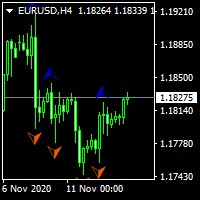
...................................................custom fractal............................................... .................................fractal is very help full to find waves and ............................... ...the defult fractal at meta trader dosent have input parameters and cant find any waves.. .............................................this is fractal with input......................................... ................................................for find any waves.......
FREE

The utility places a grid of pending orders. You can select the number of orders in the grid, the step between orders, multiplier for the order size, SL and TP levels and the magic number. If you use a profit bucket , please note that it applies to all orders on the current currency pair with the current magic. If you want to use several grids with independent profit buckets at the same time, run several copies of the utility and specify different magics in the settings.
MT5 version of the ut
FREE
The AllClosedMT4 utility in the form of an expert. The utility is designed for closing all open positions simultaneously based on the total profit (in the deposit currency) of all open positions. The utility can be attached to any chart with any trading instrument.
Parameters Profit - the total positive profit in the deposit currency, at which all open positions are closed (profit). Stop - the total negative profit in the deposit currency, at which all open positions are closed (loss). The valu
FREE

This indicator provides trading signals based on the polarity of the dynamical parameters of two digital signals. The dynamical parameters (momentum-acceleration) are derived by applying a high quality momentum oscillator, MTEMA LPD ( see Top Gun Oscillators ) to two digital signals. The MTEMA momentum oscillator is first applied to the price itself. Then, a rectification procedure is applied to the price based on the signals from the momentum oscillator yielding a rectified price signal. This s
FREE

Traders Dynamic Index (TDI) Signal Input parameters: signal mode: set it to true if you want to plug it into STAT (Signal Tester and Trader) arrow shift: distance between fast EMA line to arrow on chart middle band filter price line filter RSI period RSI price method Volatility period MA period 1 MA period 2 Averaging method You can find the best setting for 4 hour EURUSD on this video
FREE
Trender EA - автоматическая система, в основе которой заложен принцип торговли по тренду. Сначала система идентифицирует направление тренда и после этого ищет точки для входа в сделку. Уровень стоплосс определяется автоматически, а тейкпрофит на основе рассчитанного стоплосса. Советник оснащён системой сопровождения сделки "От цели к цели" - системы способной брать несколько целей с частичным прикрытием сделки. Настройки: Параметр Описание ID EA Идентификатор ордеров советника Mode trade Режи
FREE

Cross Trend Lines indicator trend indicator of find. This indicator, an array of works by using a series of indicator and algorithm. Uses two lines to find trends. The intersection of this line means that the start of the trend. These lines are green, tend to rise. Red lines indicate the downward trend. Use of this indicator is easy to understand. This indicator on its own or you can use other indicators that are appropriate for the strategy.
Suggestions and Features Starts a new trend at the
FREE

Close at time is a very useful EA to close specific positions at specific time. It also provides additional condition to setup. Close specific positions at time. Close specific positions which currently profits. Close specific long positions only. Close specific short positions only. Close specific pending orders. It is useful to support your trading strategies.
Parameters description magic : Target magic number to close. close_time_hr: Hour to close. (MetaTrader 4 terminal time) close_time_min
FREE

MATrend indicator makes the directional trend of the current market easily recognizable. Settings: MA Period : The amount of candles taken into consideration for the calculation of the moving average; MA Method : The method used for the calculation of the moving average. Selectable methods are: Simple averaging;
Exponential averaging;
Smoothed averaging;
Linear-weighed averaging; Usage: The color of the indcator will change based on the slope of the MA. Green : The indicator has a bullish sl
FREE

FastTradingPanel - Features Overview Core Features One-Click Trading - Execute market orders instantly with BUY/SELL buttons Editable Magic Number - Manage multiple strategies with custom magic numbers Quick Lot Adjustment - Increase/decrease lot size with + / - buttons Real-Time Price Display - Live Bid/Ask prices updated every second Pending Orders Management 4 Order Types - Buy Stop, Sell Stop, Buy Limit, Sell Limit Auto-Fill Prices - Automatically calculate pending order prices Quick Offs
FREE
This indicator highlights the exact points on the chart where the built-in ZigZag indicator repainted its peaks or troughs. Grey-colored arrows are plotted to show where a previously confirmed high or low was later shifted — a behavior known as repainting . Why it’s important:
Repainting can mislead traders by altering historical signals, giving a false impression of past accuracy. This tool helps traders visually track and understand when and where ZigZag repaints , improving strategy evaluati
FREE

The BB Arrows MTF indicator is based on the Bollinger Bands indicator. Represents input signals in the form of arrows. All signals are generated on the current bar. In 2 modes, Signals are not redrawn (Exception of very sharp jumps)! All signals in MTF mode correspond to signals of the period specified in MTF. It is maximally simplified to use both for trading with only one indicator and for using the indicator as part of your trading systems. A feature of the indicator is that the indicator ti
FREE

It Calculates Lot size for Manual Money Management.
If you want any custom feature or want to remove something from this product for your personal use. Please send me a personal message, I'll be happy to do so for you.
Inputs : Account Balance Risk Percent StopLoss in Pips
How to Use it : Put it on the Chart of Currency Pair which wanted to be Calculated Fill up All three Input fields with Desired Details After filling inputs Click the "Calculate !!" Button And then Results will b
FREE

The indicator displays two Moving Average lines on the chart with parameters specified in the settings. It issues a signal in the form of arrows and a sound at the intersection of these Moving Average. In the indicator settings, you can set the period of fast Moving Average ( Fast MA Period ) and slow Moving Average ( Slow MA Period ). And also Shift, Applied Price, Method and Timeframe for two Moving Averages separately. Important:
The main difference from othe
FREE

MACD Dashboard Panel This indicator helps you to scan symbols which are in the Market Watch window and filter out a trend according to MACD.
Moving Average Convergence Divergence (MACD) is a trend-following momentum indicator that shows the relationship between two moving averages of a security’s price. The MACD is calculated by subtracting the 26-period Exponential Moving Average (EMA) from the 12-period EMA.
The result of that calculation is the MACD line. A nine-day EMA of the MACD called
FREE

Automated medium-term Expert Advisor. It is based on Bollinger Bands . The EA is optimized for EURUSD H1 . The robot should be optimized for use on other instruments. The Expert Advisor does not use hedging, martingale, grid, arbitrage etc. The results obtained in the strategy tester are identical to the results of real trading. Since the results for Control points are close to results of optimization in every tick mode, the EA allows for quick optimization using Control points .
Parameters Mod
FREE

Zentrade, profesyonel seviyeye geçişiniz için bir adımdır. Sinyalinizin kaybolmayacağını ve mantığınızın bozulmayacağını bilerek güvenle işlem yapabilmeniz için size tutarlılık, netlik ve hassasiyet sağlayan bir göstergedir.
Yeniden Çizim Yok. Asla. AL ve SAT sinyalleri mevcut mumda anında oluşturulur ve kalıcıdır. Gördüğünüz şey gerçekliktir.
Değişmeyen Mantık. Geçmiş sinyaller silinmez veya değiştirilmez. Testlerinizin gerçek işlemlerle örtüştüğünden emin olarak geçmişi güvenle analiz
FREE

Bu ücretsiz aracı beğendiyseniz lütfen 5 yıldızlı bir derecelendirme bırakın! Çok teşekkür ederim :) "Risk Yönetimi Asistanı" Uzman Danışman Koleksiyonu, çeşitli piyasa koşullarında riski etkili bir şekilde yöneterek işlem stratejilerini geliştirmek için tasarlanmış kapsamlı bir araç paketidir. Bu koleksiyon, üç temel bileşenden oluşur: ortalama alma, değiştirme ve korunma uzman danışmanları, her biri farklı işlem senaryolarına göre uyarlanmış farklı avantajlar sunar.
Bu EA, piyasadaki standar
FREE

(Google çevirisi) Bu gösterge, kitabında açıklandığı gibi, John Welles Wilder Jr. tarafından geliştirilen orijinal “ Average True Range (ATR) ”yi uygular— Teknik Ticaret Ticaret Sistemlerinde Yeni Kavramlar [1978] . Basit hareketli ortalama (SMA) yerine düzleştirilmiş hareketli ortalama (SMMA) olarak da bilinen Wilder'ın hareketli ortalamasını kullanır. MetaTrader yerleşik ATR göstergesinde kullanıldığı gibi. Kitabındaki açıklamaya göre uygulanan varsayılan süre 14 yerine 7'dir. (Original text)
FREE

Piyasa izlemede bulunan tüm döviz çiftleri için eksik verileri indirir. EA'ları ve stratejileri geriye dönük test etmek ve tüm geçmişi tek tek indirmek yerine bir kerede indirmek için çok kullanışlıdır. Gösterge, seçilen döviz çiftleri için tüm geçmiş veriler indirilene kadar çalışacaktır. Göstergenin birden fazla seçeneği vardır: 1. Tek çift için verileri indirin 2. Yalnızca mevcut çift için indirin 3. Seçilen çiftler için indirme 4. Market saatindeki tüm çiftler için indirin
FREE

Ultimate Super Rejection Zones is a powerful MT4 indicator designed to detect accurate intraday reversal points using a combination of: Previous Day High & Low Midline equilibrium zone Rejection candle patterns Double-layer confirmation using two Stochastic filters Smart alert and arrow system Daily auto-reset filtering Optional trend filter using Moving Averages The indicator helps traders find high-probability reversal entries at premium and discount zones.
It automatically marks: ️ Sell Reje

Close All Profit Orders for MT4 script - closes absolutely all orders, whether pending or market ones.
Orders are closed at the current profit/loss indicators at the time of closing.
The script is suitable for moments when you need to quickly close all orders at the current indicators.
The script is very easy to use, just drag the script onto the chart and it will do its job.
Add me as a friend, I have many other useful products.
FREE

Trend Exploit The logic behind Trend Exploit EA is very simple but effective , the EA uses breakouts of the Bollinger Bands for entry and exit signals, enter in the market in the direction of a strong trend, after a reasonable correction is detected. The exit logic is also based on the Bollinger Bands indicator and it will close the trade even on a loss when the price breaks Bollinger Bands line.
Trend Exploit was strictly developed, tested and optimized using the "Reversed Sampling" devel
FREE

This indicator is designed to detect the best divergences between price/MACD and price/RSI. MACD and RSI produce by far the best divergence signals therefore this indicator focus on those two divergences. This is the FREE version of the indicator: https://www.mql5.com/en/market/product/28375
Important Information How you can maximize the potential of the scanner, please read here: www.mql5.com/en/blogs/post/718074
The free version works only on EURUSD and GBPUSD! This indicator scans for you u
FREE

The Four Pillars: Your All-in-One Trading Powerhouse! Tired of juggling multiple indicators and missing out on perfect entries? The Four Pillars is the ultimate solution, merging four proven market analysis tools into one powerful, easy-to-use indicator. Get crystal-clear, high-conviction Buy and Sell signals directly on your chart, filtered for maximum accuracy. Stop guessing and start trading with confidence! Key Advantages & Features Precision Signals, Zero Clutter: This indicator combines t
FREE

Indicator to be placed in the same folder as Dash to activate the alert filter with Heiken Aish. After downloading the indicator, copy it to the same folder so Dash can read the indicator. It is not necessary to insert it into the chart, this is only for Dash to search for signals and inform the direction of buying and selling of the Indicator. Check if the indicator's path is correct within Dash.
FREE

Indicator showing the breakout after at least X candles of the same sign, followed by an opposite candle. PARAMETERS: BARS TO SHOW = Story of Indicators (0 = all bars) Consecutive Bars for Breakout = How many Bars of the same direction and after a Bar with opposite direction Minimu Point between H/L = To consider a bar valid, she must have a Minimun Hi/Lw value Minimu Point between O/C = To consider a bar valid, she must have a Minimun Open/Close value Graphics are self-explanatory
FREE

just buy can only buy and do martingale which is calculated safely and can be controlled via the vps server you have, use safe settings What are your reasons for using EA? Has EA been backtested for the past 10 years? You know the Singgihgale system is the worst way of trading ever. A trader must trade like a sniper not a machine gunner. The EA robot with the minggihgale system will be destroyed when the price moves in one direction, for example an uptrend or downtrend when fundamental news rel
FREE

Идея индикатора очень проста и скорее всего пригодится тем, кто используют линейный график для технического анализа. Что-бы устранить "неровности" (-: линейного графика и был написан этот индикатор. Линия графика соединяет цены закрытия свечей, как и в классическом линейном графике, но игнорирует цены, которые шли в направлении линии и новый экстремум возникает только тогда, когда цена закрытия последней свечи явно ниже или выше предыдущего значения. Это облегчает визуальное восприятие при поиск
FREE

*Telegram'ı açıp arama çubuğuna '@BotFather' yazın. *Yeni bir bot oluşturmak için /başlat ve ardından /newbot girin *Botunuz için bir takma reklam ve bir kullanıcı adı bulun ( örneğin takma ad: "brand Signal" ve kullanıcı adı: BrandSignal_bot (kullanıcı adı 'bot' ile bitmelidir) *Sohbetten API token'ını seçin,token adresi (şuna benzer bir şey olacaktır 7754680911: ARDiKhESwAAEWHnT9B9bAXd-mEpI). Kaydedin. *Telegramda sinyal yayınlayacağınız bir kanal oluşturun ve oluşturduğunuz botu kanala yöneti
FREE
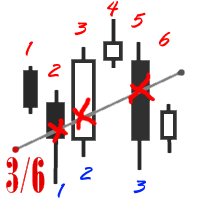
The utility simplifies the search for maximum bars accumulation levels. These levels can be used both for technical analysis and trading actions, like setting a stop loss or pending orders. Additional analytical methods are recommended for levels confirmation.
How it works Сounter mode (enabled by default). In the Сounter mode, draw a trend line on the chart and the utility will specify its length in bars as well as the number of bars the line crosses. When moving a trend line, the utility re-c
FREE

The indicator displays on a chart trading results. You can configure the color and font of displayed results, as well as filter trades based on the magic number. If multiple trades were closed within one bar of the current timeframe, the result is summed and output in one value.
Utility parameters Plot profit in - the format of output results: wither in deposit currency taking onto account commission and swap, or in points. Start from - start processing data at the specified time. Plot last dea
FREE

Wavetrend Oscillator Indicator — Version 1.0 The Wavetrend Oscillator is a momentum-based technical analysis tool. It is designed to highlight potential momentum shifts, areas that may be overbought or oversold, and the prevailing bias when confirmed by a higher timeframe filter. How it works WT1 and WT2 Lines : Crossovers between these lines are used to indicate changes in momentum. WT1 crossing above WT2 suggests bullish conditions. WT1 crossing below WT2 suggests bearish conditions. WT3 High
FREE

Informational indicator to aid in trading English and Russian version Balance Equity Drawdown Margin level Opened orders Spread Total profit Profit for today Profit for yesterday Profit for the week Profit for a month Detailed statistics for 5 pairs Detailed statistics on the current pair ATR MarginCall quote and distance to it Breakeven quote and distance to it Minimum margin level Maximum drawdown Maximum possible lot to open Displaying the breakeven line Displaying MarginCall and Stopout lin
FREE

<EA main logic>
1. EA reads candle pattern for most profitable of BUY & SELL.
2. If these pattern matches , then EA places the order.
3. If the order was closed with stoploss, then EA should stop trade on that day.
4. Next day EA will re-start again with increasing lot size to recover the loss.
<INPUT parameters> Slippage 3 pips MaxPosition 1 BaseLots 0,01 takeprofit 10pips stoploss 20pips Martingale True/False Max martingale 2 (times) Multiplier (lot size) 2,5
<Best pair & time frame>
FREE

MetaCOT 2 is a set of indicators and specialized utilities for the analysis of the U.S. Commodity Futures Trading Commission reports. Thanks to the reports issued by the Commission, it is possible to analyze the size and direction of the positions of the major market participants, which brings the long-term price prediction accuracy to a new higher-quality level, inaccessible to most traders. These indicators, related to the fundamental analysis, can also be used as an effective long-term filter
FREE

The Stochastic RSI (StochRSI) is a technical indicator that combines the characteristics of the Relative Strength Index (RSI) with the Stochastic Oscillator, resulting in a more sensitive tool that generates a higher number of trading signals. Developed by Tushar Chande and Stanley Kroll, the indicator was designed to overcome a perceived limitation of the traditional RSI: the low frequency of overbought and oversold levels activation (commonly 80 and 20), especially in less volatile assets. How
FREE

Telegram Signals Copier is a fully automated software that reads messages from Telegram and inserts them as orders on your MT4 terminal.
It comes with an advanced risk management tool, that can risk based on a % of your balance, fixed loss, and many other options.
You can fully customize how you take the signals, change the TP and SL level.
With an advanced analytics tool, you can see where your favorite signal providers are doing the most profit, and improve the profits even more.
Contact
FREE

Procyon is an automated Expert Advisor that uses the combination of the Ichimoku Kinko Hyo , Candle Patterns and a relatively new Reflex Indicators to identify Spinning Top Candles in Bullish or Bearish patterns. The EA has a hard, fixed Stop Loss and Take Profit. Even though the win rate is a little more than 50 percent, the SL is about half of the TP. So, you will have trades float in high positive sometimes. Recommended pairs and time frames are located in the Comment section.
FREE

️ Ultimate Account Protection for Serious Traders
The Equity Protector Pro is a professional-grade safety system that automatically safeguards your trading capital using advanced multi-level profit protection logic. Designed for traders using any strategy (manual or automated), this EA acts as your 24/7 risk manager to lock in gains and prevent account blowouts. Key Features:
3-Stage Protection System Level 1: Base equity floor protection Level 2: Dynamic trailing stop Level 3:
FREE

US SNIPER EA - FREE VERSION This EA is a single entry type which does not use dangerous strategies such as martingale, grid, averaging or other dangerous strategies. Using a measurable stop loss and take profit.
This EA Build with an AI which can measure risk by determine the StopLoss and Take Profit. We limit the maximum risk for 40pips so trader can set the lot size for maximum risk we can afford if hits for maximum StopLoss
BLACK FRIDAY SUPER DISCOUNT From Real Price $450 TO Only $99 Get
FREE

Professional Forex Advisor: Your Path to Stable Income on the Foreign Exchange Market All signals are managed by our advisors, details are disclosed only to existing clients - after purchasing/renting any product. https://www.mql5.com/en/users/robotstroi/seller Automation of trade on a new level We present to your attention an advanced solution for automated trading on the Forex market - an intelligent advisor developed by a team of professional traders and programmers. Key Benefits High precisi
FREE

This tool will remove buttons and text labels from the chart, after you remove Trading box Order management or Trading box Technical analysis. You just need to drag this tool to your chart and after cleanup of objects is finished, the tool will remove itself from the chart. Please check images below that present Before and After using the Removal tool. There is also a short YouTube video at the bottom to show how easy it is to clean your chart after using Trading box tools.
- input variable "R
FREE

This indicator will show week and monthhigh low, very useful to understand the market sentiment. To trade within the range/ break out. Low- can act as support- can used for pull back or break out High- can act as resistance- can used for pull back or break out Breakout strategy refers to the day trading technique that provides traders with multiple opportunities to go either long or short . The main idea is to identify the trend in its most juicy state followed by a trending move.
FREE

CurrencyStrength – Gerçek Zamanlı Döviz Gücü Sıralaması CurrencyStrength , sekiz ana döviz (USD, EUR, JPY, GBP, CHF, AUD, CAD, NZD) gücünü gerçek zamanlı olarak sayısallaştıran ve değişim oranlarına göre görsel bir sıralama olarak gösteren bir yardımcı EA'dır.
Her saniye döviz gücünü otomatik olarak görselleştirerek, hem manuel hem de otomatik işlemlerde döviz çifti seçimini ve işlem kararlarını önemli ölçüde iyileştirir. Başlıca Özellikler 8 ana dövizin gücünü gerçek zamanlı olarak hesaplar ve
FREE
The world of prop firm trading is one filled with tension and excitement in equal measure, and FTMO is definitely the most reputable firm out there. On one hand is the prospect of making huge sums of money and on the other, losing all the money you have invested. The easiest way of the latter scenario occurring is drawdown , and more often than not daily drawdown . It's what keeps us constantly checking our phones, the pain of every traders existence.
What if there was a way of making
FREE
The VR Orders History script is designed to upload a trade report to a csv file. This format is intended for additional analysis of trading history in programs such as EXCEL, Openoffice, and Libreoffice. Thanks to the script, it is now much easier for a trader to analyze their trading history. The program facilitates the analysis of the trading history for the MetaTrader 5 terminal. The trader sees structured trading. The entire report is based on the following principle: Position > Order on the
FREE

Простой советник основанный на сигналах индикатора Relative Strength Index (RSI) в зоне перекупленности - продаем, в перепроданности - покупаем. Моя версия всем известного "Dynamic". Я рекомендую использовать этот советник в полуавтомате.
Добавляйтесь в друзья, присылайте свои интересные стратегии. Возможно после обсуждения всех нюансов напишу советника бесплатно . Параметры: "_Slippage" - Проскальзывание; "_ Ma
FREE

The Scaled Awesome Oscillator (SAO) represents a refined adaptation of the Awesome Oscillator, aimed at establishing consistent benchmarks for identifying market edges. Unlike the standard Awesome Oscillator, which records the variation in pips across different commodities, the only unchanging reference point is the zero line. This limitation hampers investors and traders from pinpointing specific levels for trend reversals or continuations using the traditional Awesome Indicator, a creation of
FREE

Volatility under control. The indicator shows the optimal depth for setting goals within the day and on the average trend. It also builds pivot zones for the estimated correction depth. As an accompaniment, the key levels of the structure are displayed for several timeframes. Classical volatility indicators ATR & ADX on fixed timeframes are used for calculation. The calculation takes into account the spread, and if the market is slightly volatile, you will see a warning about the risk. You can c
FREE
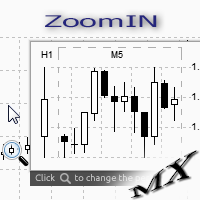
The ZoomIN indicator is designed for quickly viewing the selected bar on the smaller timeframes in a pop-up window. Once launched, the indicator works in the background, does not take up space on the chart and does not consume system resources. When the indicator is activated by the Shift + i combination (can be changed in the settings), a pop-up window with a chart of a smaller timeframe is created. The displayed timeframe can be changed by a left-click on the magnifying glass icon. To hide the
FREE

This is a tool to measure the velocity of the price. It's completely free, you can download and use. "Way: distance of price after one tick." "Speed: price velocity after one tick." p/s: The time for the price to jump 1 tick will not be fixed, you should know this. If Way > 0, the indicator will change color to Green If Way < 0, the indicator will change color to Red || I am a 3D artist and I love math and programming! ||
FREE

5/35 Oscillator to be used with our Elliott Wave Indicator as part of the overall strategy on trading the 5th wave. The Elliott Wave Indicator Suite is designed around a simple but effective Swing Trading Strategy. The Indicator Suite is great for Stocks, Futures and Forex trading on multiple timeframes You can find the main Elliott Wave Indicator here https://www.mql5.com/en/market/product/44034
FREE

This EA (Expert Advisor) is based on the logic of the ADX and utilizes the strength of trends as entry signals.
The most crucial factor here is the success rate of these entries.
By increasing the success rate, even with smaller profits for each individual trade, it becomes possible to accumulate substantial gains when trading across numerous currency pairs.
This EA primarily operates on longer timeframes because it makes it easier to determine whether the trend is upward or downward.
Addi
FREE

Supertrend Moving Average A combination of Supertrend and Moving Average to create a converging trade setup Input parameters: signal mode: set it to true if you want to plug it into STAT (Signal Tester and Trader) arrow shift: distance between fast EMA line to arrow on chart turn on price line filter turn on moving average signal for converging setup k period d period s period averaging method Moving average period Averaging method upper level limit (Stochastic) lower level limit (Stochastic)
FREE

Auto TP SL Manul Open Panding Orders Overview:
AUto TP SL Manul Open Panding Orders is an innovative trading platform designed to enhance trading efficiency and effectiveness in managing financial investments. Key Features: Automated Management : Seamlessly manage take-profit (TP) and stop-loss (SL) orders with our advanced automation tools. Manual Adjustments : Maintain control with manual options, allowing traders to adjust orders according to market conditions.
FREE
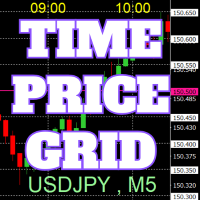
Grafikte, referansı kolaylaştırmak için tam sayılar üzerinde fiyat ve zaman çizelgeleri çizilir.
"Parametre Girişi" ile her periyot için fiyat aralıklarını ayarlamak mümkündür. Önemli sayılar için (yuvarlak sayılar) çizgiler diğer çizgilerden daha kalın ve daha belirgin olduğundan, bunları kolayca ayırt etmek mümkündür. Önemli sayılar için (yuvarlak sayılar) çizgiler diğer çizgilerden farklı bir renge ayarlanabilir. Çeşitli noktalardaki renkler bireysel olarak yapılandırılabilir. Simgeler ve za
FREE
Powered by SVX Strategies Quant Team This indicator is part of our internal toolkit for institutional volatility analysis. We are releasing it for free to support the retail trading community. Looking for Automated Results?
Manual execution is prone to human error. If you prefer consistent results managed by our team, you can copy our official algorithms directly on MQL5: Copy "Friday Pulse" (Conservative/Stable) Copy "SVX AI Systems" (High Growth) ABOUT ADAPTIVE RSI BANDS
Unlike traditional R
FREE

The Flag Streamer Pattern indicator is an indicator designed to find flag and pennant patterns. When the legend finds patterns, it draws lines on the graph screen. Magenta lines represent the streamer pattern. Aqua colored patterns represent the flag pattern. You can change the pattern colors according to your request. Our Popular Products Super Oscillator HC Cross Signal Super Cross Trend Strong Trend Super Signal Parameters fs- =======Channel Trend Setting===== Channel - Channel period setting
FREE
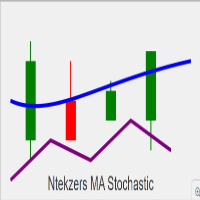
Please remember to leave a review for improvements thank you Overview of Key Functionalities: Buy Signal Conditions : The Stochastic Oscillator's main line crosses above the signal line. The closing price of the current candle is higher than the previous candle's close. The current closing price is above the EMA (Exponential Moving Average). The Stochastic value is below 50. When these conditions are met, a buy arrow is plotted, and alerts (audible or push notifications) are triggered. Sell Sign
FREE
UZFX - MetaTrader 4 (MT4) için Sadece Bekleyen Emirleri Sil komut dosyası, bekleyen tüm emirleri (Alış Limiti, Satış Limiti, Alış Durdurma, Satış Durdurma) işlem hesabından otomatik olarak kaldıran basit ama etkili bir araçtır. Bu komut dosyası, aktif piyasa pozisyonlarını etkilemeden bekleyen emirlerini anında temizlemek isteyen tüccarlar için idealdir.
Diğer tüm MT4/MT5 göstergelerime ve EA'larıma göz atın >> BURAYA
Özellikler: Bekleyen tüm emirleri (Alış Limiti, Satış Limiti, Alış Durdurma
FREE
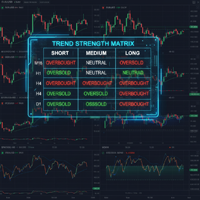
Powered by SVX Strategies Quant Team Tired of switching between charts? Trend Strength Matrix gives you an eagle-eye view of the market. This professional dashboard monitors the Adaptive RSI state across 4 key timeframes (M15, H1, H4, D1) simultaneously. Stop Monitoring, Start Automating
Watching a dashboard all day is exhausting. If you want the execution to be handled automatically by our systems, copy our official algorithms: Copy "Friday Pulse" (Conservative/Stable) Copy "SVX AI Systems" (H
FREE

BB Plus Driverは BB Plus !インジケータ をフルに活用していただくためのEAです。
すべての通貨ペア、タイムフレームで利用できます。BB Plus !インディケーターが無い場合は、ボリンジャーバンドにタッチしてからのリバウンドでエントリーするEAとして稼働します。 10年間のバックテストでは、BB Plus ! インジケータを使用しAUDCAD_M15およびGBPNZD_M5に適用した場合に最も良い結果が得られました。スクリーンショットをご覧ください EAとしての基本的な機能を装備しながら、わかりにくい設定を排除し、初心者の方でも簡単にご利用いただけます
BB Plus ! インジケータ は1分足から使える高精度のスキャルピング用逆張りサインツールです。
・すべての通貨ペア、時間足で利用でき、絶好のタイミングでのエントリー・チャンスをお知らせします ・ ボリンジャーバンドにタッチしてからの反転を 基本戦略とし、 独自のアルゴリズムを加えることで、精度の高い反転ポイントでサインを発信します ・勝敗判定機能により 直近の相場環境に対するこのインディケータの
FREE

This indicator determine price volatility using correlation between Price and Time. WARNING: Not suitable for 1M timeframe, you would not see any lines in this frame!
How to Use:
More closer the indicator's value to 0, the price is considered more volatile. When reversal is started, the indicator's value would be rise or fall significantly. During a strong trend, the indicator's value would be closer to 1 or -1, depends on current trend. Entry Signal:
BUY SIGNAL: Indicator crosses 0.2 from bel
FREE

EA Undead is fully automated bot to generate a stable profit from the volatile FOREX market. This EA will never depend on any indicator.
How this EA works? At the very first it will open a Buy order and Sell Order at same time. And by default take profit will be 15 Pips for all orders. Once take profit reaches it will Re-Open that order. If the market goes against any order than it will add more positions, by default 50 Pips away from last open trade. To minimize the draw-down and loss and to b
FREE
SK Stochastic Candle Moves EA based on Stochastic oscillator . It is used to generate overbought and oversold trading signals. Easy to use and Simple Max Drawdown protection No Martingale Recommended GBPUSD,EURUSD Timeframe M30,H1 others timeframes with the appropriate settings. Works for ECN/Non-ECN brokers and 2-3-4-5 digit symbols
A low latency vps is and an lower spread broker is always recommended. Support us by open My recommended broker. Exness Tickmill How its work ? Candles
FREE

The indicator is based on the materials taken from the book: Bill Williams. Trading Chaos: Applying Expert Techniques to Maximize Your Profit. The indicator values at the top of each bar are calculated based on the location of the Open and Close relative to a third of the bar. The bar is divided into three parts. The lower third of the bar is the number three (3), the middle third of the bar is the number two (2), the upper third of the bar is the number one (1). The first number in the indicato
FREE
Easy to use EA designed to auto trade. Works in every market condition. It uses reliable levels of MACD indicator combined with unique logic to perform fully automatic trading operations. *For MT5 version please go here! *If you don't like automated system and only need an alert system to help you in trading. Please check this arrow with alert system here!
FEATURES: Dangerous methods like martingale, hedge, grid or scalping are NOT used. Each position has Stop Loss and Take Profit. Positiona
FREE
Highly configurable Osma indicator.
Features: Highly customizable alert functions (at levels, crosses, direction changes via email, push, sound, popup) Multi timeframe ability Color customization (at levels, crosses, direction changes) Linear interpolation and histogram mode options Works on strategy tester in multi timeframe mode (at weekend without ticks also) Adjustable Levels Parameters:
Osma Timeframe: You can set the lower/higher timeframes for Osma. Osma Bar Shift: Y ou can set th
FREE

I came up with an idea for an EA, so let's put it in English.
Here's the logic:
First, wait for a candlestick to touch either the upper or lower Bollinger Band.
When it touches, don't enter immediately.
For a SELL entry, wait for the price to touch the upper band, then if the closing price moves inside the upper band, initiate the SELL order.
For a BUY entry, it's the opposite.
The default number of orders to hold simultaneously is set to 5.
In other words, all orders will close at a tota
FREE
MetaTrader mağazası, geliştiricilerin alım-satım uygulamalarını satabilecekleri basit ve kullanışlı bir sitedir.
Ürününüzü yayınlamanıza yardımcı olacağız ve size Mağaza için ürününüzün açıklamasını nasıl hazırlayacağınızı anlatacağız. Mağazadaki tüm uygulamalar şifreleme korumalıdır ve yalnızca alıcının bilgisayarında çalıştırılabilir. İllegal kopyalama yapılamaz.
Alım-satım fırsatlarını kaçırıyorsunuz:
- Ücretsiz alım-satım uygulamaları
- İşlem kopyalama için 8.000'den fazla sinyal
- Finansal piyasaları keşfetmek için ekonomik haberler
Kayıt
Giriş yap
Gizlilik ve Veri Koruma Politikasını ve MQL5.com Kullanım Şartlarını kabul edersiniz
Hesabınız yoksa, lütfen kaydolun
MQL5.com web sitesine giriş yapmak için çerezlerin kullanımına izin vermelisiniz.
Lütfen tarayıcınızda gerekli ayarı etkinleştirin, aksi takdirde giriş yapamazsınız.