VolumeXover

4

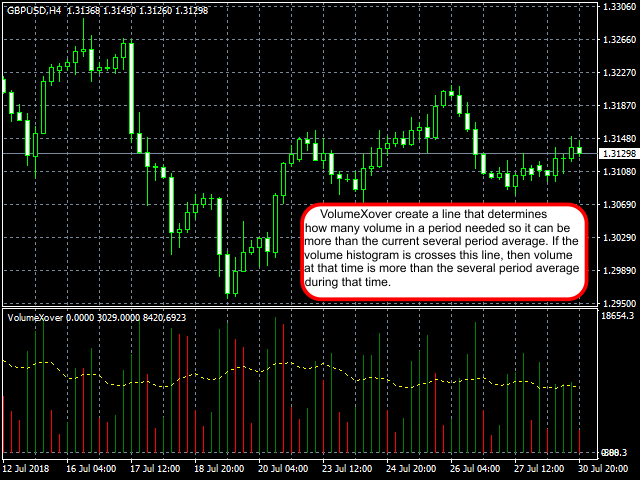
This indicator determines minimum volumes needed during a candle formed so that it would be higher than current volume's average. Although you can place MAs on your volume indicator, this indicator has non-repaint characteristic so you may not to worry about sudden volume increase. This indiator also draw volume indicator for its own.

Input Description:

  • period: Period used for indicator. Must be higher than 1.

Output Description:

  • VolumeXover: This indicator's main feature. During the time the volume indicator is higher than this line, the volume on that candle is higher than current volume's average. Depicted in dotted yellow line.
  • 2 Volume values: These are needed to draw volume histograms. Works like a MT4's default Volume indicator.
Değerlendirmeler 4
ema144
24
ema144 2022.05.12 08:29 
 

It's Great !!!!!!!!!!!

contactmargot
14
contactmargot 2020.03.15 22:41 
 

Nice indicator. Thank you,

Önerilen ürünler
Traditional MACD MT4
Daniel Lewis
4.58 (55)
MACD indicator in MetaTrader 4/5 looks different than MACD does in most other charting software. That is because the MetaTrader 4/5 version of MACD displays the MACD line as a histogram when it is traditionally displayed as a line. Additionally, the MetaTrader 4/5 version computes the Signal line using an SMA, while according to MACD definition it is supposed to be an EMA. The MetaTrader 4/5 version also does not compute a true MACD Histogram (the difference between the MACD/Signal lines). This
FREE
SC MTF Rsi MT4
Krisztian Kenedi
5 (1)
Çoklu zaman dilimi desteği, özelleştirilebilir görsel sinyaller ve yapılandırılabilir uyarı sistemi ile Göreceli Güç Endeksi (RSI) göstergesi. Freelance programlama hizmetleri, güncellemeler ve diğer TrueTL ürünleri MQL5 profilimde mevcuttur. Geri bildirim ve değerlendirmeleriniz çok değerlidir! RSI Nedir? Göreceli Güç Endeksi (RSI), fiyat değişikliklerinin hızını ve büyüklüğünü ölçen bir momentum osilatörüdür. Gösterge, belirli bir dönem boyunca son kazanımların büyüklüğünü son kayıplarla ka
FREE
Extremum Reverse Bar
Yurij Izyumov
2.8 (5)
This indicator has been created for finding the probable reversal points of the symbol price. A small candlestick reversal pattern is used it its operation in conjunction with a filter of extremums. The indicator is not redrawn! If the extremum filter is disabled, the indicator shows all points that have a pattern. If the extremum filter is enabled, the condition works – if the history Previous bars 1 candles back contains higher candles and they are farther than the Previous bars 2 candle, such
FREE
Enhanced Volume Profile: The Ultimate Order Flow & Liquidity Analysis Tool Overview Enhanced Volume Profile   is an indicator for MetaTrader 5 that displays the traded volume at specific price levels over a defined period. It separates the total volume into buy and sell components, presenting them as a side-by-side histogram on the chart. This allows users to observe the volume distribution and the proportion of buy and sell volumes at each price level. Graphics Rendering The indicator uses t
FREE
Please Good Review on this indicator, and i will maybe produce more indicators,  Coming soon, EA base on this indicators Linear Weighted Moving Average with HLCC applied price, and Bollinger bands with LWMA as applied price. Interesing Buy and Sell arrow based on this indicator , non Lag indicator as arrow will appear 1 candle after crossed...............
FREE
Hurst Buy and Sell Mt4
Victor Alfonso Molina Botello
Hurst Buy and Sell  This innovative indicator, inspired by xAI Grok intelligence, uses the Hurst exponent to identify the nature of the market and generate buy/sell signals. The EA for this indicator (Hurst Razer PRO EA MT5) is now available, you can see it by clicking here!  https://www.mql5.com/es/market/product/153441?source=Site+Profile+Seller  If you want more signals from the indicator, change the minimum number of bars between consecutive signals. The lower the value, the more signals it
FREE
SMA Indicator
Nitu Brijesh Yadav
Arrow Indicator (Buy/Sell Alerts) – Simple Yet Powerful Tool!             Product Version: 1.01           Indicator Type: Trend Reversal Signals           Timeframes Supported: All (Recommended: H1, H4, D1)           Key Features: Buy Signal: Green upward arrow () appears below the candle  Sell Signal : Red downward arrow () appears above the candle Accurate Trend Reversal Detection – Based on tried and tested SMA strategy. ️ Clean Chart View – Minimalist, non-i
FREE
Forex Piyasası Profili (kısaca FMP) Bu ne değildir: FMP, klasik harf kodlu TPO ekranı değildir, genel grafik veri profili hesaplamasını görüntülemez ve grafiği periyotlara bölmez ve hesaplamaz. Bu ne yapar : En önemlisi, FMP göstergesi, kullanıcı tanımlı spektrumun sol kenarı ile kullanıcı tanımlı spektrumun sağ kenarı arasında bulunan verileri işleyecektir. Kullanıcı, fare ile göstergenin her iki ucunu çekerek spektrumu tanımlayabilir. Göstergeler sağ kenar canlı çubuğa ve daha uzağa (gelec
FREE
Infinity'nin para birimlerinin gücünü ölçen bu yenilikçi gösterge, scalper'lar ve uzun vadeli ticaret yapan tüccarlar için vazgeçilmez bir yardımcıdır. Para birimlerinin Güç / zayıflık analiz sistemi uzun zamandır bilinmektedir ve dünyanın önde gelen tüccarları tarafından piyasada kullanılmaktadır. Herhangi bir arbitraj ticareti bu analiz olmadan tamamlanamaz. Göstergemiz, temel para birimlerinin birbirine göre gücünü kolayca belirler. Tüm para birimlerinde veya mevcut para birimlerinde çizgi g
FREE
SuperTrend V
Muhammad Hassaan
*This is TradingView indicator converted to mql4* The SuperTrend V indicator is a popular technical analysis tool used to identify trends and potential trend reversals in financial markets. It is based on the concept of the SuperTrend indicator but incorporates additional features and variations. The SuperTrend V indicator uses a combination of price action and volatility to determine the trend direction and generate trading signals. Here are the key components and features of the indicator: Ca
Trendline indicator
David Muriithi
2 (1)
Are you tired of drawing trendlines every time you're analyzing charts? Or perhaps you would like more consistency in your technical analysis. Then this is for you. This indicator will draw trend lines automatically when dropped on a chart. How it works Works similar to standard deviation channel found on mt4 and mt5. It has 2 parameters: 1. Starting Bar 2. Number of bars for calculation The   starting bar   is the bar which drawing of the trend lines will begin, while the   number of bars for c
FREE
Check my paid tools they work great and I share Ea's based on them for free please r ate The Dual Timeframe RSI (Relative Strength Index) indicator is a novel trading tool that allows traders to monitor RSI readings from two different timeframes on a single chart. This dual perspective enables traders to identify potential trend confirmations and divergences more effectively. For instance, a trader might use a 1-hour RSI alongside a daily RSI to ensure that short-term trades align with the broa
FREE
PZ Penta O MT4
PZ TRADING SLU
2.33 (3)
The Penta-O is a 6-point retracement harmonacci pattern which usually precedes big market movements. Penta-O patterns can expand and repaint quite a bit. To make things easier this indicator implements a twist: it waits for a donchian breakout in the right direction before signaling the trade. The end result is an otherwise repainting indicator with a very reliable trading signal. The donchian breakout period is entered as an input. [ Installation Guide | Update Guide | Troubleshooting | FAQ | A
FREE
Follow The Line
Oliver Gideon Amofa Appiah
3.94 (16)
FOLLOW THE LINE GET THE FULL VERSION HERE: https://www.mql5.com/en/market/product/36024 This indicator obeys the popular maxim that: "THE TREND IS YOUR FRIEND" It paints a GREEN line for BUY and also paints a RED line for SELL.  It gives alarms and alerts of all kinds. IT DOES NOT REPAINT and can be used for all currency pairs and timeframes. Yes, as easy and simple as that. Even a newbie can use it to make great and reliable trades. NB: For best results, get my other premium indicators for more
FREE
Discover the power of precision and efficiency in your trading with the " Super Auto Fibonacci " MT4 indicator. This cutting-edge tool is meticulously designed to enhance your technical analysis, providing you with invaluable insights to make informed trading decisions. Key Features: Automated Fibonacci Analysis: Say goodbye to the hassle of manual Fibonacci retracement and extension drawing. "Super Auto Fibonacci" instantly identifies and plots Fibonacci levels on your MT4 chart, saving you tim
FREE
Large Price MT4
Nino Guevara Ruwano
For traders, monitoring price movements is a constant activity, because each price movement determines the action that must be taken next. This simple indicator will helps traders to display prices more clearly in a larger size. Users can set the font size and choose the color that will be displayed on the chart. There are three color options that can be selected to be displayed on the chart.
FREE
Fiyat Dalga Modeli   MT4 --(ABCD Modeli)--   hoş geldiniz     ABCD modeli, teknik analiz dünyasında güçlü ve yaygın olarak kullanılan bir ticaret modelidir. Tüccarların piyasadaki potansiyel alım ve satım fırsatlarını belirlemek için kullandıkları uyumlu bir fiyat modelidir. ABCD modeliyle, tüccarlar potansiyel fiyat hareketlerini tahmin edebilir ve alım satımlara ne zaman girip çıkacakları konusunda bilinçli kararlar verebilir. EA Sürümü :   Price Wave EA MT4 MT5 sürümü:   Price Wave Patter
FREE
Colored Candles Demo
Alexander Nikolaev
5 (1)
The demo version of the Colored Candles indicator - calculates the parameters of each candle, as well as its volume. After that, it paints the candles depending on their strength and direction. Bullish candles are colored green and bearish candles - red. The greater the power of the bulls or the bears, the brighter the color. You can change the colors if you want. The indicator helps to analyze the price movement, as well as market entry points. The more accurate signals are formed on the higher
FREE
Head and Shoulders Pattern Indicator - Your Key to Recognizing Trend Reversals Unlock the power of pattern recognition with the "Head and Shoulders Pattern Indicator." This cutting-edge tool, designed for MetaTrader, is your trusted ally in identifying one of the most powerful chart patterns in technical analysis. Whether you're a novice or an experienced trader, this indicator simplifies the process of spotting the Head and Shoulders pattern, allowing you to make informed trading decisions. Key
FREE
The Moving Averages On-Off  let you  control the indicator  using  the keyboard  or a  button . You can choose if you want the indicator always shown or always hided while switching among different time frames or financial instruments . --->  This indicator is part of Combo Indicator OnOff It's possible to use three Moving Averages , defined as  Short ,  Medium ,  Long or Raimbow MA 5,10,20,50,100,200. Input MOVING AVERAGES You can customize the price type used for calculation : close, open
FREE
BoxInside MT4
Evgeny Shevtsov
4.83 (6)
This indicator calculates the volume profile and places labels that correspond to the VAH, VAL and POC levels, for each candle individually. Indicator operation features The indicator works on the timeframes from M5 to MN, but it uses the history data of smaller periods: M1 - for periods from M5 to H1, M5 - for the H4 period, M30 - for the D1 period, H4 - for the W1 period, D1 - for the MN period. The color and location of the VAL, VAH and POC labels on the current candle are considered to be c
FREE
Awesome Pivot Indicator
Komang Putra Riswanjaya
The Pivot Indicator is a vital tool for technical analysis used by traders in the financial markets. Designed to assist in identifying potential reversal points or trend changes, this indicator provides valuable insights into key levels in the market. Key features of the Pivot Indicator include: Automatic Calculations: The Pivot Indicator automatically calculates Pivot Point, Support, and Resistance levels based on the previous period's high, low, and close prices. This eliminates the complexity
FREE
TSO Stochastic RSI
Dionisis Nikolopoulos
4.25 (4)
Stochastic RSI makes a stochastic calculation on the RSI indicator. The Relative Strength Index (RSI) is a well known momentum oscillator that measures the speed and change of price movements, developed by J. Welles Wilder. Features Find overbought and oversold situations. Sound alert when overbought/oversold level is reached. Get email and/or push notification alerts when a signal is detected. The indicator is non-repainting. Returns buffer values for %K and %D to be used as part of an EA . (s
FREE
Rainbow MT4 is a technical indicator based on Moving average with period 34 and very easy to use. When price crosses above MA and MA changes color to green, it’s a signal to buy. When price crosses below MA and MA changes color to red, it’s a signal to sell. The Expert advisor ( Rainbow EA MT4) based on Rainbow MT4 indicator, as you can see in the short video below is now available here .
FREE
Cumulative Delta MT4
Evgeny Shevtsov
4.86 (29)
The indicator analyzes the volume scale and splits it into two components - seller volumes and buyer volumes, and also calculates the delta and cumulative delta. The indicator does not flicker or redraw, its calculation and plotting are performed fairly quickly, while using the data from the smaller (relative to the current) periods. The indicator operation modes can be switched using the Mode input variable: Buy - display only the buyer volumes. Sell - display only the seller volumes. BuySell -
FREE
Abiroid Multi Slope indicator allows you to calculate a Slope Histogram for any line of any indicator . Histogram is for 1 slope line only, but slope values can be calculated for 3 lines total. To have multiple histograms, add as many Slope indicators for custom indicators as you like on chart. You just need to provide the Indicator name, buffer value, slope's period and max number of bars back. By default it has slope calculation for TDI_v4.ex4 indicator. There is no way to specify parameters f
FREE
High Low Open Close MT4
Alexandre Borela
4.81 (21)
Bu projeyi seviyorsanız, 5 yıldız incelemesi bırakın. Bu gösterge açık, yüksek, düşük ve belirtilen fiyatlar için çizer Dönem ve belirli bir zaman bölgesi için ayarlanabilir. Bunlar birçok kurumsal ve profesyonel tarafından görünen önemli seviyelerdir. tüccarlar ve daha fazla olabileceği yerleri bilmeniz için yararlı olabilir Aktif. Mevcut dönemler şunlardır: Önceki gün. Önceki Hafta. Önceki Ay. Previous Quarter. Önceki yıl. Veya: Mevcut gün. Hafta. Şimdi Ay. Şimdiki Mahallesi. Bugün yıl.
FREE
The Auto Fibonacci Indicator is a professional technical analysis tool that automatically draws Fibonacci retracement levels based on the most recent closed Daily (D1) or 4-Hour (H4) candle. These levels are widely used by traders to identify key support , resistance , and trend reversal zones . This version is designed for manual trading and supports a powerful trading strategy using Fibonacci levels combined with a 50-period EMA (Exponential Moving Average) , which you can easily add from MT4
FREE
MACD stopper x2 free
Andrii Malakhov
4 (1)
The MACD_stopper_x2 indicator shows where the trend has a tendency to stop or reverse. It uses the standard MACD indicator and a proprietary formula for processing data obtained from MACD. There are 2 types of stop/reversal signals: Small cross - probability of a trend stop/reversal is 70-80%; Large cross - probability of a trend stop/reversal is 80-80%; If there are open trades (for example, BUY) on the symbol the indicator is attached to, and the BUY trend ends, the indicator sends push notifi
FREE
Panelux
Andrei Gerasimenko
Panelux - информационная панель показывающая актуальную информацию для трейдера, такую как: Номер торгового аккаунта и торговое плечо; Символ, период, последнюю цену, время до закрытия бара и спред; Отдельный блок для мани менеджмента; Данные свопа инструмента; Блок информации о депозите, балансе, профите, позициях, equity и margin; Блок о прибылях и убытках за год, квартал, месяц, неделю и по последним пяти дням. Имеется опция для включения отображения совершенных сделок на графике цены. Что уд
FREE
Bu ürünün alıcıları ayrıca şunları da satın alıyor
Gann Made Easy
Oleg Rodin
4.83 (160)
Gann Made Easy , bay teorisini kullanarak ticaretin en iyi ilkelerine dayanan, profesyonel ve kullanımı kolay bir Forex ticaret sistemidir. WD Gann. Gösterge, Zararı Durdur ve Kâr Al Seviyeleri dahil olmak üzere doğru SATIN AL ve SAT sinyalleri sağlar. PUSH bildirimlerini kullanarak hareket halindeyken bile işlem yapabilirsiniz. Satın alma işleminden sonra, alım satım talimatlarını ve harika ek göstergeleri ücretsiz olarak almak için lütfen benimle iletişime geçin! Muhtemelen Gann ticaret yöntem
M1 Sniper
Oleg Rodin
5 (21)
M1 SNIPER kullanımı kolay bir işlem göstergesi sistemidir. M1 zaman dilimi için tasarlanmış bir ok göstergesidir. Gösterge, M1 zaman diliminde scalping için bağımsız bir sistem olarak kullanılabilir ve mevcut işlem sisteminizin bir parçası olarak kullanılabilir. Bu işlem sistemi özellikle M1'de işlem yapmak için tasarlanmış olsa da, diğer zaman dilimleriyle de kullanılabilir. Başlangıçta bu yöntemi XAUUSD ve BTCUSD ticareti için tasarladım. Ancak bu yöntemi diğer piyasalarda işlem yaparken de ya
Scalper Inside PRO
Alexey Minkov
4.74 (69)
12% OFF EASTER SALE An exclusive indicator that utilizes an innovative algorithm to swiftly and accurately determine the market trend. The indicator automatically calculates opening, closing, and profit levels, providing detailed trading statistics. With these features, you can choose the most appropriate trading instrument for the current market conditions. Additionally, you can easily integrate your own arrow indicators into Scalper Inside Pro to quickly evaluate their statistics and profitabi
Market Makers
Mohamed Hassan
5 (3)
After purchase, contact me privately to receive 1 month of free testing with EA Forex Proton! This advanced MT4 trading robot automatically executes signals from any MT4 indicator, including Market Makers. The latest version also includes AI integration, allowing each trade signal to be analyzed using Artificial Intelligence. Live Signal with EA Forex Proton: Click here Market Makers is a powerful price action trading system designed to identify high-probability Buy and Sell opportunities based
Trend Screener
STE S.S.COMPANY
4.79 (95)
Trend Göstergesi, Trend Alım Satım ve Filtreleme için Çığır Açan Benzersiz Çözüm, Tüm Önemli Trend Özellikleriyle Tek Bir Araç İçinde Yerleştirildi! Forex, emtialar, kripto para birimleri, endeksler ve hisse senetleri gibi tüm sembollerde/araçlarda kullanılabilen %100 yeniden boyamayan çoklu zaman çerçevesi ve Çoklu para birimi göstergesidir. SINIRLI SÜRELİ TEKLİF: Destek ve Direnç Tarama Göstergesi sadece 50$ ve ömür boyu mevcuttur. (Orijinal fiyat 250$) (teklif uzatıldı) Trend Screener, grafik
Atomic Analyst
Issam Kassas
5 (4)
Öncelikle belirtmek gerekir ki bu Ticaret Göstergesi Yeniden Çizim Yapmaz, Gecikmez ve Gecikme Göstermez, bu da hem manuel hem de robot ticareti için ideal hale getirir. Kullanıcı kılavuzu: ayarlar, girişler ve strateji. Atom Analisti, Piyasada Daha İyi Bir Avantaj Bulmak İçin Fiyatın Gücünü ve Momentumunu Kullanan PA Fiyat Hareketi Göstergesidir. Gürültüleri ve Yanlış Sinyalleri Kaldırmaya ve Ticaret Potansiyelini Artırmaya Yardımcı Olan Gelişmiş Filtrelerle Donatılmıştır. Birden fazla katman
Ultimate Sniper Dashboard
Hispraise Chinedum Abraham
4.82 (22)
İndirimli fiyatı 299$! Fiyatlar gelecekte artabilir! Aşağıdaki açıklamayı okuyun! Ultimate Sniper Dashboard için En İyi Giriş Sistemi: NIHAI DINAMIK SEVIYELER. (Lütfen Ürünlerimi Kontrol Edin) Ultimate Sniper Dashboard, MT4 çoklu para birimi test limitleri nedeniyle SADECE canlı piyasalarda çalışır. Ultimate-Sniper Dashboard ile tanışın! Hem HA-Sniper hem de MA-Sniper içeren en iyimiz. ve birçok özel mod. Ultimate Sniper Dashboard mutlak bir canavar! Herhangi bir Acemi veya Uzman Tüccar için
Super Signal – Skyblade Edition Profesyonel No-Repaint / Gecikmesiz Trend Sinyal Sistemi, Olağanüstü Kazanma Oranı ile | MT4 / MT5 için 1 dakika, 5 dakika ve 15 dakika gibi daha düşük zaman dilimlerinde en iyi şekilde çalışır. Temel Özellikler: Super Signal – Skyblade Edition, özellikle trend bazlı işlemler için geliştirilmiş akıllı bir sinyal sistemidir. Yalnızca güçlü, yönlü ve gerçek momentum destekli piyasa hareketlerini tespit etmek amacıyla çok katmanlı bir filtreleme yapısı kullanır. Bu s
Trend indicator AI
Ramil Minniakhmetov
4.53 (83)
Trend Ai göstergesi, trend tanımlamasını işlem yapılabilir giriş noktaları ve geri dönüş uyarılarıyla birleştirerek bir yatırımcının piyasa analizini geliştirecek harika bir araçtır. Bu gösterge, kullanıcıların forex piyasasının karmaşıklıklarında güvenle ve hassasiyetle yol almalarını sağlar. Birincil sinyallerin ötesinde, Trend Ai göstergesi geri çekilmeler veya düzeltmeler sırasında ortaya çıkan ikincil giriş noktalarını belirleyerek, yatırımcıların belirlenen trend içindeki fiyat düzeltmele
Sizlere ON Trade Waves Patterns Harmonic Elliot Wolfe'u tanıtmaktan mutluluk duyarız. Bu, manuel ve otomatik yöntemleri kullanarak piyasada çeşitli desenleri tespit etmek için tasarlanmış gelişmiş bir göstergedir. İşte nasıl çalıştığı: Harmonik Desenler: Bu gösterge, grafiğinizde görünen harmonik desenleri tanımlayabilir. Bu desenler, Scott Carney'in "Harmonic Trading vol 1 & 2" adlı kitabında açıklandığı gibi harmonik ticaret teorisini uygulayan tüccarlar için önemlidir. Onları manuel olarak ç
" Dynamic Scalper System " göstergesi, trend dalgaları içinde işlem yapmak için scalping yöntemi için tasarlanmıştır. Başlıca döviz çiftleri ve altın üzerinde test edilmiştir, diğer işlem araçlarıyla uyumluluğu mümkündür. Ek fiyat hareketi desteğiyle trend boyunca pozisyonların kısa vadeli açılması için sinyaller sağlar. Göstergenin prensibi. Büyük oklar trend yönünü belirler. Küçük oklar şeklinde scalping için sinyaller üreten bir algoritma trend dalgaları içinde çalışır. Kırmızı oklar yüksel
PRO Renko Sistemi, RENKO grafikleri ticareti için özel olarak tasarlanmış son derece hassas bir ticaret sistemidir. Bu, çeşitli ticaret araçlarına uygulanabilen evrensel bir sistemdir. Sistemi etkin piyasa sana doğru ters sinyallerine erişim hakkı denilen ses nötralize eder. Göstergenin kullanımı çok kolaydır ve sinyal üretiminden sorumlu tek bir parametreye sahiptir. Aracı, seçtiğiniz herhangi bir ticaret aracına ve renko çubuğunun boyutuna kolayca uyarlayabilirsiniz. Yazılımımla karlı bir
TPSpro RFI Levels
Roman Podpora
4.86 (28)
TALİMATLAR RUS  /  TALİMATLAR   ENG  /  Sürüm MT5 Ana fonksiyonları: Satıcı ve alıcıların aktif bölgelerini görüntüler! Gösterge, satın alma ve satışlar için tüm doğru ilk dürtü seviyelerini/bölgelerini görüntüler. Giriş noktaları arayışının başladığı bu seviyeler/bölgeler etkinleştirildiğinde, seviyeler renk değiştirir ve belirli renklerle doldurulur. Ayrıca, durumun daha sezgisel bir şekilde algılanması için oklar görünür. LOGIC AI - Bir şablonu etkinleştirirken giriş noktalarını aramak için
BTMM State Engine Pro is a MetaTrader 4 indicator for traders who use the Beat The Market Maker approach: Asian session context, kill zone timing, level progression, peak formation detection, and a multi-pair scanner from a single chart. It combines cycle state logic with a built-in scanner dashboard so you do not need the same tool on many charts at once. What it does Draws the Asian session range; session times can follow broker server offset or be set in inputs. Tracks level progression (L
ŞU ANDA %40INDIRIMLI Yeni Başlayanlar veya Uzman Tüccarlar için En İyi Çözüm! Bu Gösterge benzersiz, yüksek kaliteli ve uygun fiyatlı bir ticaret aracıdır çünkü bir dizi tescilli özellik ve yeni bir formül ekledik. Sadece BİR grafik ile 28 Forex çifti için Döviz Gücünü okuyabilirsiniz! Yeni bir trendin veya scalping fırsatının tam tetik noktasını belirleyebildiğiniz için ticaretinizin nasıl gelişeceğini hayal edin? Kullanım kılavuzu: buraya tıklayın Bu ilk olan, orijinal! Değersiz bir özent
Easy Breakout
Mohamed Hassan
4.71 (14)
After your purchase, feel free to contact me for more details on how to receive a bonus indicator called VFI, which pairs perfectly with Easy Breakout for enhanced confluence!    Easy Breakout is a powerful price action trading system built on one of the most popular and widely trusted strategies among traders: the Breakout strategy ! This indicator delivers crystal-clear Buy and Sell signals based on breakouts from key support and resistance zones. Unlike typical breakout indicators, it levera
Volatility Trend System - girişler için sinyaller veren bir ticaret sistemi. Oynaklık sistemi, trend yönünde doğrusal ve noktasal sinyaller ve ayrıca yeniden çizme ve gecikme olmaksızın trendden çıkmak için sinyaller verir. Trend göstergesi, orta vadeli trendin yönünü izler, yönünü ve değişimini gösterir. Sinyal göstergesi volatilitedeki değişikliklere dayalıdır ve piyasa girişlerini gösterir. Gösterge, çeşitli uyarı türleri ile donatılmıştır. Çeşitli alım satım araçlarına ve zaman dilimlerine
Trend Lines PRO
Roman Podpora
5 (1)
TREND ÇİZGİLERİ PRO     Piyasanın gerçek yön değişimini anlamaya yardımcı olur. Gösterge, gerçek trend dönüşlerini ve büyük oyuncuların piyasaya yeniden girdiği noktaları gösterir. Anlıyorsun     BOS hatları  Daha yüksek zaman dilimlerindeki trend değişiklikleri ve önemli seviyeler, karmaşık ayarlar veya gereksiz gürültü olmadan gösterilir. Sinyaller yeniden çizilmez ve çubuk kapandıktan sonra grafikte kalır. VERSION MT 5     -    RFI LEVELS PRO  göstergesiyle birlikte kullanıldığında maksimum p
GOLD Impulse with Alert
Bernhard Schweigert
4.67 (12)
Bu gösterge, 2 ürünümüz Advanced Currency IMPULSE with ALERT  +   Currency Strength Exotics  'in süper bir kombinasyonudur. Tüm zaman dilimleri için çalışır ve 8 ana para birimi artı bir Sembol için grafiksel olarak güç veya zayıflık dürtüsünü gösterir! Bu Gösterge, Altın, Egzotik Çiftler, Emtialar, Endeksler veya Vadeli İşlemler gibi herhangi bir sembol için para birimi gücü ivmesini göstermek için uzmanlaşmıştır. Türünün ilk örneğidir, Altın, Gümüş, Petrol, DAX, US30, MXN, TRY, CNH vb. içi
Order Block Hunter
Noha Mohamed Fathy Younes Badr
5 (10)
Order block hunter indicator is the best indicator for  hunt the order blocks that area where there has been a large concentration of limit orders waiting to be executed Order blocks are identified on a chart by observing previous price action and looking for areas where the price experienced significant movement or sudden changes in direction .This indicator does that for you by using very complicated codes and helps you to take the best areas To buy and sell because it make marks at the best a
Advanced Supply Demand
Bernhard Schweigert
4.91 (299)
Özel Ticaret –%40 İndirim Yeni Başlayanlar veya Uzman Yatırımcılar İçin En İyi Çözüm! Bu gösterge, bir dizi özel özellik ve yeni bir formül içerdiği için benzersiz, yüksek kaliteli ve uygun fiyatlı bir işlem aracıdır. Bu güncelleme ile çift zaman dilimi bölgeleri gösterebileceksiniz. Sadece daha yüksek bir zaman dilimini değil, hem grafik zaman dilimini hem de daha yüksek zaman dilimini gösterebileceksiniz: İÇ İÇE GEÇMİŞ BÖLGELER GÖSTERİYOR. Tüm Arz Talep yatırımcıları buna bayılacak. :) Önem
- Real price is 80$ - 40% Discount (It is 49$ now) Contact me for instruction, add group and any questions! - Non-repaint - I just sell my products in Elif Kaya profile, any other websites are stolen old versions, So no any new updates or support. - Lifetime update free Related product:   Bitcoin Expert Introduction The breakout and retest strategy is traded support and resistance levels. it involves price breaking through a previous level.  The break and retest strategy is designed to help tr
KT Gaussian Trend Filter MT4
KEENBASE SOFTWARE SOLUTIONS
KT Gaussian Trend Filter, Gauss filtresi ile doğrusal regresyon yumuşatmasını birleştirerek net ve doğru bir trend analizi sunar. Takibi kolay alım ve satım sinyalleri üretirken, piyasanın uzun vadeli yönünü etkili bir şekilde vurgular. Özellikler Tamamen özelleştirilebilir Gauss filtresi: Uzunluk ve kutup ayarlarını değiştirerek yumuşatma hassasiyetini optimize edebilir, trend netliğini artırabilirsiniz. Doğrusal regresyon desteği: Gauss yumuşatmasını daha da geliştirerek piyasa oynaklığından
Special offer : ALL TOOLS , just $35 each! New tools   will be   $30   for the   first week   or the   first 3 purchases !  Trading Tools Channel on MQL5 : Join my MQL5 channel to update the latest news from me Volumetrik Sipariş Blokları Çoklu Zaman Çerçevesi göstergesi, önemli piyasa katılımcılarının siparişleri biriktirdiği kilit fiyat bölgelerini belirleyerek piyasa davranışına daha derin bir içgörü arayan tüccarlar için tasarlanmış güçlü bir araçtır. Bu bölgeler, Volumetrik Sipariş Bloklar
Route Lines Prices - fiyat yönlerini bulmak için tasarlanmış bir göstergedir. Basit arayüzü, fiyat davranışı ve gelecekteki yön hesaplamaları için birden fazla algoritma içerir. Bu algoritmalar, kullanılan zaman dilimlerine bağlı olarak volatilite hesaplamalarını ve fiyat düzeltmesini içerir. Gösterge, " Calculating price values " değerini değiştirmek için tek bir parametreye sahiptir. Varsayılan 1 değeri, dengeli bir otomatik hesaplama sağlar, bu da göstergeyi manuel olarak yapılandırmadan kul
Şu anda %40 İNDİRİMLİ! Herhangi bir Acemi veya Uzman Tüccar için En İyi Çözüm! Bu gösterge paneli yazılımı 28 döviz çifti üzerinde çalışıyor. Ana göstergelerimizden 2'sine (Gelişmiş Para Birimi Gücü 28 ve Gelişmiş Para Birimi Dürtüsü) dayanmaktadır. Tüm Forex piyasasına harika bir genel bakış sağlar. Gelişmiş Para Birimi Gücü değerlerini, para birimi hareket hızını ve tüm (9) zaman dilimlerinde 28 Forex çifti için sinyalleri gösterir. Trendleri ve / veya scalping fırsatlarını belirlemek için
Stratos Pali
Michela Russo
4.43 (7)
Stratos Pali Indicator   is a revolutionary tool designed to enhance your trading strategy by accurately identifying market trends. This sophisticated indicator uses a unique algorithm to generate a complete histogram, which records when the trend is Long or Short. When a trend reversal occurs, an arrow appears, indicating the new direction of the trend. Important Information Revealed Leave a review and contact me via mql5 message to receive My Top 5 set files for Stratos Pali at no cost! Dow
Bu, bir mumun kapanış fiyatını tahmin eden bir göstergedir. Gösterge öncelikle D1 çizelgelerinde kullanılmak üzere tasarlanmıştır. Bu gösterge hem geleneksel forex ticareti hem de ikili opsiyon ticareti için uygundur. Gösterge, bağımsız bir ticaret sistemi olarak kullanılabilir veya mevcut ticaret sisteminize ek olarak hareket edebilir. Bu gösterge, mevcut mumu analiz ederek mumun gövdesi içindeki belirli güç faktörlerini ve önceki mumun parametrelerini hesaplar. Böylece gösterge, piyasa hareket
Volumatic Fair Value Gaps   is a precision-engineered indicator for identifying, analyzing, and visualizing   Fair Value Gaps (FVGs)   backed by volume intelligence. This tool goes beyond standard FVG plotting by dissecting volume dynamics inside each gap using   lower-timeframe sampling , offering clear insight into whether bulls or bears dominate the imbalance. Designed for technical traders, this indicator overlays high-probability gaps only, visualizes   bullish vs. bearish volume compositio
Scalper Vault
Oleg Rodin
5 (36)
Scalper Vault , başarılı bir scalping için ihtiyacınız olan her şeyi size sağlayan profesyonel bir scalping sistemidir. Bu gösterge, forex ve ikili opsiyon tüccarları tarafından kullanılabilecek eksiksiz bir ticaret sistemidir. Önerilen zaman çerçevesi M5'tir. Sistem size trend yönünde doğru ok sinyalleri sağlar. Ayrıca size üst ve alt sinyaller ve Gann piyasa seviyeleri sağlar. Göstergeler, PUSH bildirimleri dahil her türlü uyarıyı sağlar. Göstergeyi satın aldıktan sonra lütfen benimle iletişim
Yazarın diğer ürünleri
Keltner Channel MT4
Muhammad Robith
4.71 (7)
Keltner Channel is a well known indicator that not in MT4's indicators default lineup (You can get this from your broker somehow). This indicator helps you to define trend and sometimes overbought/oversold prices during flat trend. Input Description: EMAperiod: Moving Average period used for indicator. Must be higher than 1. ATRperiod: Average True Range period used for indicator. Must be higher than 1. multiplier: Multiplier used for determine channel's wide. Must be higher than 0 but may not b
FREE
BWMACDsignal
Muhammad Robith
5 (1)
This indicator mostly inspired from BW-ZoneTrade custom indicator from MT5. How To Use: BUY when both dots colored Green. SELL when both dots colored Red. In addition to original one, MACD-OsMA-generated signal also can be drawn. Input Description: MA_period_short: Faster EMA period for MACD. Applied when drawMACD is true. MA_period_long: Slower EMA period for MACD. Applied when drawMACD is true. MACDperiod: MA period for MACD. Applied when drawMACD is true. drawMACD: When true, draw an additi
FREE
BuySell Volume
Muhammad Robith
5 (3)
BuySell Volume is an indicator that approximates Buy and Sell volumes based on price movement. Input Description: applied_model: Choose the applied model. In low reversal mode, price is considered receive low bearish pressure during bullish candle's creation (high bearish pressure on high reversal model. In other words, Bullish Marubozu candles has really high Buy Volumes in low reversal model than in high reversal one. Output Description: Buy and Sell Volume: Determines how many Buy and Sell vo
FREE
This indicator helps you to find overbought and oversold prices based on William %R. Input Description: Wperiod: Period for %R indicator. OverBoughtLevel: Define the overbought level for %R. Must in between 0 and -50. OverSoldLevel: Define the oversold level for %R. Must in between -50 and -100. middle_value: When true, indicator also draw the middle points between upper and lower line. shift: Set an additional offset to the indicator. Several Notes: Set 0 and -100 as Overbought and Oversold lev
FREE
PriceXover
Muhammad Robith
This indicator maps price crossover with Simple Moving Average (SMA) for each candle. Works like a SMA but has non-repaint characteristic. How to Use: As stated before, this indicator works like a SMA. Use this to determine trend. When price is above this line then the uptrend is expected (downtrend if price below the line). 2 of these indicator (with different periods) can also generate buy/sell signal like 2 SMAs. When the lower period SMA crosses higher period SMA from below, then buy signal
FREE
Triple EMA
Muhammad Robith
4 (3)
Triple Exponential Moving Average Technical Indicator (TEMA) was developed by Patrick Mulloy and published in the "Technical Analysis of Stocks & Commodities" magazine. It works as the same as EMA. However, it provides smaller lags, even compared to Double EMA. Input Description: period: MA's period. Must be higher than 1. applied_price: Define the price to be applied. Use 1 of these integers. 0 -> applied_price is Close price 1 Open price 2 High price 3 Low price 4 Median price 5 Typical price
FREE
Double EMA
Muhammad Robith
5 (1)
Double Exponential Moving Average (DEMA) is a well-known trend indicator. DEMA was developed by Patrick Mulloy and published in February 1994 in the "Technical Analysis of Stocks & Commodities" magazine. It is used for smoothing price series and is applied directly on a price chart of a financial security. Besides, it can be used for smoothing values of other indicators. The advantage of this indicator is that it eliminates false signals at the saw-toothed price movement and allows saving a posi
FREE
SMAconfirm
Muhammad Robith
This indicator helps you to comfirm SMAs' crossovers by draw a signal line that determines SMA movement direction. when Short SMA cross above Long SMA and Close price is above the signal several bars later, then uptrend is expected. when Short SMA cross below Long SMA and Close price is below the signal several bars later, then downtrend is expected. Input Description :  MA_Period_short: Short-term SMA's period. Used for short-term PriceX. Must be higher than 1.  MA_Period_long: Long-term SMA's
FREE
This indicator determine price volatility using correlation between Price and Time. WARNING: Not suitable for 1M timeframe, you would not see any lines in this frame! How to Use: More closer the indicator's value to 0, the price is considered more volatile. When reversal is started, the indicator's value would be rise or fall significantly. During a strong trend, the indicator's value would be closer to 1 or -1, depends on current trend. Entry Signal: BUY SIGNAL: Indicator crosses 0.2 from bel
FREE
MACDXover
Muhammad Robith
This indicator helps you to find price that may cause MACD Signal crossover on the current bar.. These crossover points are depicted in form of stars (like Parabolic SAR). prevEMA line also helps you to decide the trend. Get 20% OFF for rents for 1 year! How to use: MACDSignalStars (Violet) stars displayed are the the prices that make the MACDmain = MACDsignal. If the close price is higher than the star, then MACDmain > MACD signal. If the close price is lower than the star, then MACDmain < MA
Are you using Awesome Oscillator? Wonder at which High and Low prices this indicator colored Green? Red? This indicator helps you determine those limits. GET 20% OFF for renting for 1 year! Yellow line is called Upper Line, and Red line is Lower Line. BUY SIGNAL In this case, last bar's AO color would be colored Green. Both Open and Low Price above the Lower Line. Close price crosses the Upper Line from below. SELL SIGNAL In this case, last bar's AO color would be colored Red. Both Open and Hig
Filtrele:
Bobkiesa
34
Bobkiesa 2022.11.02 03:23 
 

I have been using a horizontal trend line for years to gauge the stronger activity by volme. Since I applied this one and found it followed in a similer manner. But the VXover actualy calculates it over the set periods we can choose. Much better than my gues work. I trade the 4H TF and so set the VXover to 12 being 2 days data. Very nice and acurate for the current trend.

ema144
24
ema144 2022.05.12 08:29 
 

It's Great !!!!!!!!!!!

ekmql
194
ekmql 2021.06.26 20:18 
 

I don't know how it works, I should have an alert to the cell phone with a configurable level

contactmargot
14
contactmargot 2020.03.15 22:41 
 

Nice indicator. Thank you,

Değerlendirmeye yanıt