适用于MetaTrader 4的EA交易和指标 - 52

The Expert Advisor builds a grid of orders, defining inputs by built-in setups. After accumulating the profit specified in the settings, it closes the remaining orders to breakeven. Open “breakout” orders create a grid according to the trend, and each separately “trailing” order allows you to maximize profit from the market. Please see all my products: https://www.mql5.com/en/users/en_coding/seller
Benefits: a unique algorithm for constructing a grid of orders, eliminating the minimum delta be
FREE

' Amen ' is a simple EA (Expert Advisor), a Forex Trading System (Robot) that uses price action confirmed by an indicator. It can be used on any time frame, but preferably on H1.
Parameters: FixLotSize : This is the fixed Lot Size to open trade with. UseAutoLotSize : If this is 1(Yes), the EA will calculate the Lot Size, ignoring the FixLotSize. MaximumPercentRisk : The percentage risk that should be used to calculate Lot Size if UseAutoLotSize is 1 (i.e. Yes). MaximumTradeableSpread : If Sprea
FREE

Note: This is a Limited Edition of Lion Grid . It works only on Mondays.
The trading strategy has been been created by using machine learning algorithms to build a model directly from the historical data. Machine learning is an application of artificial intelligence (AI) that provides the ability to automatically learn and improve from experience without being explicitly programmed. The strategic focus of this robot is to identify trend reversals by analyzing multiple technical indicators (
FREE

TwoMA Crosses indicator displays arrows based on whether the short term moving average crosses above or below the long term moving average. A moving average doesn't predict price direction. Instead, it defines the current direction. Despite this, investors use moving averages to filter out the noise. Traders and investors tend to use the EMA indicator, especially in a highly volatile market because it’s more sensitive to price changes than the SMA.
Download for FREE TwoMA Crosses EA from the
FREE

Индикатор "Buy Sell zones x2" основан на принципе "остановка/разворот после сильного движения". Поэтому, как только обнаруживается сильное безоткатное движение, сразу после остановки - рисуется зона покупок/продаж. Зоны отрабатывают красиво. Или цена ретестит зону и улетает в космос, или пробивает зону насквозь и зона отрабатывается с другой стороны так же красиво. Работает на всех таймфреймах.
Лучше всего выглядит и отрабатывает на Н1.
Может использоваться как: индикатор зон, где лучше вс
FREE
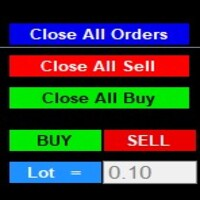
After purchase : - Please contact me at telegram https://t.me/SmartForex777 This Smart Dashboard Penal Very Easy , Fast And Accurate to Enter And Exit Trade Manually... Unique features Close All Orders... Close All Sell... Close All Buy... Buy / Sell... Lot Size Change Option... Works on any account type and broker... Works with all times frames and currency...
FREE

TrendFinder VolumeI are Colored candlesticks showing the trend based on Volume and Slope of Trend
This indicator will give you the color change on the next bar on the confirmation candle and will never repaint Lime Green = Possible Buy (Volume up), Teal Green = Bullish Weak (Volume Decreasing), Red = Possible Sell (Volume up) , Orange = Bearish Weak (Volume Decreasing)
TrendFinder Volume is optimize to trade on any market and to be used trending and None trending markets. For best results use
FREE

PartialAutoClose EA 是一款可对手动或自主交易开仓的持仓进行半自动、灵活管理的实用型EA。
【主要功能】 - 提供两种自动平仓逻辑可选: 可根据Heikin Ashi颜色变化或均线交叉自动平仓。 - 自动设置保本止损 达到设定利润后,止损会自动移到开仓价(或用户自定义水平)。 - 支持分批平仓或一次性全部平仓 出现平仓信号时,可选择仅平掉一半仓位(分批平仓)或全部平仓。 - 支持多持仓管理 可同时监控和管理同一图表下的多个持仓。 - 无需magic number,最适合人工/手动交易 无需magic number管理,自动管理所有手动或其他EA下的持仓。
【适合人群】 - 希望自动化管理人工建仓的平仓操作的交易者 - 希望在趋势反转或指标信号时只平部分利润的用户 - 需要自动设置保本止损且以手动建仓为主的交易者 - 想半自动化实现多持仓盈利与风险管理的用户
【参数示例】 - 平仓逻辑类型:Heikin Ashi或均线交叉 - 启用分批平仓 - 触发保本止损的利润(点) - ……以及更多自定义参数
【注意事项】 - 本E
FREE

This EA is a free version of Tiger Grid which is available here: https://www.mql5.com/en/market/product/33835
Tiger Grid EA is an expert advisor using trading strategy which has been developed by using machine learning concepts. It has passed 14 years of backtest of real tick data and real variable spread (with commission) from 2004 to 2018. The entries are usually accurate and in case if the trend signal has a delay the positions will be managed by a smart grid system. This system uses a gr
FREE

突破趋势 是为剥头皮者和日内交易者准备的指标。指标在图表上以实时模式选择并显示趋势级别。指标反应价格动量: 它在动量幅度超过指定参数里设置的阀值之时,开始搜索趋势。此指标当价格越过当前的趋势线时,还可以播放声音。在正常模式, 此指标只显示一条 (最后发现的) 上行和一条下行趋势线, 但在高级模式 - 以前检测到的趋势线依旧在图表上绘制。 注意 突破趋势 指标不会产生完整的决定。它只做脏活,显示出可能的选项。交易者应该做出决定。
指标参数: ExtMode - 启用/禁止高级模式; Sound - 启用/禁止 当价格与趋势线交叉时声音通知; UTColor - 设置上行趋势线颜色; DTColor - 设置下行趋势线颜色; HistoryDepth - 设置使用历史的深度, 0 - 整个历史; Rank - 设置搜索等级; PulseThr - 设置动量振幅阀值点数。
FREE

TMA Classic – 三角移动平均指标简介 TMA Classic 是一款非常简洁且轻量的指标,采用 三角移动平均(Triangular Moving Average) 以一条平滑的线条显示。它能够有效滤除过多的噪音,捕捉价格的中心趋势,有助于判断趋势方向及区间震荡。 由于仅显示单线,该指标在图表上具有很高的可视性,不会与其他指标或蜡烛图价格数据发生冲突。 主要特点 实时显示三角移动平均线,平滑且连贯 抗短期噪音干扰,直观展现趋势流动 设计简洁轻便,适合同时监控多个货币对及时间周期 可作为趋势判断的辅助工具,帮助筛选入场时机 计算原理详解 三角移动平均(TMA)是通过对简单移动平均(SMA)进行二次平滑计算得到的。该方法生成的曲线比单一SMA更平滑,有效过滤随机短期波动,更清晰反映价格整体走势。 定义 TMA(n) = SMA( SMA(Close, n), n ) 参数 n:周期(例如20)
Close:收盘价(可根据需要修改)
SMA:简单移动平均 在交易中,价格位于TMA线之上时通常代表上涨趋势,位于下方时代表下跌趋势,可作为趋势方向和强度的参考。 参数设置 参数名 说明
FREE

This trend scanner indicator is using two main indicators to identify trends. Frist the EMAs to provide a view on Bullish / Bearish momentum. When the shorter EMA (calculated off more recent price action) crosses, or is above, the slower moving EMA (calculated off a longer period of price action), it suggests that the market is in an uptrend. Second the Stochastic RSI, When RSI is < 20 it is considered oversold, and when > 80 it is overbought. These conditions suggests that momentum is very str
FREE

Индикатор "INFO Spread Swaзp Info Panel" для MT4, вспомогательный инструмент для торговли.
- Индикатор показывает текущий спред и свопы валютной пары, к которой он прикреплен. Также идикатор показывает: 1. Дату и время сервера 2. Название сервера 3. Название влютной пары. 4. Спред 5. Своп 6. Открытые позиции 7. Отложенные ордера 8. Максимальная просадка после открытия индикатора 9. 30% от депозита. (можно менять) Можно менять положение, размер, цвет шрифта, расстояние между строками.
FREE

В основе индикатора TDI лежат следующие индикаторы: RSI, Moving Average, Bollinger bands, но основным из них нужно выделить RSI, весь расчет индикатора завязан от его значений.
Зеленая линия (линия RSI) – сглаженные простой (по умолчанию) скользящей средней значения индикатора RSI, период сглаживания 2.
Красная линия (сигнальная линия) – сглаженные простой (по умолчанию) скользящей средней значения индикатора RSI, период сглаживания 7.
Синие линии – индикатор Bollinger bands по умолчанию пери
FREE
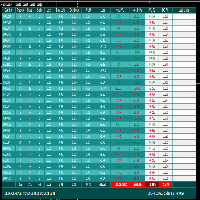
FCK Trade Report This indicator was developed by Fx Candle King. BEFORE CHOOSE CUSTOM PERIOD, GO TO TERMINAL WINDOW (ctrl+T), right click on ACCOUNT HISTORY and CHOOSE ALL HISTORY. This report searches the filtered data in your ACCOUNT CURRENT & HISTORY TRADE, Select your timespan for the report open and closed trades etc... Chose the report type - List only OPEN orders / List only CLOSED orders / List both OPEN and CLOSED orders
FREE

Supp & Resist Every Trader Need that an Indicator will show you zones for weak, Untested, Verified, Proven and Reversal Support and Resistance with smart calculation. take a look for the Screenshots there some explanations. i don't want to talk a lot :) try it by yourself for FREE because everything is clear in the inputs parameters. If you have any question feel free to ask me.
FREE

EA Protrader Pivot is a automate and semi-automate Expert Advisor based on candlestick charts. Each order set stop loss with 200points and take profit 250 points. If one of two orders reach stop loss the new order open with new lot size (start lot is 0.01 and max lot is 0.08 ). This EA was backtested with XAUUSD in time frame M15 and spread 20 point. Automate - EA open buy and sell orders based on levels of candlestick chart with the first volume is 0.01 if this order touch stop loss EA cont
FREE
Highly configurable Osma indicator.
Features: Highly customizable alert functions (at levels, crosses, direction changes via email, push, sound, popup) Multi timeframe ability Color customization (at levels, crosses, direction changes) Linear interpolation and histogram mode options Works on strategy tester in multi timeframe mode (at weekend without ticks also) Adjustable Levels Parameters:
Osma Timeframe: You can set the lower/higher timeframes for Osma. Osma Bar Shift: Y ou can set th
FREE

Bamboo expert 4 is based on the custom indicator Bamboo 4 . Entry points are determined using Bamboo 4 values. Positions are closed when reaching specified profit and loss levels or when opposite signal appears if Stop Loss and Take Profit values are zero. Input Parameters Period - Period parameter of the indicator Bamboo 4; Mode - operation mode of the Expert Advisor (0-7); Stop Loss - loss fixing level in points; Take Profit - profit fixing levels in points; Lot - lot size; Magic Number - "mag
FREE

Use my recommended broker: https://icmarkets.com/?camp=61478 You have most likely heard about the term "Less is more". I can tell you one thing that's also the case with the Monkey CCI on Bollinger indicator! One indicator will give you the best of both worlds, easy to determine trend, the strength of the trend and overbought and oversold levels. This indicator is very simple to follow: Green line uptrend Red line downtrend Above band overbought Below band oversold With this indicator you cou
FREE

NEW VERSION of Gemini: Changes with signal combinations, SL/TP values and amount of pairs and TF’s available. Please make sure you download V 1.1 and ONLY use set files for each pair and TF given! Signal has been updated with this new version. Gemini is a complex Expert Advisor that uses Awesome Oscillator closing bar price, ATR Ranges and Bar Pattern combinations for opening trades with managing and closing trades based on Bollinger Band Width Ratio’s. Though the algorithms are consta
FREE

Summary This indicator is based on the MA applied to the Momentum indicator. It draws arrows at the confirmed crosses of the MA over the Momentum line. When the MA crosses upwards, then a buy arrow is displayed and vice versa. The arrows do not repaint since the indicator only uses confirmed values and waits for the candle to close before painting an arrow. The indicator is also able to alert when arrows appear. There are 3 types of alerts - Popup, Email and Mobile Push Notifications.
Inputs Al
FREE
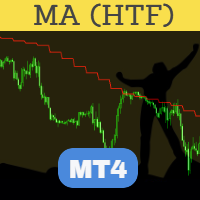
完善的 MA(移动平均线)HTF(更高时间框架)可能是最先进和最可靠的 HTF 指标。该指标在执行方面进行了高度优化,带有 MT4 平台提供的 MA 指标的标准设置。 “将指标放在图表上,任何时间范围。您可以在指标输入中选择更高的时间范围。同一指标可以在图表上多次使用,以从多个时间范围或不同的 MA 值绘制 MA。 一个必备工具,用于在现有图表上以较低时间范围覆盖较高时间范围的 MA。 “不使用给他们的工具的人只会伤害自己。” “我们塑造了我们的工具,然后我们的工具塑造了我们。”
主要特征 高度优化: 也许是目前最快的 MA HTF 指标。只更新新出现的蜡烛,不更新过去的蜡烛。过滤在 MT4 中收到的重复报价。仅此功能就使其非常适合在 VPS 上运行。 更新运行蜡烛: 一些 EA 不需要读取运行蜡烛 [0] 值。因此忽略它的情况可以在 VPS 上节省良好的价值 CPU 周期。这是另一个有助于优化的功能。 错误检查 :指标覆盖来自更高时间或当前时间框架的 MA。如果我们错误地将图表的时间范围切换到比指标中选择的时间范围更高的时间范围以进行叠加,它将切换到当前时间范围。 标准移动平均线的
FREE
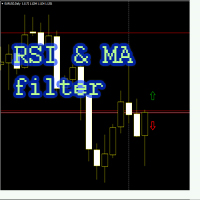
Советник "RSI and MA filter" торгует по индикатору RSI, использует фильтр в качестве двух средних скользящих (быстрая MA выше медленной MA - покупка, продажа - наоборот), по желанию Пользователя применяется мартингейл (количество умножения лота при серии убытков ограничивается), безубыток, трейлинг стоп, инвертирование сигнала. Настройки советника: Индикатор RSI: RSI_Period = 14; используемый период индикатора
RSI_Shift = 1; номер свечи выбранного графика, с которой советник берет сигнал, 0 -ор
FREE

Easy to use, fully automated neural network trading robot. Works on the H1 timeframe with two currency pairs (AUDCAD, USDCAD). Limitations of the free version - only two currency pairs support (7 in the full version) and 0.01 lots max order size.
Minimal recommended deposit size: with grid enabled - $150 per symbol; with grid disabled - $100 for all symbols.
Parameters Instruments - currency pairs to trade; Order size calc method - type of the calculation of the order size; Fixed order size -
FREE

Prop Trader's Guardian: The Ultimate Risk Manager
(Product for MetaTrader 4)
Protect your capital and secure your funded account with the Prop Trader's Guardian. This is not just another drawdown checker; it's an account-level circuit breaker designed specifically for the strict rules of proprietary trading firms. When your daily limit is hit, it doesn't just close trades—it locks down your entire terminal to prevent any further activity until the next trading day.
The Prop Firm Trader's Dil

SimpleCandleTrader MT4 EA SimpleCandleTrader MT4 EA is an Expert Advisor for the MetaTrader 4 platform that opens trades on each new candle based on the direction of the previous one. Trading logic: If the previous candle was bullish (close > open), the EA opens a Buy order. If the previous candle was bearish (close < open), it opens a Sell order. Each new position automatically closes the previous one, ensuring that only one trade is active at any time. ️ Input Parameters: LotSize — fixed l
FREE

This is a simple Bollinger Band EA This works by activating a trade whenever the input parameters are met, including the Bollinger Band parameters The Bollinger Band Parameters determines when a buy or sell trade is opened: If the price is outside the lower bounds of the activated bollinger bands, a buy trade is opened (given that all other criteria are met) If the price is outside the upper bounds of the activated bollinger bands, a selltrade is opened (given that all other criteria are met)
K
FREE
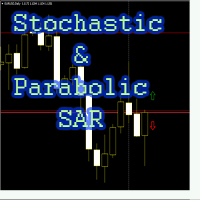
Советник "Stochastic and Parabolic SAR" торгует по индикатору Stochastic Oscillator, используя фильтр в качестве индикатора Parabolic SAR,
по желанию Пользователя применяется мартингейл (количество умножения лота при серии убытков ограничивается), безубыток, трейлинг стоп, инвертирование сигнала, возможно настроить, как скальпирующий советник.
Для каждого валютного инструмента необходимо подбирать настройки.
Настройки советника: Индикатор Stochastic Oscillator: Kperiod=5; период линии K Dpe
FREE
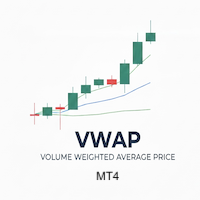
Buy 1 Get 1 Free Key Features and Advantages of VWAP 1. It Shows the "True Price" or "Consensus Price" This is its most important feature. While a Simple Moving Average (MA) gives equal weight to every price, VWAP tells us what the average price really is, based on where the majority of money (volume) agreed to trade. Example: If the price of 100 had 1,000,000 shares traded, but the price of 101 only had 100 shares traded... VWAP will give significantly more weight to the 100 price. 2. It

This Dashboard is free to download but is dependent on you owning the Flag Trend Pro MT4 indicator. Down load the indicator: Flag Trend Pro
The Dashboard will show you on a single chart all the timeframes (M1 to Monthly) with their own status for the indicator: Gold Pro MT4
all time frame and all symbol: smart algorithm detects the trend, filters out market noise and gives entry signals!!!
How to understand the status: symbol - Fill All the Pair what you want. M1, M5, M15,M3
FREE

Free TrendLine EA opens trades whenever the price on the chart interacts with or crosses your trend line. You simply draw the trend line manually then let the EA do the trading automatically according to the rules you give it. The settings available in the EA are explained below: Lots : The lot size for trading. RiskPercentage : Set a value other than zero to activate lot sizing by use of percentage of margin. TrendLineName: The name of the line to track. You can either * rename the trend line t
FREE

After purchasing Dash Supply Demand, download "Connect Supply Demand" for free, which will be the information link that will fuel your Dash. "Connect Supply Demand" will be the information fuel that will carry data to your Dash. Don't forget that it must be in the same folder as your Dash! You can confirm the path to it through the indicator window! If you have any questions, we'll be happy to assist you!
FREE

FastTMALine_mth_PRT is non-redrawn channel indicator and can be used to identify trend and support and resistance levels.
Indicator settings allow you to assign a specific coefficient to each price channel, which makes it possible to narrow or expand each channel separately. The FastTMALine_mth_PRT indicator is a multicurrency instrument, so the choice of a timeframe depends solely on the trader’s preference. FastTMALine_mth_PRT indicator can be used on any time frame, so you can eas
FREE

It is the main indicator of Turtle Trading Strategy. It provides an excellent advantage for following the trend. It gives a signal to enter the transaction in channel breaks. A sell position is opened when the 20-period lower channel breaks, and a buy position is opened when the upper channel breaks. 2 ATR should be used as the stoploss level. The R-R ratio should be at least 1/2. You can reach the maximum profit opportunity by following the 10-period middle level. Recommended INPUT: 20 Period
FREE

Certainly! A candlestick pattern EA is an Expert Advisor that automates the process of identifying specific candlestick patterns on a price chart and making trading decisions based on those patterns. Candlestick patterns are formed by one or more candles on a chart and are used by traders to analyze price movements and make trading decisions. EA likely scans the price chart for predefined candlestick patterns such as the Hammer, Inverted Hammer, Three White Soldiers, and Evening Star. When it
FREE

Quante volte ti è capitato di aver bisogno di avere a grafico i livelli chiave di una candela chiusa del time frame precedente? Con PastProjection potrai far disegnare i livelli di Apertura, Chiusura, Massimo e Minimo della candela chiusa al time frame superiore scelto. I livelli sono spesso importanti e diventano supporti o resistenze, o entrambi. La prima volta che vengono raggiunti spesso fanno reagire la quotazione. I pattern su questi livelli sono spesso più efficaci. Tali livelli sono sign
FREE

TriadStrategiesFx-полностью автоматический эксперт с тремя стратегиями. Каждая стратегия работает отдельно.Для переключения стратегий необходимо изменить параметры советника в окне настроек. По умолчанию TriadStrategiesFx работает по классическому мартингейлу, локированием убыточного ордера.Как правило, закрытие всех ордеров происходит по совокупной прибыли после выхода из флетового коридора, после чего начинается новый цикл.
Вторая стратегия, предусмотренная в эксперте, также является кла
FREE

Uses of EA - Trailingstop: Move stoploss continuously. - Breakeven: Move the stoploss once. Custom parameters: All OrderOpenTime: + true: acts on all order + false: only affect the order opened since EA run All OrderType: + true: acts on all order. + false: only the order is running (Buy, Sell) TraillingStop: true (Use), false (do not use) TrailingStop Save (Point) TraililngStop Distance (Point) BreakEven: true (Use), false (do not use) BreakEven Save (Point) Brea
FREE
This tool will allow you to export candles data (Open, High, Low, Close, Volume) for any financial instrument present in your MetaTrader 4. You can download the data of multiple Symbols and TimeFrames in the same csv file at once. You can schedule the frequency, simply choose the refresh interval (1 minute minimum, if 0 then the extraction will be done once) and the tool will do the work. No need to open a lot of charts in order to get the last sync, the tool will download the data directly. The
FREE

The indicator calculates the average price velocity over the specified time period. It is known that the trading time flows unevenly, in bursts. It either goes faster, or slows down. This indicator will tell if the trading time has accelerated and it is necessary to go to the smaller timeframes to search for trade signals.
Usage Alert is generated when the price velocity exceeds the specified threshold. The threshold value can be modified using the buttons on the information panel. A .wav file
FREE

<LOGIC> EA will place order based on the original logic. This EA should work with take profit and stoploss. Default TP is 50pips and SL is 50pips.
If the order was closed with stoploss, EA will stop in that day. Next day, EA will restart and trade again with lot size increasing. Lot size and volume multiple is changeable in the parameters.
<Best Pair and TF> EURUSD and GBPUSD TF H1
<Default set> Already optimized
TP 50pips SL 50pips Martingale Volume muti X 2 Max martingale 5
FREE

This is a gamble Expert Advisor!!
It will open randomly trades on markets which are in your watchlist (left). You select how much you will risk. It uses the compound interest effect. Example: Starting with $10 1. Trade + $10 -> $20 2. Trade + $20 -> $40 3. Trade + $40 -> $80 4. Trade + $80 -> $160 5. Trade + $160 -> $320 6. Trade + $320 -> $640 .. and so on! If you reach the 17th trade sucessfully, you have over 1 Million Dollar!! (Starting with $10)
It risks max. 90% of your money stake, to
FREE

TimeBar TimeBar 是一個簡單的資訊指示器,顯示柱關閉之前的剩餘時間,以及柱打開以來經過的時間和當前時間。 為了便於感知,增加了兩種顯示方式:以圖形左上角註釋的形式,或以圖形物件的形式。
優點 字體選擇 字體大小。 您可以設定任何一項。 評論的時候太小了 您可以移動物體。 雙擊滑鼠可以選擇任何時間並移動到圖表上的任何位置,它將照常繼續更新 視覺警報。 您可以設定指定的秒數,直到目前柱關閉,達到該時間後,時間將變成設定中指定的警告顏色 設定 選擇顯示的時間 每次的顏色(對於圖形物件) 一則警報,通知您酒吧即將關閉 使用 TimeBar 指標作為您交易系統的補充
使用連結嘗試我在市場上的其他產品 https://www.mql5.com/ru/users/capitalplus/seller
FREE
Dominate the Market with the Laguerre Edge Signal Indicator! Stop guessing and start trading with confidence! Our Laguerre Edge Indicator is your ultimate tool for spotting high-probability entry points. This indicator combines the power of two classic analysis methods— moving averages for trend direction and the Laguerre RSI for pinpointing reversals —all filtered by the solid EMA 200 trend line . It's designed to give you clear, objective signals directly on your chart. Key Features and Adva
FREE

This versions is free because a dangerous strategy is used.
If you want to see my full and best product (not dangerous), check it out : https://www.mql5.com/en/market/product/82662
I'm sharing with you a scalping strategy who is designed especially on GBPNZD timeframe M5 . Scalping GBPNZD is a scalper who is not spread sensitive. Scalping GBPNZD 's backtest is around 70% of winrate. Scalping GBPNZD is very easy to use. Scalping GBPNZD is using a dangerous strategy. Scalping GBPNZD is a
FREE

BreakEven PRO line – Instantly visualize your breakeven point Have you ever wondered exactly where your open trades would reach breakeven — no profit, no loss?
BreakEven PRO line is a visual indicator created for traders managing multiple positions. It automatically displays a horizontal line at the average breakeven price for your open BUY and SELL orders, clearly labeled with the live value on your chart. Perfect for hedging strategies , risk management , or simply maintaining precise control
FREE

Introducing IT Divergence EA, your ultimate ally in maximizing profits across financial markets. Our Expert Advisor (EA) leverages the potent MACD and RSI indicators to automate trading with unparalleled accuracy.
Key Features :
Divergence Detection Strategy : IT Divergence EA is built on a robust strategy that harnesses the power of MACD and RSI indicators to spot divergences in the markets. Divergences serve as powerful signals for identifying potential buy or sell opportunities. Intellig
FREE

Please note this is a Free version and will only work on EURUSD pair. If you like this product please buy the full EA (FXA Local Trade Copier Pro). FXA LTC is a trade copier for MT4 terminal. This is a fantastic tool for coping trades from one MT4 terminal to many others running on the same PC/VPS. It is extremely easy to setup with minimal settings you can be coping trades in minutes. FXA LTC also caters for Brokers that use different symbol names. FXA LTC will copy trades in 0.5 seconds or le
FREE

熊猫振荡器是一个新的作者的指标设计为倒卖.
一个指示器,根据一系列标准和专有工具的读数给出信号。
熊猫振荡器的主要特点: 分析函数
它可以在任何货币对和时间框架上使用; 指标不重绘; 这是其他指标的一个很好的补充; 图形功能
占据图表上最小数量的位置; 柔性酊剂; 简单易学; 熊猫振荡器组成。..
蓝线是RSI指标; 橙色线是基于T3RSI的综合RSI指标; 虚线是布林带的边界;(见图)。 6) 蓝线是布林带的中线; 熊猫振荡器的主要特点
有一组用于过滤的指示器; 指标本身显示何时需要进入市场;
熊猫振荡器的基本设置: RSI周期-设置RSI的蓝线;
波段周期-虚线的调整;
MA周期-设置移动平均线;
波段偏差-波段偏差;
波段移位-波段移位;
熊猫振荡器在交易中的使用:
进入市场的信号是在建立在T3RSI上的综合RSI离开布林带时形成的。 可以使用T3RSI与布林带中线的交点。
进入位置是在相应颜色的直方图的第一条出现之后进行的:蓝色-进入买入,红色-进入卖出。
从该位置退出是在将直方图的条调零后进行的
FREE

A flexible 2-Line MACD indicator The default MACD indicator inside MT4, limits you to using the MACD with a fast-EMA, slow-EMA, and signal-SMA. This MACD indicator allows you to set your own MA-Method choices for these 3 components, separately! You can select from SMA-EMA-SMMA-LWMA, and can even use a separate method for each 3 fast-slow-signal periods. A more featured version is available with colored candles+conditions, full alerts+conditions, line coloring, DEMA and TEMA options; MACD MAX
Fe
FREE
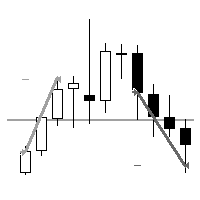
"AV Level EA" is an Expert Advisor for the MetaTrader 4, which is intended exclusively for the german DAX (DE40, GE40, etc.) and is also available as a free version with MinLot to try out.
NEW: More ways to close, third entry.
Strategy:
- Level Trading, DAX M15 (also M5 or M30)
- Entry: Buy level 75, sell level 25
- Exits: TP = 25 (i.e. approx. 00 level) or TP = 50 (buy 75 level, sell 25 level)
- Second entry in the event of a reset, distance e.g. 25 or 50 (it does not take place with 0)
FREE
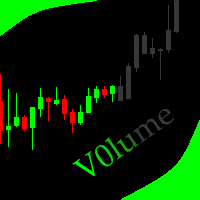
This indicator allows to hide Volume (on all MT4 timeframes) from a date define by the user with a vertical line (Alone) or a panel (with "Hidden Candles"). The color of each bar depends if this one is higher or lower of the previous bar. Indicator Inputs: No inputs for this indicator Information on "Volume" indicator is available in this post: https://www.mql5.com/en/forum/134260 ************************************************************* Hey traders!! Give me your feeds! We are a commun
FREE

The TMA Centered Bands indicator for MT4 draws bands on the chart and reports the overall price trend, as well as gives arrows signals to buy and sell when the bar closes outside the channel.
Unlike many TMAs, our version uses the calculation part of the algorithm without redrawing, and also adds the ability to select a symbol. The bands are made up of moving averages, and each of them has an MA period. The name TMA comes from triangular moving averages, as the indicator draws triangular bands
FREE

The MACD_stopper_x2 indicator shows where the trend has a tendency to stop or reverse. It uses the standard MACD indicator and a proprietary formula for processing data obtained from MACD. There are 2 types of stop/reversal signals: Small cross - probability of a trend stop/reversal is 70-80%; Large cross - probability of a trend stop/reversal is 80-80%; If there are open trades (for example, BUY) on the symbol the indicator is attached to, and the BUY trend ends, the indicator sends push notifi
FREE

The LexusBO indicator is recommended for trading binary options . Signals are generated when the RSI, ADX, CCI indicators cross the customizable levels. The indicator displays signals using "up/down" arrows on the chart. Their values are available in the buffer arrays (buffer with index 0 - "up" arrow, with index 1 - "down" arrow). This makes the indicator easy to use for automated trading through specialized Expert Advisors. The recommended timeframe is M5. The indicator has a built-in counter
FREE

TrendExpert Indicator Overview
The TrendExpert indicator is designed to identify and visualize trend zones in financial markets. It utilizes zigzag high and low points to determine support and resistance levels, providing insights into potential market reversals and continuation patterns.
Features - Detection of support and resistance zones based on price action. - Strength categorization (Proven, Verified, Untested, Turncoat, Weak) based on historical testing. - Adjustable parameters for z
FREE

Hm(水平标记)专为水平水平的手动标记而设计。 标记包含级别及其价格值。 线的厚度和颜色以及价格值在设置中设置。 水平可以放置在本地的时间框架,或公开设置所有的时间框架。
他的工作很简单:
1)–按你在设置中设置的键来标记级别;
2)-我们将线路带到所需的位置;
3)–点击鼠标右键和水平链接。
在未来,这些水平可以移动和调整。
从图表中移除后,指标不会自行清理水平。 他们将不得不手动删除。
最有效的应用是一次在所选交易工具上使用具有不同设置的多个HMS。
输入:
线条样式-线条样式
线宽-线厚
标记样式-价格标签的大小
标记偏移(像素)-相对于屏幕左边缘的标记偏移
线条颜色-线条和标签的颜色
单独的时间帧-显示在单独的时间帧上,或显示在所有时间帧上
标记热键-设置级别的键
FREE

这是一个交易辅助工具箱,并不是全自动交易的机器人 W10 系统请保持 100%的缩放比,如果超过这个值。按钮内的字体将超出按钮边框 常规: 一键下单、一键挂单、一键反手,自动设置止盈止损。 一键平仓、一键平多单(空单)、一键删除挂单。 一键反手、一键锁单、设置自动追踪止损。 根据画线追踪止损 非农: 消息突破单,可在非农或者其他重大消息时使用,在消息行情爆发前在当前价格上方 挂BUYSTOP,下方挂SELLSTOP。订单自动设置止盈止损。 划线下单: 支持最多四根做多趋势线或者做空趋势线并存。价格到达趋势线自动开单。 支持每根下单趋势线设置不同的仓位。 每根下单趋势线可以设置不同的止损趋势线、止盈趋势线。 支持止损止盈趋势线进行止损止盈追踪移动。 支持趋势线的“时效性”,如果价格运行到开单(止损、止盈)趋势线的右方仍未订单成交,则价格将永远不会接触到趋势线,策略失效。如需要请延长趋势线 杂项: 支持历史订单轨迹显示,可在图表显示历史记录中所有订单的下单轨迹,显示开仓价、平仓价、单量。 支持实时点差显示 支持平台信息显示,杠杆,一个点的价值,一手保证金,仓息,是否支持EA等等
FREE

Sweeper PRO – 高级蜡烛扫荡检测器 (三合一) 概述 Sweeper PRO 是一款功能强大且完全可自定义的指标,用于检测三种独特的蜡烛扫荡类型——这是专业价格行为交易者常用的智能入场与反转模式。
它能自动识别潜在的 假突破、流动性吸收 和 延续信号 ,帮助您预测市场反转并确认强劲的方向性走势。
使用 Sweeper PRO ,您可以清晰、即时地可视化市场结构变化和基于蜡烛的反应——无需手动监控图表。 ️ 功能特点 检测三种扫荡类型: 单蜡烛、双蜡烛、同向扫荡 颜色、箭头及蜡烛逻辑完全可自定义 可单独启用或禁用每种检测模式 自动删除旧箭头,保持图表整洁 可调节箭头大小及扫描的蜡烛数量 极其轻量且快速 —— 无图表延迟 兼容所有时间周期和交易品种(外汇、黄金、加密货币、指数) 输入参数 参数 描述 MaxBarsToCheck 扫描的最大蜡烛数量 ArrowSize 箭头符号的粗细 DeletePrevious 自动清除旧箭头 Enable_SingleCandle 启用/禁用单蜡烛扫荡 Enable_Double
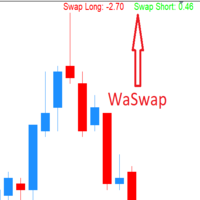
WaSwap MT4 Indicator shows the current Swap Long and current Swap Short with color.
* Set the Swap Threshold and the color to identify when the current swap is below or above the Spread Threshold.
* Set X axis and Y axis and chose the Corner and the Anchor to position the Swap Label on the chart.
* Write the font and the font size for more confort.
* Activate alert if the current Swap Long or the current Swap Short is below the swap threshold.
* The user will never swing with a negative sw
FREE

GMMA indicator that looks like a cloud. The GMMA indicator is easy to read, but to make it even more visually pleasing, we made it look like an Ichimoku Chart cloud. Colors have been changed where short-term and long-term overlap.
My other products https://www.mql5.com/ja/users/studiotam/seller
Please reduce the character limit a bit. I have nothing more to write.
FREE
Индикатор предназначен для разметки ,фибо уровней и фибо зон.Также есть возможность удаления и редактирования уровней на текущем графике. При установке нескольких индикаторов (FIBO-ZONES)на график,не забывайте менять имя в поле (NAME).В утилите также есть возможность менять цвет зон, толщину линий и стиль линий уровней фибо. При установке индикатора ,зоны выстраиваются автоматически.
FREE

目的:
该指标的功能是在主要的MT4价格图表上绘制3条移动平均线。
MA来自用户指定的3个不同的时间范围,与当前显示的图表无关。
当您在不同的时间范围内切换图表视图时,3个MA将继续显示属性中指定的时间范围的MA线。
例:
默认设置为H4,D1和W1时间帧绘制了三个50条的MA。 在M5 / M15的日内交易期间,默认设置(H4,D1,W1的MA50)可以帮助您发现较高时间范围的“硬”支撑/阻力。
好处:
始终可以在3个不同的时间范围内对所有三个MA进行可视访问,可以更好地指导您进行交易。
目的:
该指标的功能是在主要的MT4价格图表上绘制3条移动平均线。
MA来自用户指定的3个不同的时间范围,与当前显示的图表无关。
当您在不同的时间范围内切换图表视图时,3个MA将继续显示属性中指定的时间范围的MA线。
例:
默认设置为H4,D1和W1时间帧绘制了三个50条的MA。 在M5 / M15的日内交易期间,默认设置(H4,D1,W1的MA50)可以帮助您发现较高时间范围的“硬”支撑/阻力。
好处:
始终可以在3个不同的时间范围内对所有三个MA进行可视访问,可以
FREE

AR Canada Standard is a fully automated Expert Advisor optimized for trading USDCAD H1. The Expert Advisor DOES NOT use hedging, martingale, grid strategies, arbitrage, etc. It uses a trading algorithm based on the intersection of two moving averages for analyzing the market conditions. The Take Profit and Stop Loss values are fixed and have a ratio of 1 to 3,6. The EA closes positions when Take Profit or Stop Loss are reached. Risk management is a key concept in Forex trading. This EA allows se
FREE

This indicator determines minimum volumes needed during a candle formed so that it would be higher than current volume's average. Although you can place MAs on your volume indicator, this indicator has non-repaint characteristic so you may not to worry about sudden volume increase. This indiator also draw volume indicator for its own. Input Description: period: Period used for indicator. Must be higher than 1. Output Description: VolumeXover: This indicator's main feature. During the time the vo
FREE

<EA main logic>
1. EA reads candle pattern for most profitable of BUY & SELL.
2. If these pattern matches , then EA places the order.
3. If the order was closed with stoploss, then EA should stop trade on that day.
4. Next day EA will re-start again with increasing lot size to recover the loss.
<INPUT parameters> Slippage 3 pips MaxPosition 1 BaseLots 0,01 takeprofit 10pips stoploss 20pips Martingale True/False Max martingale 2 (times) Multiplier (lot size) 2,5
<Best pair & time frame>
FREE

Network EURUSD - сеточный советник, настроенный для торговли валютной парой EURUSD. Для определения моментов для открытия сделок советник использует несколько индикаторов. Рекомендуемый период графика для торговли с настройками по-умолчанию - M15.
Настройки: Take profit
Размер тейк профита
Volume
Размер лота
Balance
Баланс для расчёта лота. Если ноль, то лот будет фиксированным
Period for indicators Период для индикаторов.
FREE

Quick Close Pro by one click: * Close Buy positions * Close Sell positions * Close Win positions * Close All positions * Close All pending orders To close all positions by one click from your Telegram, please refer Master Close . Thank you! Join my channel here for more useful EAs: - Tele Notify, Price Alert, Equity Alert, Remote Algo OnOff - Auto SLTP, Close Timer
FREE

MASi Three Screens is based on the trading strategy by Dr. Alexander Elder. This indicator is a collection of algorithms. Algorithms are based on the analysis of charts of several timeframes. You can apply any of the provided algorithms.
List of versions of algorithms:
ThreeScreens v1.0 - A simple implementation, with analysis of the MACD line; ThreeScreens v1.1 - A simple implementation, with analysis of the MACD histogram; ThreeScreens v1.2 - Combines the first two algorithms in
FREE
MetaTrader市场是您可以下载免费模拟自动交易,用历史数据进行测试和优化的唯一商店。
阅读应用程序的概述和其他客户的评论,直接下载程序到您的程序端并且在购买之前测试一个自动交易。只有在MetaTrader市场可以完全免费测试应用程序。
您错过了交易机会:
- 免费交易应用程序
- 8,000+信号可供复制
- 探索金融市场的经济新闻
注册
登录