Universal Strategy Validator USV

Universal Strategy Validator: Turn Any Indicator into a Backtested Strategy

Headline: Stop guessing if an indicator works. See the win rate, profit factor, and drawdown instantly—without writing a single line of code.

Overview: The Universal Strategy Validator (USV) is a powerful analytical engine that connects to any MetaTrader 5 indicator. It reads the signal buffers (arrows, lines, or histograms) and runs a real-time simulation across historical data.

It applies professional-grade filtering, risk management rules, and exit strategies to reveal the true performance of the indicator. It displays a comprehensive institutional dashboard directly on your chart, allowing you to optimize your settings in seconds.

Why you need this: Most indicators look good visually but fail mathematically. The USV tells you the truth. It simulates entry, stop loss, take profit, and even trailing stops (breakeven) to show you exactly how that indicator would have performed over the last 1,000+ bars.

Key Features:

1. Universal Compatibility

  • Connect to any custom indicator by name.

  • Supports Dual Buffer signals (Buy Buffer / Sell Buffer).

  • Supports Single Buffer signals (Positive = Buy / Negative = Sell).

  • Auto-Refresh: Updates statistics instantly as new bars form.

2. Professional Simulation Engine

  • Adjustable History Depth: Test the last 1,000, 5,000, or 10,000 bars.

  • Visual Overlay: Draws entry arrows, trade lines, and win/loss markers directly on the chart so you can visually verify the logic.

  • Signal Delay: Option to enter trades X bars after the signal to confirm trends.

3. Advanced Filtering

  • Trend Filter: Built-in Moving Average (MA) filter. Only take Buys above the MA and Sells below the MA to filter out chop.

  • Opposite Signal Close: Option to flip the trade immediately when the indicator changes direction.

4. Robust Risk Management

  • Fixed or Dynamic Lots: Trade with fixed lots or risk a % of balance per trade.

  • Breakeven Logic: Automatically move Stop Loss to breakeven after X pips of profit to secure your wins.

  • Candle-Based Exits: Option to close trades automatically if the candle closes in profit after X bars.

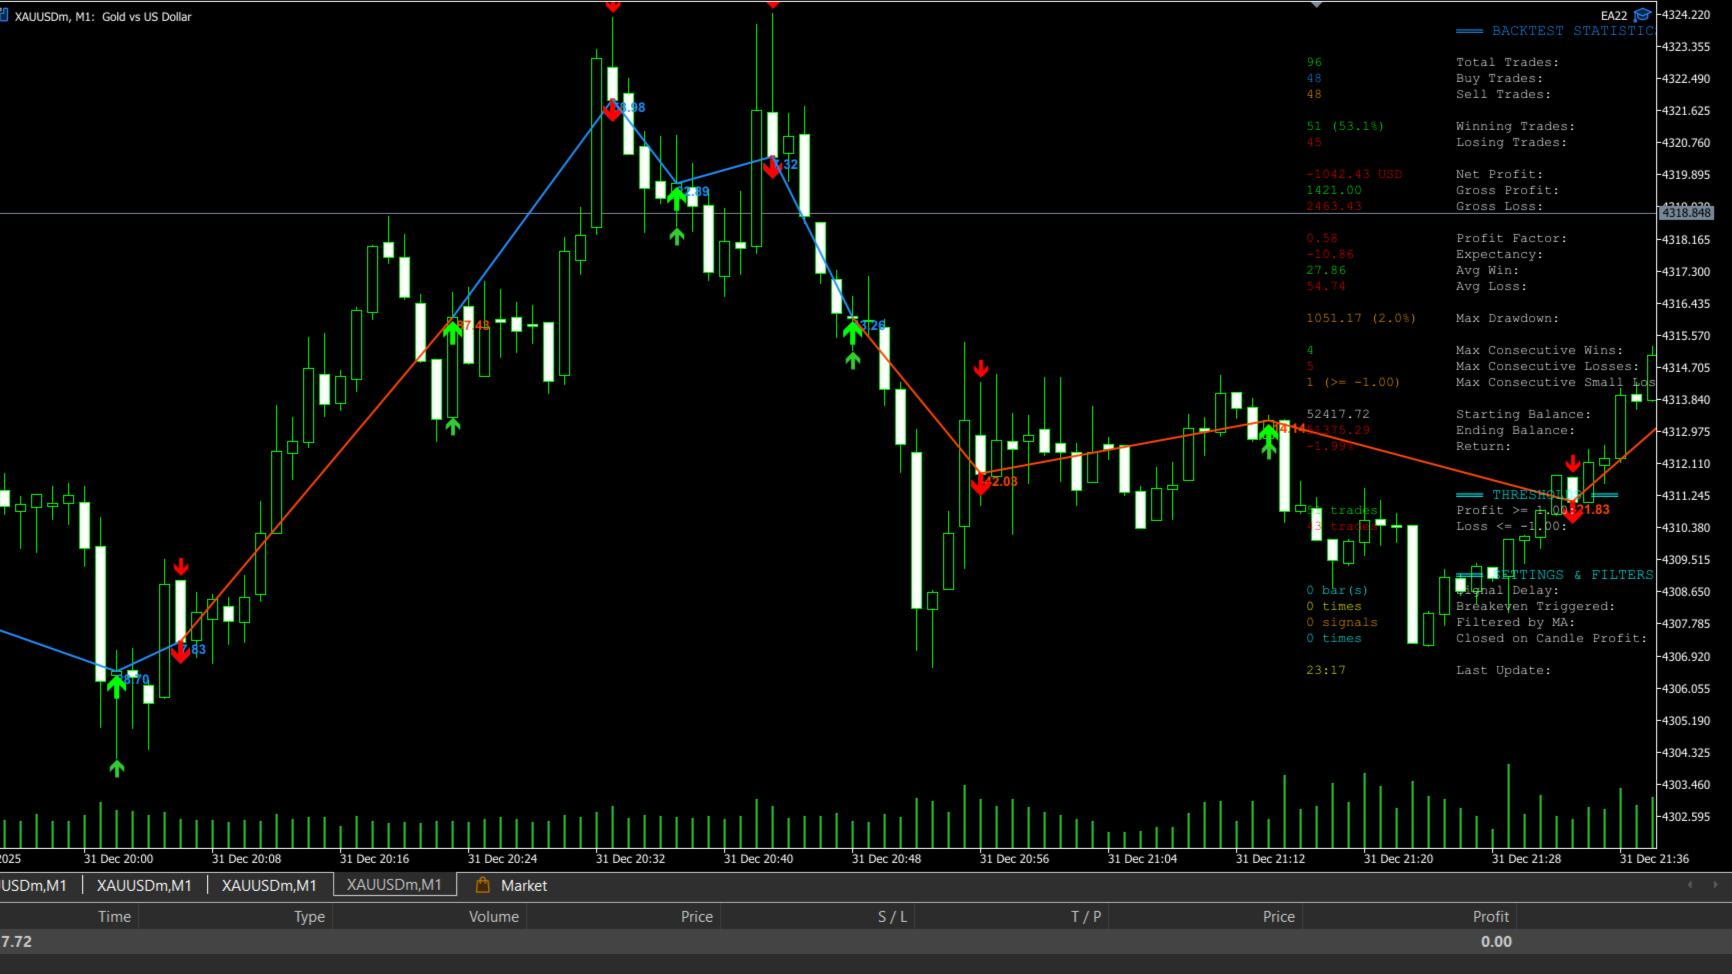
5. Institutional Statistics Dashboard Get a transparent view of your strategy's edge:

  • Win Rate % & Profit Factor

  • Net, Gross, and Average Profit

  • Max Drawdown %

  • Consecutive Wins/Losses

  • Expectancy

6. Data Export

  • Exports every simulated trade to a CSV file for further analysis in Excel or Python.

How to Use:

  1. Load the Universal Strategy Validator on your chart.

  2. Input the name of the indicator you want to test (e.g., "SuperTrend").

  3. Set the buffer indexes (usually 0 and 1 for Buy/Sell).

  4. Watch the Dashboard populate with real stats instantly.

Stop trading blind. Validate your edge with the Universal Strategy Validator.

Short Description (for MQL5 Product Card)

Turn any custom indicator into a quantifiable strategy. Simulate trades, test win-rates, apply MA filters, and visualize PnL on historical data—all without coding. Features CSV export and Institutional Dashboard.


Рекомендуем также
Индикатор строит текущие котировки, которые можно сравнить с историческими и на этом основании сделать прогноз ценового движения. Индикатор имеет текстовое поле для быстрой навигации к нужной дате. Параметры : Symbol - выбор символа, который будет отображать индикатор; SymbolPeriod - выбор периода, с которого индикатор будет брать данные; IndicatorColor - цвет индикатора; Inverse - true переворачивает котировки, false - исходный вид; Далее идут настройки текстового поля, в которое можно ввес
RAD CRITICAL LEVES RAD indicator tracks “Relevant Volume” in real time, identifying accumulation and distribution processes, projecting them in the chart as SUPPORT or RESISTANCE zones. Natural   support   and resistance levels are generated by Volume Accumulation and Distribution processes. As these processes evolve, levels at which the relevant volume in the market place is positioned, become difficult areas to cross upwards or downwards. By using this information, traders can identify very s
The Sessions and Bar Time indicator is a professional utility tool designed to enhance your trading awareness and timing precision on any chart. It combines two key features every trader needs — market session visualization and real-time bar countdown — in one clean, efficient display. Key Features: Candle Countdown Timer – Shows the remaining time before the current candle closes, helping you anticipate new bar formations. Market Session Display – Automatically highlights the four main trading
FREE
Your Pointer - это не обычный форекс канал. Этот коридор выстраивается на основании анализа нескольких свечей, начиная от последней, в результате чего определяются экстремумы исследуемого промежутка. Именно они и создают линии канала. Он как и все каналы имеет среднюю линию а также линию максимума и минимума. Этот канал стоит внимания из-за своего необычного поведения. Применение индикатора Your Pointer позволяет трейдеру вовремя отреагировать на выход цены за границы установленного для нее кан
Candle Timer Countdown Pro отображает плавный и точный обратный отсчёт до закрытия текущей свечи с круговой шкалой прогресса, позволяющей мгновенно видеть оставшееся время. В отличие от обычных таймеров, которые замирают между тиками или сбиваются, данный индикатор использует интерполяцию серверного времени и обеспечивает плавную работу на всех таймфреймах от M1 до MN. Независимо от того, торгуете ли вы скальпинг на M1 или свинг на H4, точное знание времени закрытия свечи помогает правильно выбр
VR Grid Mt5
Vladimir Pastushak
3.25 (8)
Индикатор VR Grid разработан для создания графической сетки с настройками, определяемыми пользователем. В отличие от стандартной сетки VR Grid используется для построения круглых уровней . В зависимости от выбора пользователя, шаг между круглыми уровнями может быть произвольным. Кроме того, в отличие от других индикаторов и утилит, VR Grid сохраняет положение сетки даже при изменении временного периода или перезагрузке терминала. Настройки, set файлы, демо версии, инструкции, решение проблем, мо
FREE
place a vwap line starting from the line placed on the chart parameters: tick_mode: enable to use ticks instead of bars. this uses a lot more cpu processing power prefix: prefix to add for line created by indicator line_color: set the color of the line created line_style: set the line style of the line created applied_price: set the price of bar to use of the bar std_dev_ratio: set the multiplier for the std dev channel
Elite Harmony Signals Pro Panoramica Elite Harmony Signals è un indicatore sofisticato di analisi tecnica che visualizza rettangoli dinamici che forniscono zone di trading chiare e segnali di conferma per decisioni migliorate. Caratteristiche Principali Zone Rettangolo Dinamiche Estensione in Tempo Reale : I rettangoli si estendono automaticamente all'azione corrente del prezzo Chiusura Intelligente : I rettangoli si chiudono solo quando appaiono segnali opposti Conferma Visiva : Zone di trading
Что такое CCI FIXED DUAL CCI FIXED DUAL это профессиональный Trend Direction Filter, разработанный для точного определения: доминирующего направления рынка структурного качества движения согласованности между основным трендом и фазами ускорения Это не индикатор прямого входа. Это не классический осциллятор. Это инструмент контекста, созданный для того, чтобы помочь трейдеру решать, когда торговать, а когда НЕ торговать, резко снижая рыночный шум и ошибки интерпретации. Базовая философия CCI FIXE
Based on the trading model/strategy/system of gold double-position hedging and arbitrage launched by Goodtrade Brokers, problems encountered in daily operations: 1. Account B immediately places an order immediately following account A. 2: After account A places an order, account B will automatically copy the stop loss and take profit. 3: Account A closes the position of Account B and closes the position at the same time. 4: When account B closes the position, account A also closes the position.
Gold Net Strength MT5 is a multi-source momentum indicator designed to reveal the relative strength between gold and the US dollar in real time. It combines multiple underlying inputs into a single, clean view, helping traders identify directional bias, momentum shifts, and potential trend continuation or reversal zones. The indicator plots gold strength, USD strength, a derived net strength line, and a signal line, supported by a color-coded histogram for quick visual interpretation. Built-in
BoxChart MT5
Evgeny Shevtsov
5 (7)
Рынок несправедлив, хотя бы потому, что всего лишь 10% игроков управляют 90% капитала. У рядового трейдера мало шансов, чтобы противостоять этим «хищникам». Но выход есть, необходимо всего лишь перейти на другую сторону, необходимо находиться в числе этих 10% «акул», научиться распознавать их намерения и двигаться вместе с ними. Объем - это единственный опережающий фактор, который безупречно работает на любом периоде и любом торговом инструменте. Сначала зарождается и накапливается объем, и толь
Gold Atlas
Jimmy Peter Eriksson
4.81 (21)
Инвестиционная фирма готова! Не предназначено для краткосрочной перепродажи счетов или быстрой прибыли. Встроенные функции «   Ежедневная защита от потерь»   и «   Родомайзер»   для торговли через проп-фирмы. Без мартингейла / Без сетки Разработано для трейдеров, ориентированных на долгосрочную стабильность. Результаты в режиме реального времени:   Сигнал в реальном времени   |   Основной портфель   |   Результаты FTMO     |   Результаты сообщества     |    Открытое сообщество   |    Руководств
Introducing "X Marks the Spot" – Your Ultimate MetaTrader 5 Indicator for Perfect Trades! Are you tired of the guesswork in trading? Ready to take your MetaTrader 5 experience to a whole new level? Look no further – "X Marks the Spot" is here to revolutionize your trading strategy! What is "X Marks the Spot"? "X Marks the Spot" is not just another indicator – it's your personal trading compass that works seamlessly on all timeframes . Whether you're a beginner or an experienced trader,
Order Book, известный также как Market Book, глубина рынка, стакан цен, Level 2, - это предоставляемая брокером динамически обновляемая таблица с данными по текущим объемам торговых заявок на покупку и продажу для различных уровней цен вблизи Bid и Ask конкретного финансового инструмента. MetaTrader 5 предоставляет возможность трансляции стакана цен , но только в реальном времени. Данный индикатор OrderBook Cumulative Indicator позволяет аккумулировать данные стакана онлайн и визуализировать их
ICT Order Blocks Premium Indicator Professional Market Structure Analysis Based on ICT Methodology OrderBlocks ICT   is an advanced technical analysis tool that identifies high-probability trading zones based on the Inner Circle Trader (ICT) methodology. This professional-grade indicator detects key market turning points using institutional order block analysis, revealing where smart money is likely accumulating positions. Key Features: Smart Filtering Technology : Eliminates weak and insignific
<p> HTB Throne Gold Scalper EA — это автоматизированная торговая система, предназначенная для торговли XAUUSD (золото) на таймфрейме M5. Система выполняет внутридневные скальпинговые сделки с использованием заранее заданных правил и параметров контролируемого риска. </p> <p> Советник анализирует структуру рынка и условия волатильности для выбора торговых возможностей. Каждая сделка управляется независимо. Система не использует grid-стратегии и методы Martingale. </p> <h3>Управление рисками</h3
An ICT fair value gap is a trading concept that identifies market imbalances based on a three-candle sequence. The middle candle has a large body while the adjacent candles have upper and lower wicks that do not overlap with the middle candle. This formation suggests that there is an imbalance where buying and selling powers are not equal. Settings Minimum size of FVG (pips) -> FVGs less than the indicated pips will be not be drawn Show touched FVGs Normal FVG color -> color of FVG that hasn't
FREE
Профиль Рынка (Market Profile) определяет ряд типов дней, которые помогают трейдеру распознать поведение рынка. Ключевая особенность - это область значений (Value Area), представляющая диапазон ценового действия, в котором произошло 70% торговли. Понимание области значений может помочь трейдерам вникнуть в направление рынка и установить торговлю с более высокими шансами на успех. Это отличное дополнение к любой системе, которую вы возможно используете. Blahtech Limited представляет сообществу Me
Price Magnet — Индикатор зон плотности цены и уровней притяжения Price Magnet — это профессиональный аналитический инструмент, который определяет ключевые уровни поддержки и сопротивления на основе статистической плотности распределения цены (Price Density). Индикатор анализирует заданный исторический период и находит ценовые значения, на которых рынок находился дольше всего. Эти зоны выступают в роли «магнитов» — они притягивают цену или служат фундаментом для разворота. В отличие от стандартны
TrendFollower (Универсальный инструмент для анализа трендов) Забудьте о стандартных индикаторах. Откройте для себя TrendFollower – 5 стратегий в одной! Устали от индикаторов, которые показывают сигнал на покупку, когда рынок давно прошел свой пик? Ваши скользящие средние настолько запаздывают, что показывают тренд прошлого вторника? Давайте разберемся. Представляю вам TrendFollower – мощную модульную систему (институционального уровня), которая анализирует структуру рынка с пяти
Bober Real MT5
Arnold Bobrinskii
4.88 (16)
Bober Real MT5 — полностью автоматический советник для торговли на рынке Forex. Робот создан в 2014 году и за этот период сделал множество прибыльных сделок, показав более 7000% прироста депозита на моем личном счете. Было выпущено много обновлений, но версия 2019 года считается самой стабильной и прибыльной. Робот можно запускать на любых инструментах, но лучшие результаты достигаются на EURGBP , GBPUSD , таймфрейм M5 . Робот не покажет хорошие результаты в тестере или на реальном счете, если
Tape Hunter
Thalles Nascimento De Carvalho
Tape Hunter – Ваш радар усилий и результата в MT5 Tape Hunter — это идеальный индикатор для трейдеров, которые хотят видеть настоящую игру за ценами на MetaTrader 5. Он четко и интуитивно показывает агрессивные объемы покупок и продаж на основе POC (Point of Control), позволяя визуализировать усилия рынка и реальный результат на каждом свече. ️ Почему это важно? Не весь объем двигает цену! Tape Hunter показывает, действительно ли усилия (агрессивный объем) эффективно влияют на движение ц
Volume Profile Canvas - Professional Volume Profile Indicator for MetaTrader 5 DESCRIPTION Volume Profile Canvas is a professional volume profile indicator for MetaTrader 5 that renders directly on the chart using a high-performance Canvas engine. It calculates and displays the volume distribution across price levels, identifying the Point of Control (POC), Value Area High (VAH) and Value Area Low (VAL) in real time. This is a pure analysis tool. It does not trade. It gives you an instant vi
Phantom Edge SMC — The Ultimate Smart Money Indicator for MT5 Tired of manually drawing structures while trading SMC or ICT concepts? Let Phantom Edge SMC do the heavy lifting for you. Key Features Internal & Swing Structure: Automatically detects BOS and CHoCH across two structural levels. Order Blocks (OB): Identifies Internal and Swing OBs with automated mitigation tracking. Equal Highs / Lows: Highlights EQH / EQL to pinpoint Liquidity pools. Fair Value Gaps (FVG): Displays FVGs with
Trades History Visualizer is a MetaTrader 5 indicator that displays your trading history directly on the chart, providing a clear visual representation of past trades with additional information. Key Features: Visual trade history display with entry arrows Entry, Stop Loss, and Take Profit horizontal lines Color-coded connector lines between entry and exit points (green for profit, red for loss) Risk-Reward ratio display for each closed trade Profit/Loss amount display option Pip display option
Stargogs Spike Catcher
Lorenzo Edward Beukes
4.56 (9)
Stargogs Spike Catcher V4.0 This Indicator is Developed To milk the BOOM and CRASH indices . Now Also work on weltrade for PAIN and GAIN indices. Send me Message if you need any help with the indicator.  CHECK OUT THE STARGOGS SPIKE CATCHER EA/ROBOT V3: CLICK HERE ALSO CHECK OUT SECOND TO NONEFX SPIKE CATCHER:   CLICK HERE STARGOGS SPIKE CATCHER V4.0 WHATS NEW! Brand New Strategy. This is the Indicator you need for 2025. New Trend Filter to minimize losses and maximize profits. New Trendline th
Haven HTF Candle — Сила Старшего Таймфрейма на Вашем Графике Представляем Haven HTF Candle — мощный инструмент, который отображает свечи старшего таймфрейма (HTF) прямо на вашем рабочем графике. Перестаньте постоянно переключаться между окнами и начните видеть истинный рыночный контекст, что является основой для принятия взвешенных торговых решений. Другие продукты -> ЗДЕСЬ . Ключевые Возможности и Концепция "Power of 3" Анализ по концепции "Power of 3" (AMD): Индикатор четко отображает цену от
FREE
Deriv Synthetic HTF Candle Projection GMT2 Higher Timeframe Candle Projection & Previous Levels Tool for Deriv Synthetic Indices (MT5) Overview Deriv Synthetic HTF Candle Projection GMT2 is a professional MetaTrader 5 indicator built specifically for Deriv Synthetic indices . It projects the current forming Higher Timeframe (HTF) candle onto the chart and automatically draws key reference levels from previous candles. This indicator is designed to help traders maintain higher timeframe context
FREE
Russian Этот индикатор служит передовым помощником по анализу графиков для трейдеров, предпочитающих торговлю по графическим паттернам. Он разработан для снижения нагрузки при визуальном анализе и повышения точности извлечения прибыли. Основные преимущества данного индикатора с практической точки зрения: 1. Автоматическое распознавание паттернов (Automated Pattern Detection) Экономия времени и снижение предвзятости: Вам больше не нужно вручную чертить трендовые линии. Индикатор находит ценовые р
С этим продуктом покупают
ARIPoint
Temirlan Kdyrkhan
1 (1)
ARIBot is a powerful trading companion designed to generate high-probability entry signals with dynamic TP/SL/DP levels based on volatility. Built-in performance tracking shows win/loss stats, PP1/PP2 hits, and success rates — all updated live. Key Features: Buy/Sell signals with adaptive volatility bands Real-time TP/SL/DP levels based on ATR Built-in MA Filter with optional ATR/StdDev volatility Performance stats panel (Success, Profit/Loss, PP1/PP2) Alerts via popup, sound, push, or email Cus
Умный многослойный детектор пробоя и отката для MetaTrader 5 «Умно. Просто. Быстро!» Устали упускать точки входа с высокой вероятностью пробоя? Тратите часы на просмотр нескольких графиков, пытаясь совместить пробои с направлением тренда и динамикой валют — и всё равно упускаете движение? Break Pullback решает всё это с помощью одного индикатора. Что такое Break Pullback? Break Pullback — это профессиональный индикатор MetaTrader 5, созданный специально для трейдеров, торгующих по структуре ры
ARICoin is a powerful trading companion designed to generate high-probability entry signals with dynamic TP/SL/DP levels based on volatility. Built-in performance tracking shows win/loss stats, PP1/PP2 hits, and success rates all updated live. Key Features: Buy/Sell signals with adaptive volatility bands Real-time TP/SL/DP levels based on ATR Built-in MA Filter with optional ATR/StdDev volatility Performance stats panel (Success, Profit/Loss, PP1/PP2) Alerts via popup, sound, push, or email Cust
AriX
Temirlan Kdyrkhan
1 (4)
AriX Indicator for MT5 A powerful trend-following and signal-evaluation tool AriX is a custom MT5 indicator that combines Moving Averages and ATR-based risk/reward logic to generate clear buy/sell signals. It visualizes dynamic SL/TP levels, evaluates past trade outcomes, and displays win/loss statistics in a clean on-chart panel. Key features include: Buy/Sell signals based on MA crossovers ATR-based SL/TP1/TP2/TP3 levels with visual lines and labels Signal outcome tracking with real-time stat
CGE Trading Suite
Carl Gustav Johan Ekstrom
5 (2)
Institutional-Grade Analytics for MT5 C GE Trading Suite delivers the analytical edge typically reserved for professional trading desks. The platform integrates a full suite of analytical tools into one seamless workflow: dynamic grid mapping, liquidity behavior analysis, ECM, trend lines, MIDAS, trade cycles, and directional channel projections. Together, these provide a unified view of market structure and momentum. Directional clarity is further enhanced by the capital flow index, which meas
note: this indicator is for METATRADER4, if you want the version for METATRADER5 this is the link:  https://www.mql5.com/it/market/product/108106 TRENDMAESTRO ver 2.5 TRENDMAESTRO recognizes a new TREND from the start, he never makes mistakes. The certainty of identifying a new TREND is priceless. DESCRIPTION TRENDMAESTRO identifies a new TREND in the bud, this indicator examines the volatility, volumes and momentum to identify the moment in which there is an explosion of one or more of these da
A tool for on-chart strategy backtesting and performance analysis. A utility for developing, debugging, and testing custom trading ideas and indicator functions. An indicator designed to quickly test trading concepts and visualize the effectiveness of different input parameters. An all-in-one sandbox for testing everything from simple crossovers to complex, multi-condition trading systems.
Beat The Market Maker MT5
Yahia Ismail Ibrahim El Mughrabi
BEAT THE MARKET MAKER Stop Entering After the Market Has Already Trapped You Most traders think they need a better entry. But the real problem is deeper. They enter when price looks strong… only to discover they were the liquidity. The market moves to collect weak positions before the real move begins. That is why you get caught in fake breakouts. That is why you enter late. That is why the chart looks clear only after the move is finished. You do not need more noise. You need to read the
IVISTscalp5
Vadym Zhukovskyi
5 (6)
[iVISTscalp5]:  Лаборатория исследования поведения рынка через время TLV Framework | Liquidity Activation Points Общее описание iVISTscalp5 — это мультиуровневый индикатор таймингов и ценовой структуры, разработанный в рамках проекта VISTmany. Система прогнозирует время, направление и диапазон движения через Liquidity Activation Points (тайминги). Индикатор iVISTscalp5 можно использовать с параметрами по умолчанию для любого финансового инструмента. -----------------------------------------
ZIVA Signal Intelligence
Hassan Abdullah Hassan Al Balushi
ZIVA Signal Intelligence An Adaptive, Modular Market Intelligence System ZIVA Signal Intelligence is not positioned as a conventional trading indicator. It is a fully integrated, proprietary market intelligence system engineered to deliver structured, high-precision interpretation of price behavior within a controlled analytical environment. Developed through an independent architectural approach, ZIVA does not rely on, derive from, or replicate existing indicators. It represents a standalone
ARIScalp is a powerful trading companion designed to generate high-probability entry signals with dynamic TP/SL/DP levels based on volatility. Built-in performance tracking shows win/loss stats, PP1/PP2 hits, and success rates all updated live. Key Features: Buy/Sell signals with adaptive volatility bands Real-time TP/SL/DP levels based on ATR Built-in MA Filter with optional ATR/StdDev volatility Performance stats panel (Success, Profit/Loss, PP1/PP2) Alerts via popup, sound, push, or email Cus
Recommended TimeFrame >= H1. 100% Non Repainted at any moment.  Use it carefully, only with Trend Direction. Trading Usage: 2 Variants: as Range System or as BreakOut System (Both Only With Trend Direction)::: (Always use StopLoss for minimise Risk); [1] as Range System: (Recommended) in UP TREND:  - BUY in Blue Line , then if price goes down by 50 points (on H1) open Second BUY.   Close in any Profit you wish: TrailingStop(45 points) or Close when Price touches upper Gold Line. in DOWN TREND
VTrende Pro
Andrii Diachenko
5 (1)
VTrende Pro - МТФ индикатор для трендовой торговли с панелью индикации для МТ5 !!! - Подробное описание на русском языке под видео (на Youtube) - !!! Хотя сигналы индикатора VTrende Pro можно использовать, как сигналы полноценной торговой системы, рекомендуется применять их в связке с ТС Билла Вильямса. VTrende Pro - это расширенная версия индикатора VTrende . Отличие Pro версии от VTrende: - Временные зоны - Сигнал V - сигнал 1-2 волн Основная задача индикатора - определить точки изменения н
Triple Crox v4.10 Triple Crox Strategy v4.10 Паттерны • Фибоначчи • CLUSTER ML • Мульти-фильтр 1. Обзор Triple Crox v4.10 — проф. MT5 индикатор: 13 паттернов , Фибоначчи , CLUSTER ML , мульти-фильтр для точных сигналов. 2. Конфигурация Хейкен-Аши , стрелки Buy / Sell , Entry/TP1/TP2/TP3/SL , 13 фильтров. 3. Визуальные компоненты Buy/Sell стрелки • Облако EMA (3 слоя) • Ribbon лента • DEMA-ATR • Фибоначчи уровни • 13 паттернов с зонами пробоя • Dashboard 4. Риск-менеджмент ATR-стопы • Trailing
Индикатор интеллектуальных торговых сигналов «Red and Green Light» Описание продукта Red and Green Light — это профессиональный индикатор торговых сигналов, основанный на многоступенчатом сглаживающем алгоритме T3. Он объединяет визуальную систему «светофора», интеллектуальное распознавание сигналов, оповещения о рисках и многоуровневую систему уведомлений. Независимо от того, являетесь ли вы ручным трейдером или разработчиком советников (EA), этот индикатор поможет вам точнее улавливать р
Робот с видео приложен во вкладке "Обсуждение" , он работает одним ордером и только по сигналам для оценки эффективности индикатора. Pan PrizMA CD Phase является опцией, построенной на базе индикатора Pan PrizMA . Подробнее . Усреднение полиномом второй-четвертой степени повышает гладкость линий, добавляет инерцию и соответственно ритмичность. Экстраполяция функцией синусоиды около константы позволяет регулировать запаздывание или опережение. Значение фазы - параметра состояния волны (близко по
Классификатор силы тренда. Показания на истории не меняет. Изменяется классификация только незакрытого бара. По идее подобен полной системе ASCTrend, сигнальный модуль которой, точнее его аппроксимация в несколько "урезанном" виде, есть в свободном доступе, а также в терминале как сигнальный индикатор SilverTrend . Точной копией системы ASCTrend не является. Работает на всех инструментах и всех временных диапазонах. Индикатор использует несколько некоррелируемых между собой алгоритмов для класси
FFx Universal Strength Meter PRO - это больше, чем простой измеритель силы. Вместо того, чтобы ограничивать расчет ценой, его значения могут быть основаны на любом из 19 встроенных режимов измерения силы + 9 таймфреймов. С FFx USM вы сможете задавать любой период для любой комбинации таймфреймов. Например, вы можете установить панель на последние 10 свечей на M15-H1-H4… Полная гибкость! Простая интерпретация... Это дает отличное представление о том, какие валюты слабые и сильные, поэтому вы смож
Индикатор FFx Universal MTF Alerter показывает все тайфреймы (от M1 до месячного) на одном графике, отображая статус выбранного индикатора на каждом из них. 9 индикаторов (MACD-RSI-Stochastic-MA-ADX-Ichimoku-Candles-CCI-PSAR). Каждый из них можно несколько раз применять на одном графике с различными настройками. Простая интерпретация. Сделки на покупку подтверждаются, когда большинство таймфреймов показывается зеленым цветом. А сделки на продажу подтверждаются, когда большинство таймфреймов пока
FFx Watcher PRO - панель для отображения на одном графике текущего направления стандартных индикаторов (до 15 одновременно) на нескольких таймфреймах (до 21). Панель работает в двух режимах: Режим Watcher: Мульти-индикаторный Пользователь может выбрать до 15 индикаторов для отображения Пользователь может выбрать до 21 таймфрейма для отображения Режим Watcher: Мультивалютный Пользователь может выбрать любое количество символов Пользователь может выбрать до 21 таймфрейма для отображения В этом реж
Индикатор FFx Patterns Alerter дает торговые рекомендации по входу в рынок, по уровням TP 1, TP 2 и SL на основе любого из выбранных паттернов (PinBar, Engulfing, InsideBar, OutsideBar) Предлагаются следующие варианты: Для работы с несколькими парами можно запускать несколько экземпляров индикатора на одном графике. Рекомендации по входу - количество пипсов, которые будут добавлены после пробоя для входа в рынок 3 различных варианта расчета SL - по пипсам, с использованием множителя ATR или по м
Версия для MetaTrader 4 доступна здесь : https://www.mql5.com/ru/market/product/24881 FFx Basket Scanner ищет до пяти индикаторов среди 16 доступных на всех парах и таймфреймах. Таким образом вы можете ясно увидеть торговли по каким валютам следует избегать, а на каких сосредоточить внимание. Когда валюта переходит в экстремальную зону (например, 20/80%), вы можете торговать всей корзиной с большей уверенностью. Другая область применения индикатора – определение сильных и слабых валют для поиск
Версия для MetaTrader 4 доступна здесь: https://www.mql5.com/ru/market/product/25793 FFx Pivot SR Suite PRO - это полный набор инструментов для построения уровней поддержки и сопротивления. Поддержка и сопротивление - самые используемые уровни во всех видах торговли. Их можно использовать для поиска разворотов тренда, установки уровней тейк-профита и стоп-лосса и т.д. Индикатор можно полностью настроить непосредственно с графика Выбор из 4 периодов для расчетов: 4-часовой, дневной, недельный и
ClassicSBA
Umri Azkia Zulkarnaen
this indicator very simple and easy if you understand and agree with setup and rule basic teknical sba you can cek in link : please cek my youtube channel for detail chanel : an for detail info  contact me  basicly setup buy (long) for this indicator is Magenta- blue and green candle or magenta - green  and green candlestik and for setup sell (short) is Black - yellow - and red candle or black - red  and red candlestik
Indicador en base a la pendiente de la linea de precio, dibuja una línea de color cuando sube a base de los precios que previamente has sido procesados o linealizados, y cuando baja la pendiente la linea linealizada toma otro color. En este caso se a considerado 6 lineas de diferentes procesos desde pendientes largas hacia las cortas, observándose que cuando coincidan las pendientes se produce un máximo o mínimo, lo que a simple vista nos permitirá hacer una COMPRA O VENTA.
WanaScalper
Isaac Wanasolo
1 (1)
A scalping indicator based on mathematical patterns, which on average gives signals with relatively small SL, and also occasionally helps to catch big moves in the markets (more information in the video) This indicator has three main types of notifications: The first type warns of a possible/upcoming signal on the next bar The second type indicates the presence of a ready signal to enter the market/open a position The third type is for SL and TP levels - you will be notified every time price re
Индикатор Coefficient Of Determination (COD) представляет собой значение коэффициента детерминации или квадрат коэффициента корреляции между зависимой переменной — ценой и объясняющей переменной — тиковым объемом. Что это дает нам на практике? COD отлично распознает кульминацию трендовых движений, что позволяет подбирать оптимальные точки и ловить развороты рынка. Как использовать индикатор: Наиболее популярная торговая стратегия строится совместно с трендовым индикатором Moving Average (MA), пе
Fibonacci Múltiple 12, utiliza la serie fibonacci plasmado en el indicador fibonacci, aumentadolo 12 veces según su secuencia. El indicador fibonacci normalmente muestra una vez, el presente indicador se mostrara 12 veces empezando el numero que le indique siguiendo la secuencia. Se puede utilizar para ver la tendencia en periodos cortos y largos, de minutos a meses, solo aumentado el numero MULTIPLICA.
En base a cálculos matemáticos de determino una linea Horizontal que cruza a todas las señales de trading, mostrando los máximos y mínimos. La linea horizontal parte en dos las subidas y bajadas de las señales de trading, de tan manera que es fácil identificar los máximos y mínimos, y es inteligente por que es sensible a las subidas y bajadas, afín de no quedarse en un solo lado por siempre, trabaja excelentemente con otros indicadores suavizadores ya que les garantiza que en un intervalo de tie
этот индикатор является индикатором детектора спайков, он специально разработан для обмена на Boom 1000, Boom 500, Crash 1000 и Crash 500 Мы рекомендуем использовать его только для индексов Deriv Boom и Crash. Его настройки интуитивно понятны, знакомы, просты в использовании имеет функции уведомления; звуковые уведомления и push-уведомления. этот инструмент прост в использовании, прост в обращении Это обновление основано на разных стратегиях для шипов.
Другие продукты этого автора
Phantom Flow
Mahmoud Ahmed Abdou Ali
5 (1)
This indicator is a hybrid SMC + Trend + Oscillator tool that draws market-structure objects on the chart and also plots trend shift lines + arrows and a colored oscillator histogram. It includes these modules: Phantom Shift (ATR trend shift / trailing bands) Swing Structure (BOS/CHoCH + swing points) Internal Structure (iBOS/iCHoCH) Order Blocks (swing + internal) Equal Highs / Equal Lows (EQH / EQL) Fair Value Gaps (FVG) Premium / Discount zones (range zones) Phantom Oscillator (MA
FREE
Candle color RSI (Relative Strength Index) indicators change candlestick colors on the price chart to visually show RSI conditions like overbought/oversold levels or bullish/bearish momentum, using colors like red for overbought/bearish and green for oversold/bullish, helping traders spot reversals or strength at a glance without looking at the separate RSI pane. These custom indicators often color candles red above 70 (overbought), green below 30 (oversold), and keep default colors in between
FREE
Here is the full professional description for your indicator, rebranded as Institutional Trend Candles (ITC) . You can use this text for your Market documentation, user manual, or simply to understand exactly how your tool functions. Institutional Trend Candles (ITC) v1.0 Overview Institutional Trend Candles (ITC) is a specialized trend-following system designed to filter out "retail noise" and visualize the true directional flow of the market. Built specifically for high-volatility assets like
FREE
Institutional QQE Oscillator (IQO) Description The Institutional QQE Oscillator (IQO) is a "momentum volatility" filter. Unlike a standard RSI which is jagged and noisy, the QQE uses a smoothing technique and a "Volatility Stop" mechanism (the yellow dotted line) on the RSI itself. Blue Line (Fast): The Smoothed RSI momentum. Yellow Dotted Line (Slow): The Volatility Threshold. Signal: When the Blue line crosses the Yellow line, it indicates a shift in true momentum, filtering out fake-outs. How
FREE
Here is the full technical and strategic description for the Gann Square of 9 indicator. Full Name Gann Square of 9 - Intraday Levels (v2.0) Overview This is a mathematical Support & Resistance indicator based on W.D. Gann's "Square of 9" theory. Unlike moving averages which lag behind price, this indicator is predictive . It calculates static price levels at the very beginning of the trading day (based on the Daily Open) and projects them forward. These levels act as a "road map" for the day,
FREE
Description The Institutional Cycle Filter (ICF) is a sophisticated trend-following tool that replaces standard moving averages with a "Signal Dot" system. It is designed to minimize lag while maintaining smoothness, making it highly effective for identifying trend reversals in volatile markets like Gold. How It Works (The Logic) Cosine Weighting: Unlike a Simple Moving Average (SMA) or Exponential Moving Average (EMA), this algorithm uses a Cosine function to calculate weights. This allows the
FREE
Supply and demand in trading describes how buyer (demand) and seller (supply) actions set asset prices, with high demand/low supply raising prices (premium) and low demand/high supply lowering them (discount); traders identify these imbalances as "zones" on charts (e.g., Rally-Base-Rally for demand, Drop-Base-Drop for supply) to find potential entry/exit points, aiming to buy at discount demand zones and sell at premium supply zones, using volume and price action to confirm institutional acti
FREE
Accurate Signal Pro
Mahmoud Ahmed Abdou Ali
3 (2)
Accurate Signal ARC is a non-repainting trend & reversal signal indicator designed for MT4 . It uses ATR-weighted volatility logic combined with adaptive price channels to detect high-probability BUY and SELL points directly on the chart. How It Works Calculates a dynamic volatility channel using weighted ATR Detects trend direction (river state) and switches only when price decisively breaks the channel Filters noise using spread-aware true range Draws clear arrows : Lime Arrow → BUY si
FREE
The best eveR
Mahmoud Ahmed Abdou Ali
Indicator Name: "The Range Master" Core Purpose The Range Master is an advanced, multi-timeframe technical indicator designed to identify market consolidation (sideways ranging) and subsequent high-momentum breakout opportunities. It helps traders visually confirm when price action transitions from low-volatility accumulation to high-volatility trend initiation. ️ Functional Description (What it Does) The Range Master performs three primary, interconnected functions: Range Mapping , Breakout
FREE
MA Ribbon
Mahmoud Ahmed Abdou Ali
The MA ribbon is not a single indicator but rather an overlay of multiple moving averages (typically four to eight or more) of varying lengths plotted on the same price chart.  Visual Appearance: The resulting lines create a flowing, ribbon-like pattern across the price chart. Components: Traders can use different types of moving averages, such as Simple Moving Averages (SMA) or Exponential Moving Averages (EMA), and adjust the time periods (e.g., 10, 20, 30, 40, 50, and 60 periods) to suit t
FREE
Indicator: The DEMA MACD Zone Divergence This is a powerful, multi-timeframe trend-following indicator based on the Moving Average Convergence Divergence (MACD) , but enhanced using Double Exponential Moving Averages (DEMA) for reduced lag. Its main function is to paint the background of the price chart with color-coded rectangular zones, clearly signaling the current momentum phase and potential shifts in market control (bullish or bearish). Core Purpose To visually map the strength and phas
FREE
Footprint MT5
Mahmoud Ahmed Abdou Ali
Footprint charts in MetaTrader 5 (MT5) provide traders with a detailed view of market activity, allowing for better analysis of price movements and trading decisions. What is a Footprint Chart? A footprint chart is a specialized visualization tool that displays market data beyond traditional candlestick or bar charts. It reveals how volume was distributed at each price level within a specific time frame, often segmented by bid and ask activity. This level of detail helps traders understand the
MM Ultimate Pro Analyzer v10.0 - USER GUIDEBASIC USAGEStep 1: Add to Chart Open any chart in MetaTrader 5 Go to Navigator → Indicators Find MM Ultimate Pro Analyzer Drag it onto your chart A settings window will appear Step 2: Configure for Your Timeframe Choose settings based on what you trade: Timeframe NumberOfCandles VolumeAveragePeriod M1-M5 (Scalping) 10-20 50 M15-M30 (Day Trading) 5-10 30 H1-H4 (Swing Trading) 3-7 20 D1+ (Position Trading) 3-5 14 Step 3: Understand the Button Bar At the t
Trading Simulator X
Mahmoud Ahmed Abdou Ali
TradePanel Pro Indicator Testing & Trading Simulator Core Purpose (Clear & Honest) TradePanel Pro is a manual trading simulator designed to test indicators, signals, and strategies in real market conditions — without relying on automated logic. You see the signal → you click → you evaluate the result . What TradePanel Pro Is (Correct Positioning) Manual BUY / SELL execution panel Layered entries (multi-order testing) Real-time TP / SL behavior Trailing stop simulation Profit /
Quantitative Session Breakout Profiler & Data Miner Executive Summary: The "London Hunter v18.0" is not merely a buy/sell signal indicator; it is a statistical data mining engine . Its core idea is that market openings (London, NY, Asia) are not random, but distinct "micro-regimes." By measuring the specific "physics" of price movement (speed, pullback, candle size) during these opening windows, the system identifies which specific conditions lead to successful breakouts and which lead to fakeou
Institutional Physics Engine (IPE) v4.20 Market Structure, Liquidity & Valuation Diagnostic System WHAT THIS TOOL IS Institutional Physics Engine (IPE) is a real-time market diagnostics indicator that analyzes price using behavioral physics, liquidity response, supply & demand pressure, and equilibrium valuation. It does not predict price and does not generate blind buy/sell signals. Instead, it answers three professional trading questions: Where is fair value right now? Who is in con
Candle Density Boxes Indicator  Summary The Candle Density Boxes (CDB) indicator is an algorithmic tool that identifies price zones where candles cluster with high frequency. Through empirical analysis, we demonstrate that these zones exhibit statistically significant mean-reversion properties, with return frequencies ranging from 76–80% across multiple instruments. Key Findings: Zones with 6+ candle touches show 90%+ return probability Rank-based hierarchy provides clear reliability classifica
Summary (What Changed & Why It Matters) Traditional FVG indicators suffer from three structural flaws : Detection and mitigation are coupled Wicks and bodies are treated identically Partial mitigation is not preserved This indicator introduces a new FVG model where: Detection ≠ Mitigation Wick interaction ≠ Body acceptance FVGs decay progressively , not instantly This transforms FVGs from a static drawing tool into a dynamic price-acceptance model .
MATRIX OSCILLATOR - Summary Guide WHAT IS IT? A multi-component oscillator that combines: Smart Money Flow (MFI-based histogram) Net Score (Trend strength from -100 to +100) Signal Line (Crossover reference) Confluence Zones (Confirmation areas) PhiSmoother Technology (Advanced noise filtering) STRONG BUY SIGNALS Component Condition Confluence Green zone filled (top) Money Flow Green bars above zero MFI Threshold MFI above green threshold line Net Score
3D Intensity Balls with Volume Boost Indicator v1.4 A sophisticated MetaTrader 5 custom indicator that visualizes price-level trading intensity using dynamically-sized, photorealistic 3D spheres rendered on the chart canvas, enhanced with volume-based scaling and advanced visual effects. Core Functionality Price Distribution Analysis: Divides each candle's price range into configurable levels (default: 50) Samples tick data to measure time-at-price (price dwell intensity) Visualizes concentra
# All Trading Symbols Monitoring ## Version 9.43 | MT5 Indicator (Dual Mode) > An advanced multi-symbol trading monitor that watches all available broker symbols simultaneously, detects breakout opportunities, scores signal quality, and manages both paper and live trades - all displayed in a live on-chart dashboard. --- ## What This Tool Does - [ All Trading Symbols Monitoring ]( #all-trading-symbols-monitoring )   - [ Version 9.43 | MT5 Indicator (Dual Mode) ]( #version-943--mt5-indicator-
Lux Algo
Mahmoud Ahmed Abdou Ali
This system is a Self-Optimizing Algorithmic Framework . Unlike static indicators, it uses a Recursive Feedback Loop to "learn" the current market regime and adjust its sensitivity in real-time. Because it calculates every step based solely on current and past data, it is a Real-Time Model with no repainting, no bias, and no lookahead. How the "AI" Operates Performance-Based Learning: The system constantly "grades" its own accuracy. If the market is trending cleanly, it increases its sensitivit
VolumeProfilePerCandle v4.4 This is a comprehensive per-candle volume profile / footprint chart indicator for MetaTrader 5, rendered entirely via a canvas overlay (CCanvas). It's a single-file, zero-buffer indicator that draws directly onto the chart window using pixel-level graphics. Here's a complete breakdown: Core Concept For every visible candle, the indicator divides the bar's price range into configurable price levels (up to 50) and counts how much trading activity occurred at each level
Фильтр:
Нет отзывов
Ответ на отзыв