Volume at Price VAP

Volume at Price (VAP)

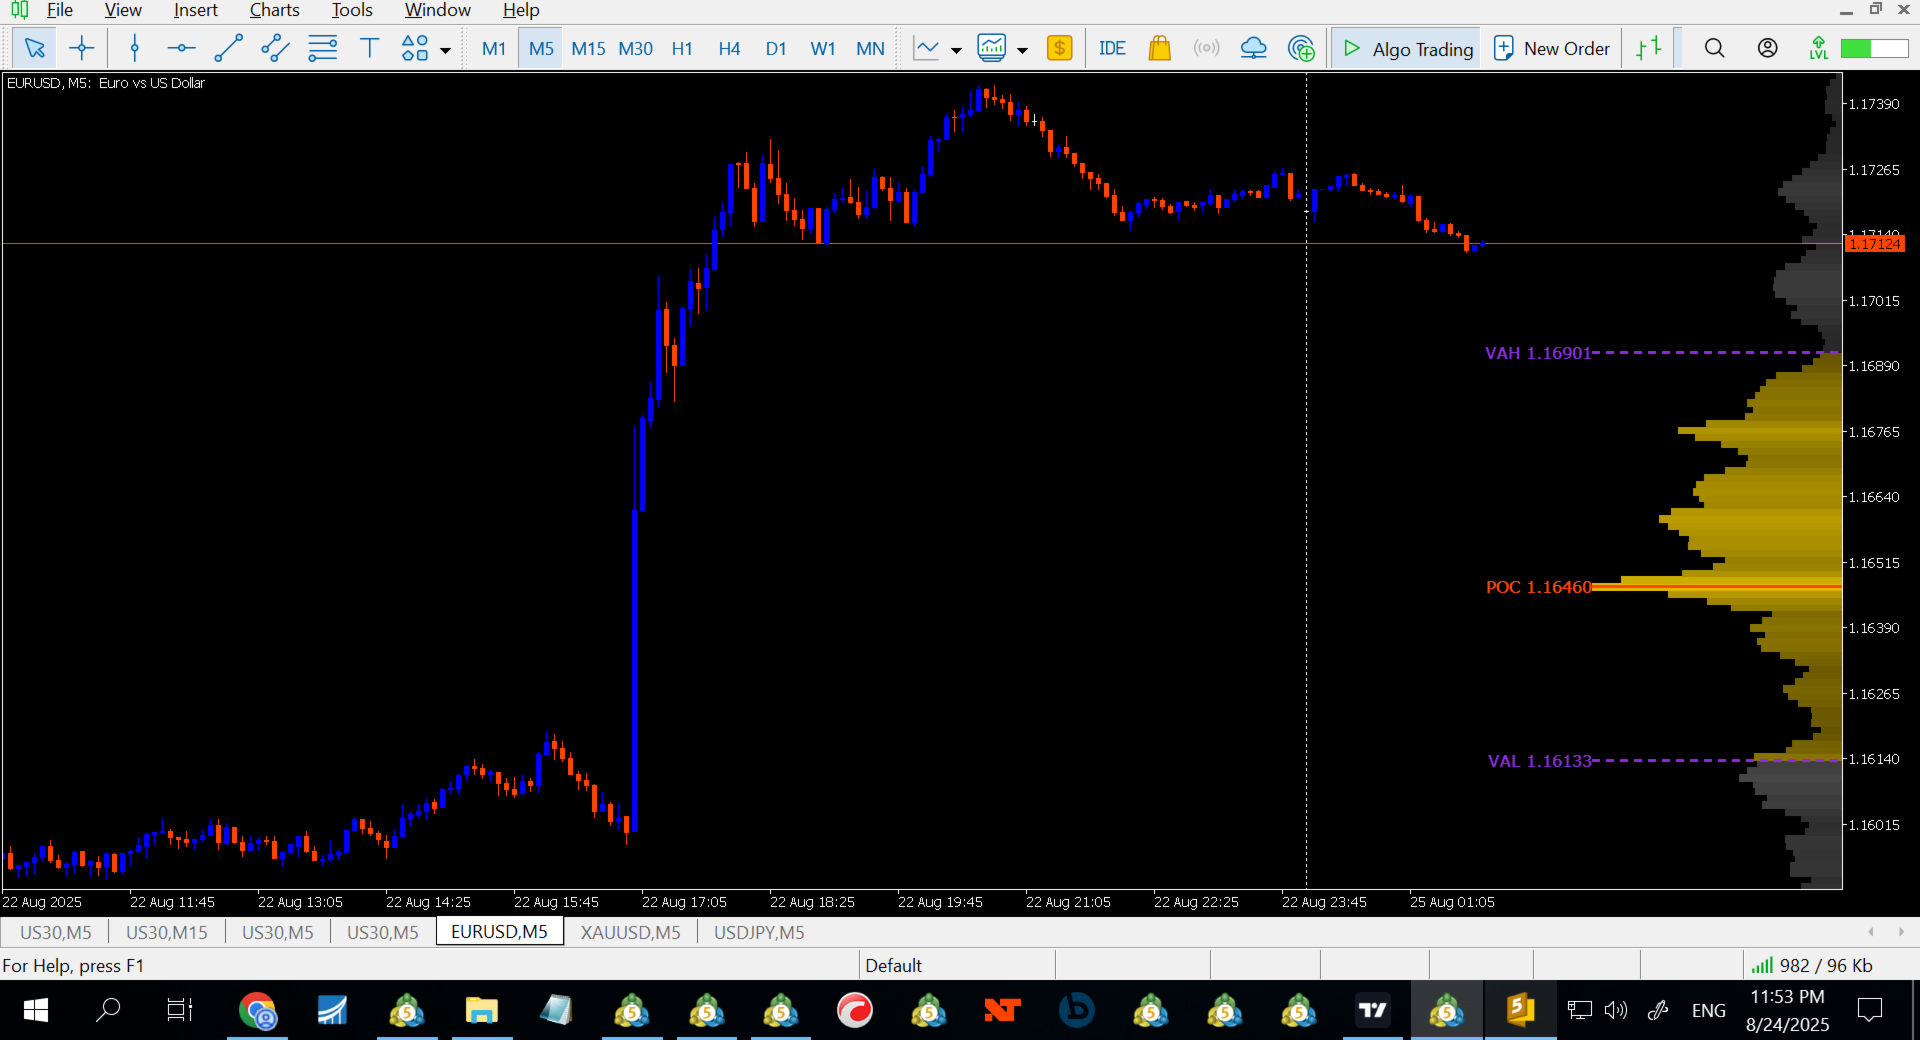
VAP is a right-anchored Volume Profile Heatmap for MetaTrader 5 designed for clean, fast, and stable execution on any chart. It shows where trading activity clustered, not just when—so you can read balance/imbalance, spot value migration, and plan trades with precise references: VAH, VAL, and POC.

What VAP shows

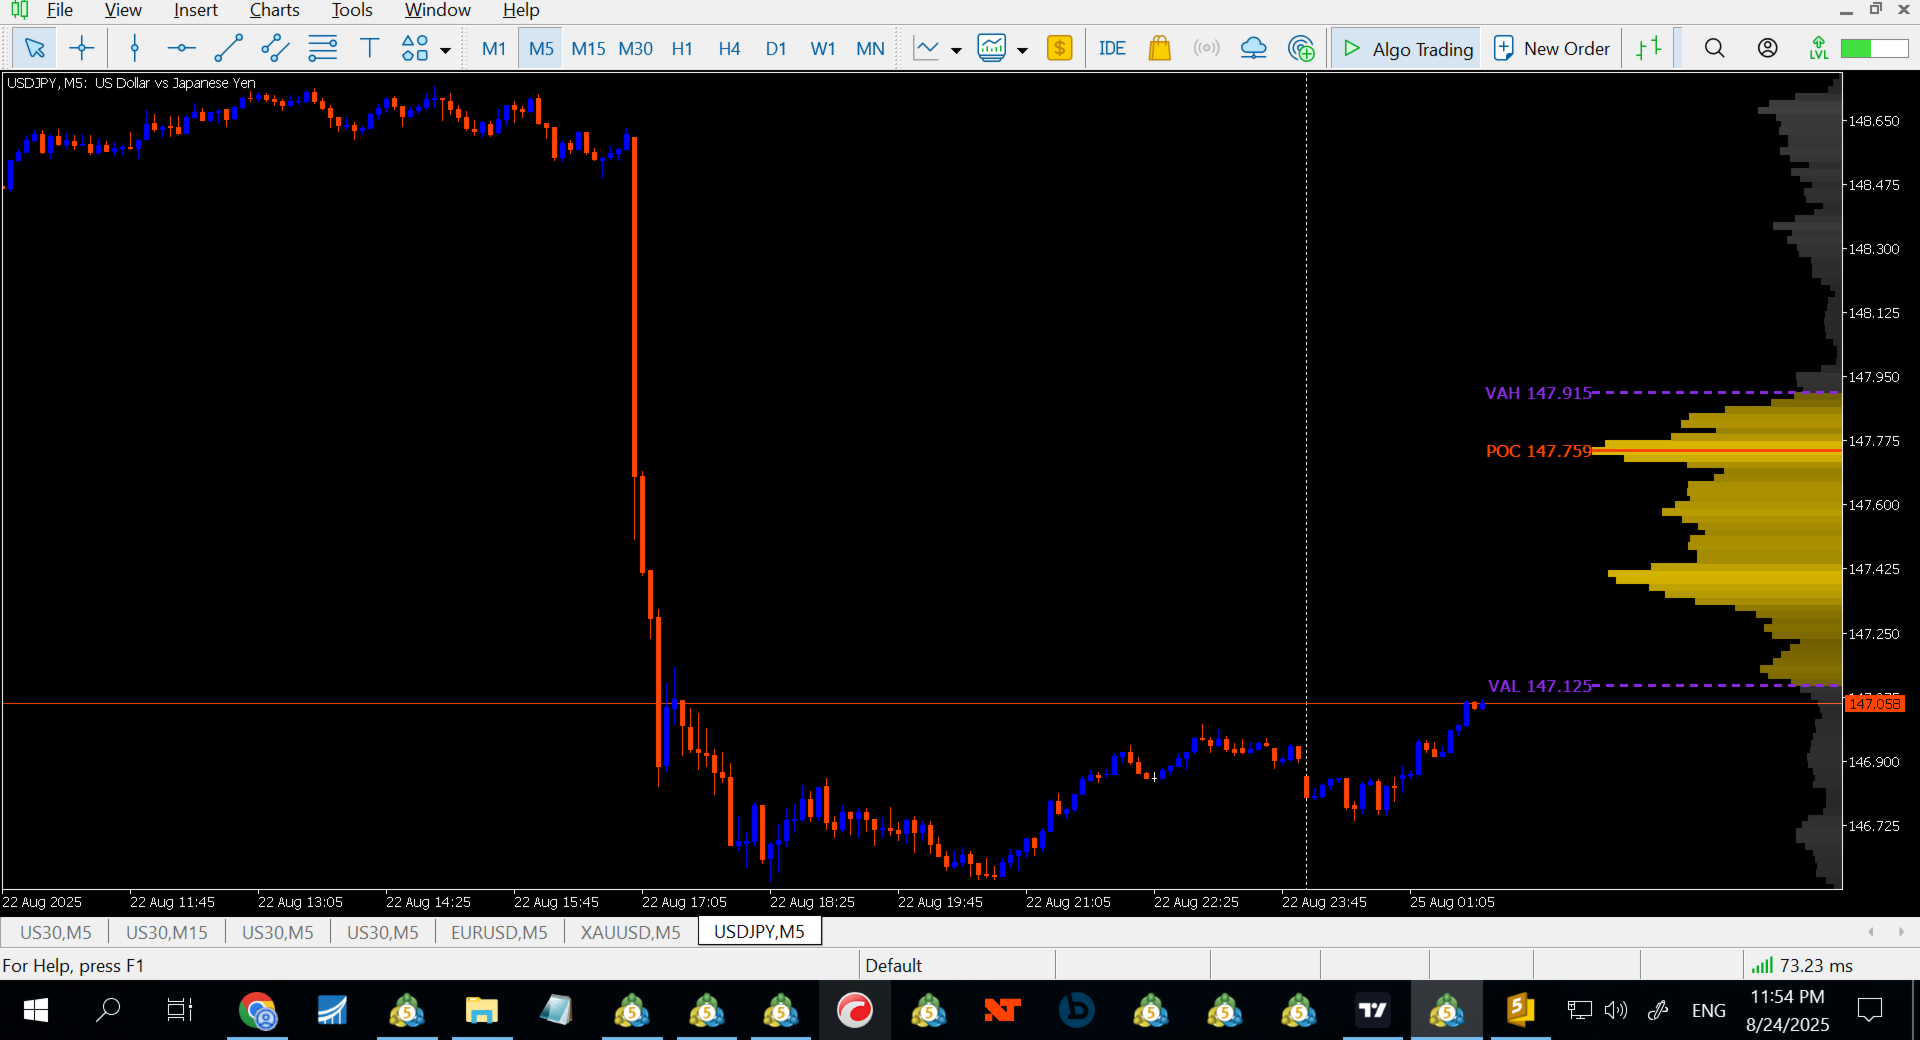
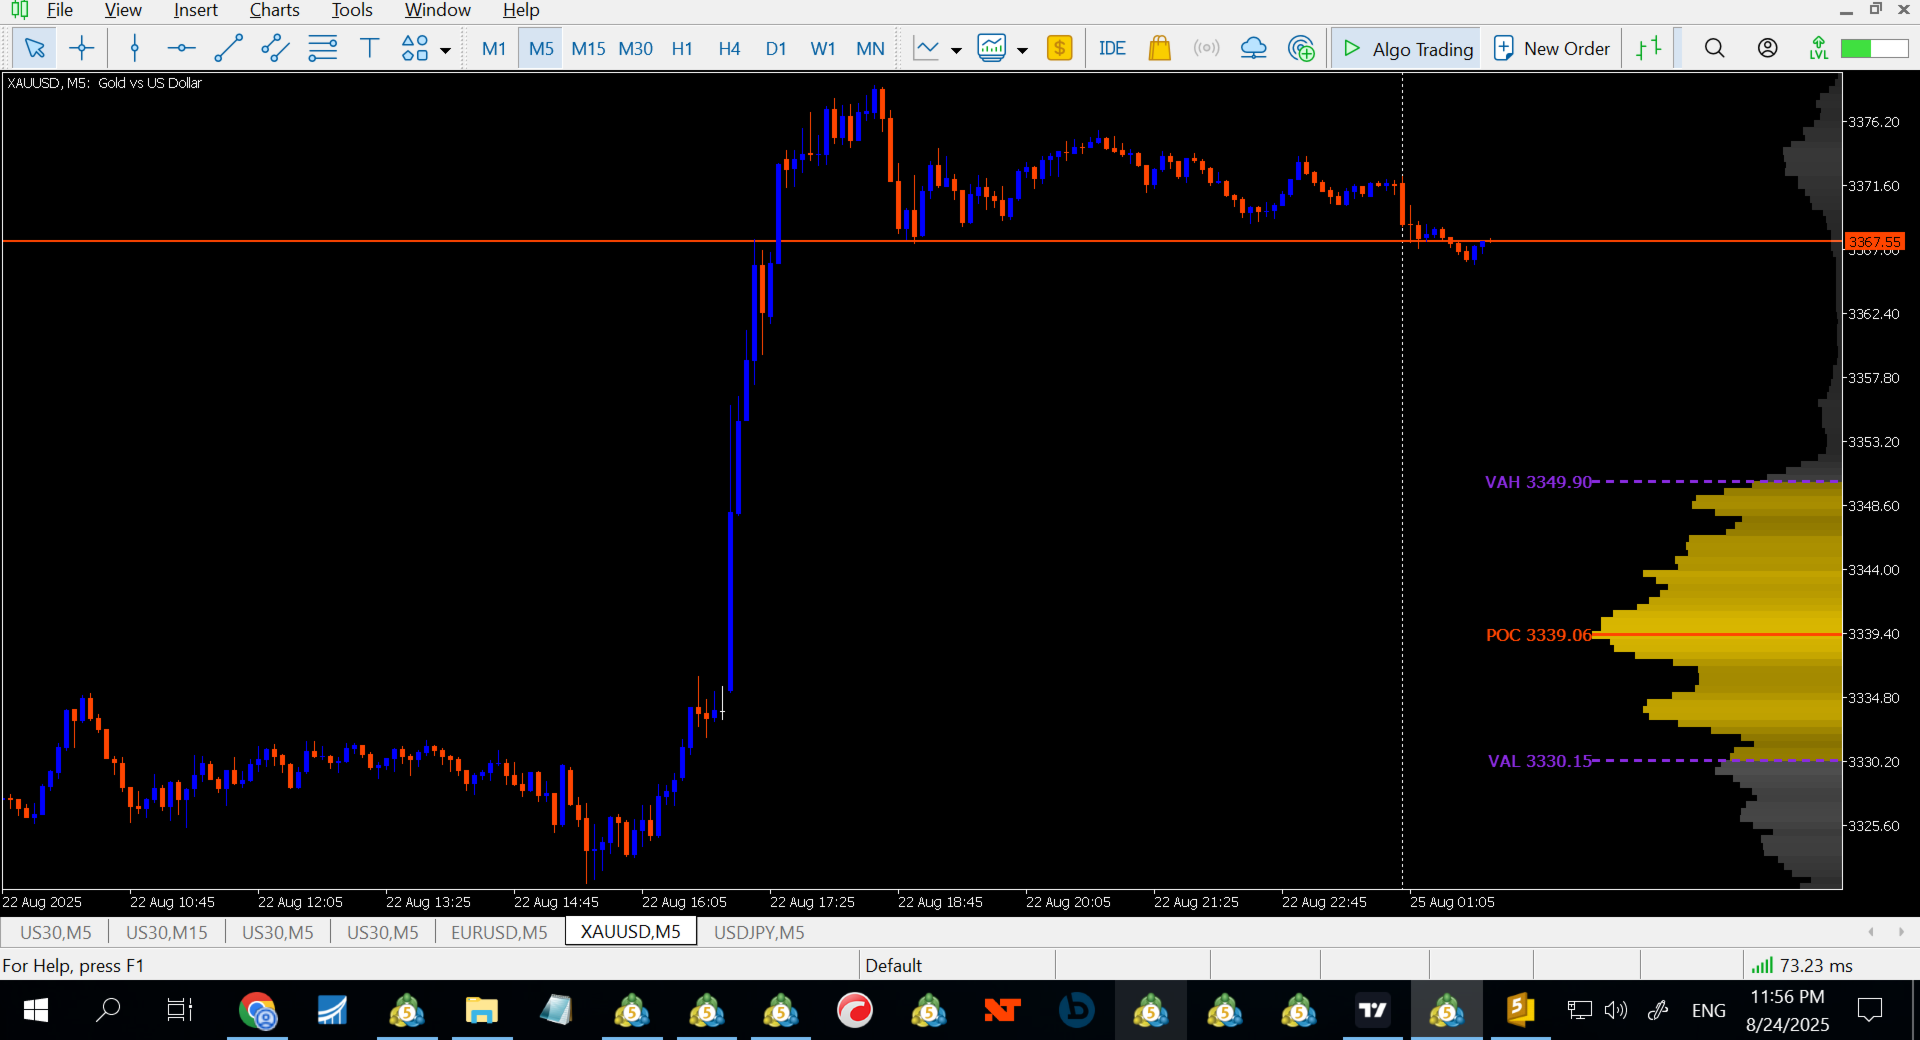
  • Heatmap Profile (tick-volume):
    A compact, right-anchored histogram that scales with the chart.

    • Value Area (~70%) in Gold

    • Non-Value in White

    • Soft shadow gradient for depth and quick read

  • POC (Point of Control):
    Solid Orange-Red line (width 3) across the iceberg’s depth, with label and price.

  • VAH / VAL:
    Blue-Violet dashed lines (width 3) at the true edges of Value, with labels and prices.

  • Labels in front of the lines:
    The text is aligned at the “front” (left end) of the line with 0 spacing, so the number always matches the level you see.

VAP uses tick volume provided by your broker. Across brokers, totals can differ; the structure and levels generally remain consistent.

Why traders like it

  • Anchored & stable: The profile clamps to the rightmost visible bars—zoom or scroll and VAP stays put.

  • Clean visuals: A single “iceberg” with shadow tonality; no clutter, no flicker.

  • Actionable levels: VAH/VAL/POC align with the histogram’s geometry, so what you see is what you trade.

  • Timeframe-agnostic: Works on M1 to MN, and on Forex, indices, crypto, metals, and futures-style symbols (with tick data).

Core logic (short & transparent)

  1. The indicator builds a histogram of tick volume between low–high of each bar in the chosen slice.

  2. The POC is the bin with the highest accumulated volume.

  3. The Value Area expands from the POC outwards (left/right by price) until ~70% of total volume is covered.

  4. VAH is the top edge of the VA; VAL is the bottom edge.

  5. Lines are drawn exactly at those edges; labels print the same price used for the line.

Typical uses

  • Mean-reversion: Fade tests of VAL/VAH within a balanced day/week; target mid/POC.

  • Breakout & Go: When price accepts above VAH (or below VAL) and the profile shifts, follow the move into the new value.

  • Confluence: Align VAP levels with session highs/lows, ADR, key S/R, or your order-flow triggers.

  • Context: Compare successive days/weeks to see value migration (up, down, or unchanged).

(Trading involves risk. VAP does not generate signals; it provides structure.)

Inputs (concise)

Slice & cadence

  • Slice – Day / Week / Month (default: Week)

  • Timer (sec) – 2 by default; refresh cadence

Geometry

  • Bins – number of price rows in the histogram (default 120)

  • Max profile width (px) – iceberg max thickness (default 250)

  • Right pad (px) – gap from price axis (default 0)

  • Min bar thickness (px) – minimum row width, keeps slim profiles visible

Colors & style

  • VA color – Gold

  • Non-VA color – White

  • VAH/VAL color – BlueViolet (dashed)

  • POC color – OrangeRed (solid)

  • Line width – 3

  • Dash length / gap – dash geometry

  • Label font size – 21

Mode

  • Render mode – Canvas (default) or Objects

    • Canvas = best performance & visuals

    • Objects = standard chart objects for users who prefer them

Tips for best results

  • Leave Canvas as default for the smoothest, flicker-free experience.

  • On very volatile symbols, you can increase Bins (e.g., 160–200) for finer price resolution.

  • If your broker’s tick volume is sparse on higher TFs, build profiles on M5–H1 slices for intraday, H1–H4 for swing.

  • Combine VAP with your entry model (e.g., footprint, DOM, candle patterns). Use VAP levels for location, not timing.

Known nuances (good to know)

  • Tick volume ≠ exchange volume. It tracks activity well on FX/CFD; absolute numbers differ by broker.

  • Rounding: Prices and lines are printed to the symbol’s native digits.

  • Closed vs open market: When the market is closed, minor differences can appear until live ticks resume.

  • Objects mode: Provided for flexibility. If you mass-clone charts with many object indicators, MT5 can slow down—Canvas is lighter.

Installation & use

  1. Copy Volume at Price (VAP) into MQL5/Indicators and compile.

  2. Attach to any chart.

  3. Choose Slice: Day/Week/Month .

  4. (Optional) Adjust Bins and Max profile width (px) to taste.

  5. Trade around VAH / VAL / POC with your strategy.

Changelog

v1.0

  • Initial release: right-anchored Canvas heatmap, VA (~70%), POC, VAH/VAL lines with labels, weekly default slice, 2-second redraw, white non-value, gold value, purple VA lines, orange-red POC, label font 21, zero-gap front alignment. Optional Objects render mode.

FAQ

Q: Does VAP repaint?
A: No. The profile updates as new bars/ticks add volume to the current slice (day/week/month). Historical slices are fixed.

Q: Why do my numbers differ from another platform?
A: Different brokers feed different tick streams. Structure is typically consistent; exact totals can vary.

Q: Can I plot multiple profiles?
A: Yes—attach multiple instances with different slices or colors.

Q: Will VAP slow my platform?
A: Canvas mode is optimized. If you load dozens of heavy indicators per chart, consider reducing Bins or timer frequency.

License & support

  • Single-user license per MQL5 Market policy.

  • Free updates within the major version.

  • Questions or suggestions? Reach out via MQL5 messages—feedback is welcome.

Give your charts location, not noise.
With VAP, you’ll see where the market cared most—so you can decide what to do next.


Produtos recomendados
Delta Profile Volume
Teresinha Moraes Correia
Descrição Técnica do Indicador – Delta Profile para MetaTrader 5 O Delta Profile é um indicador desenvolvido para o MetaTrader 5 com foco em análise detalhada do fluxo de volume dentro de um intervalo definido de candles. Ele organiza e exibe informações sobre o desequilíbrio de volumes positivos (associados a movimentos de alta) e negativos (associados a movimentos de baixa) em diferentes níveis de preço. O resultado é uma visão clara dos pontos do gráfico onde há maior concentração de negócios
Blahtech VWAP MT5
Blahtech Limited
5 (1)
Was: $69  Now: $49   Blahtech VWAP - Volume Weighted Average Price (VWAP) is the ratio of price to total volume. It provides an average price over a specified time interval.  Links [  Install  |  Update  |  Documentation   ] Feature Highlights Configurable VWAP Line Sessions, intervals, anchored or continuous Previous day settlement line Standard Deviation bands Alerts at bar close or real time Automatic Broker or Tick volumes Significantly reduced CPU usage Input Parameters Expert Advisor Mo
Value Chart Candlesticks
Flavio Javier Jarabeck
4.69 (13)
The idea of a Value Chart indicator was presented in the very good book I read back in 2020 , " Dynamic Trading Indicators: Winning with Value Charts and Price Action Profile ", from the authors Mark Helweg and David Stendahl. The idea is simple and the result is pure genius: Present candlestick Price analysis in a detrended way! HOW TO READ THIS INDICATOR Look for Overbought and Oversold levels. Of course, you will need to test the settings a lot to find the "correct" one for your approach. It
FREE
Advanced Volume Profile
Henry Armando Baltazar
Advanced Volume Profile Liquidity Analysis via Custom Area Selection The Advanced Manual Volume Profile is a precision tool for MetaTrader 5 designed to deconstruct market structure through price-level volume analysis. Unlike static profiles, this indicator exclusively processes the price and time range defined by the user via a rectangle object, offering a surgical view of the market auction. Elite Technical Specifications Dynamic Algorithm: Real-time calculation (400ms refresh rate) based on t
MW Volume
Martin Bittencourt
3.8 (5)
O indicador de volume da Martinware desenha uma média móvel colorida sobre as barras de volume. A coloração usa três cores e pode ser feita de diferentes maneiras, escolhidas pelo usuário e aplicada tanto à média quanto às barras de volume. São possíveis três tipos de coloração: Nenhuma: nenhuma coloração é feita Aumentando ou diminuindo: muda a cor dependendo do valor atual ser maior ou menor que o valor anterior Volume relativo à média: as cores variam se o volume atual for maior ou menor
FREE
Enhanced Volume Profile: The Ultimate Order Flow & Liquidity Analysis Tool Overview Enhanced Volume Profile is an indicator for MetaTrader 5 that displays the traded volume at specific price levels over a defined period. It separates the total volume into buy and sell components, presenting them as a side-by-side histogram on the chart. This allows users to observe the volume distribution and the proportion of buy and sell volumes at each price level. Graphics Rendering The indicator uses the
FREE
Aggression Volume Profile
Edson Cavalca Junior
4.55 (11)
Esse indicador plota no gráfico o perfil de volume por Preço Há 5 formas de visualização: Por Volume Total negociado;  (Premium Version); Volume em Ticks (Forex);  Separado por Compradores e Vendedores;  (Premium Version); Somente Compradores;  (Premium Version); Somente Vendedores e;  (Premium Version); Saldo de negócios (Compradores - Vendedores).  (Premium Version); É possível selecionar quantos dias será calculado os perfis. (Premium Version); No dia atual ele recalcula os dados do histog
FREE
Market Profile 3 ForexArby com
Hussien Abdeltwab Hussien Ryad
4 (15)
Market Profile 3 MetaTrader 5 indicator  version 4.70— is a classic Market Profile implementation that can show the price density over time, outlining the most important price levels, value area, and control value of a given trading session. This indicator can be attached to timeframes between M1 and D1 and will show the Market Profile for daily, weekly, monthly, or even intraday sessions. Lower timeframes offer higher precision. Higher timeframes are recommended for better visibility. It is als
FREE
O indicador mede o saldo de agressão acumulado. A fórmula é a seguinte: Acumulado = Acumulado do Candle Anterior + Volume de Compra - Volume de Venda. Conheça Nossos Produtos    ***** Gostou do produto? Então, nos ajude fazendo sua avaliação na aba " Comentário ".  ***** Nota:   Recomenda-se utilizar os valores padrões de configuração e VPS.  É necessário as informações de negociações(Time nd Sales). O indicador envia para o seu email ou celular informação quando o saldo acumulado inverte de
Mirror Chart MT5
Andrej Hermann
5 (1)
The Mirror Chart MT5 is a overlay indicator specifically designed to project a second financial instrument directly onto the main chart window. This tool is invaluable for traders who rely on correlation analysis, as it visualizes the price movements of two different instruments in real time. Unlike traditional overlays, this indicator utilizes intelligent, dynamic centering and scaling logic. It continuously analyzes the visible price range in the current window for both symbols and calculates
FREE
MT5 opnMAX Moirai
Nelson Rodrigo Caldeira Patrao
opnMAX Moirai: Indicator Overview opnMAX Moirai is an indispensable, sleek Heads-Up Display (HUD) utility designed for MQL5 traders who require absolute precision in timing and volatility monitoring. While visually non-intrusive, Moirai runs on a high-performance, second-by-second background timer engine. This ensures that clocks and countdowns tick smoothly and remain perfectly accurate even during periods of low liquidity when price ticks are sparse. Essential synergy for opnMAX EAs Moirai wa
FREE
Simple QM Pattern MT5
Suvashish Halder
4.5 (2)
Simple QM Pattern   is a powerful and intuitive trading indicator designed to simplify the identification of the Quasimodo (QM) trading pattern. The QM pattern is widely recognized among traders for effectively signaling potential   reversals   by highlighting key market structures and price action formations. This indicator helps traders easily visualize the QM pattern directly on their charts, making it straightforward even for those who are new to pattern trading. Simple QM Pattern includes d
FREE
Daily & Composite Volume Profile   This is a professional-grade market profile tool designed for MetaTrader 5. It utilizes a   Dual-Profile System   to visualize supply, demand, and liquidity concentrations. Key Features Left Side: Daily Session Profiles Automatically identifies the start and end of every trading day. Generates a unique Volume Profile for each individual day. Allows you to see how value migrated from yesterday to today (e.g., Is today's volume higher or lower than yesterday?).
Blahtech Supply Demand MT5
Blahtech Limited
4.54 (13)
Was: $299  Now: $99  Supply Demand uses previous price action to identify potential imbalances between buyers and sellers. The key is to identify the better odds zones, not just the untouched ones. Blahtech Supply Demand indicator delivers functionality previously unavailable on any trading platform. This 4-in-1 indicator not only highlights the higher probability zones using a multi-criteria strength engine, but also combines it with multi-timeframe trend analysis, previously confirmed swings a
Price Magnet — Price Density and Attraction Levels Indicator Price Magnet is a professional analytical tool designed to identify key support and resistance levels based on statistical Price Density. The indicator analyzes a specified historical period and detects price levels where the market spent the most time. These zones act as “magnets,” attracting price action or forming a structural base for potential reversals. Unlike traditional Volume Profile tools, Price Magnet focuses on price-time d
PZ Penta O MT5
PZ TRADING SLU
3.5 (4)
The Penta-O is a 6-point retracement harmonacci pattern which usually precedes big market movements. Penta-O patterns can expand and repaint quite a bit. To make things easier this indicator implements a twist: it waits for a donchian breakout in the right direction before signaling the trade. The end result is an otherwise repainting indicator with a very reliable trading signal. The donchian breakout period is entered as an input. [ Installation Guide | Update Guide | Troubleshooting | FAQ | A
FREE
Was: $249  Now: $99   Market Profile defines a number of day types that can help the trader to determine market behaviour. A key feature is the Value Area, representing the range of price action where 70% of trading took place. Understanding the Value Area can give traders valuable insight into market direction and establish the higher odds trade. It is an excellent addition to any system you may be using. Inspired by Jim Dalton’s book “Mind Over Markets”, this indicator is designed to suit the
Aggression Volume
Flavio Javier Jarabeck
4.29 (17)
O Indicador de Volume de Agressão é o tipo de indicador que raramente é encontrado na comunidade MQL5 porque não é baseado nos dados de Volume padrão fornecidos pela plataforma Metatrader 5. Ele requer a análise de todos os Ticks de tráfego solicitados na plataforma... Dito isso, o indicador de Volume de Agressão solicita todos os Dados de Tick do seu Broker e os processa para construir uma versão muito especial de um Indicador de Volume, onde as agressões de Compradores e Vendedores são plotada
FREE
Volume-to-Price Movement Oscillator (VP Oscillator) for MT5 The VP Oscillator highlights the balance (or imbalance) between trading volume and price movement, helping traders spot hidden accumulation, distribution, or weakening trends. How It Works: Calculates each bar’s price range (High–Low) and tick volume. Normalizes both values over a set period (default: 14). Plots the absolute difference between them ×100 — showing how closely price action aligns with trading activity. Interpretation: Hig
FREE
BoxInside MT5
Evgeny Shevtsov
5 (4)
This indicator calculates the volume profile and places labels that correspond to the VAH, VAL and POC levels, for each candle individually. Indicator operation features The indicator works on the timeframes from M3 to MN, but it uses the history data of smaller periods: M1 - for periods from M3 to H1, M5 - for periods from H2 to H12, M30 - for the D1 period, H4 - for the W1 period, D1 - for the MN period. The color and location of the VAL, VAH and POC labels on the current candle are considere
FREE
Você utiliza o volume na sua leitura do mercado? Certamente muitos traders usam, e não se imaginam operando sem ele. O indicador Color Histogram Volume Set permite que o usuário escolha o valor que ele considera interessante para monitorar. Ao ultrapassar este você terá a confirmação visual e se quiser terá também o alerta sonoro que é dado pelo indicador. Claro que existem outras maneiras de tentar encontrar um volume elevado, como avaliar se o v olume está acima da média, se é o maior volum
Waves Sizer
Flavio Javier Jarabeck
3.86 (7)
Wyckoff fans, enjoy! Ideally to be used with the Weis Waves indicator, but it can be easily used alone, the Waves Sizer puts the range (in resulting Price movement) done by the Price on its market swings. You can control how accurate or loose will be the swings. This tool is very helpful for visually know how much the Price has traveled in your Timeframe. This way you can confront this level of effort with the resulting Volume, etc... Weis Waves indicator: https://www.mql5.com/en/market/produc
FREE
Statistical Arbitrage Spread Generator for Cointegration [MT5] What is Pair Trading? Pair trading is a market-neutral strategy that looks to exploit the relative price movement between two correlated assets — instead of betting on the direction of the market. The idea? When two assets that usually move together diverge beyond a statistically significant threshold, one is likely mispriced. You sell the expensive one, buy the cheap one , and profit when they converge again. It’s a statistica
FREE
Phantom Edge SMC
Nattapon Chuekamhod
Phantom Edge SMC — The Ultimate Smart Money Indicator for MT5 Tired of manually drawing structures while trading SMC or ICT concepts? Let Phantom Edge SMC do the heavy lifting for you. Key Features Internal & Swing Structure: Automatically detects BOS and CHoCH across two structural levels. Order Blocks (OB): Identifies Internal and Swing OBs with automated mitigation tracking. Equal Highs / Lows: Highlights EQH / EQL to pinpoint Liquidity pools. Fair Value Gaps (FVG): Displays FVGs with
VP hidden
Emr Aljnaby
4.33 (12)
The indicator works to convert normal volume into levels and determine financial liquidity control points. It is very similar in function to Fixed Volume Profile. But it is considered more accurate and easier to use than the one found on Trading View because it calculates the full trading volumes in each candle and in all the brokers present in MetaTrade, unlike what is found in Trading View, as it only measures the broker’s displayed prices. To follow us on social media platforms: telegram
FREE
Pare de perder trades por erros de execução. Opere com precisão e controle total de risco. Painel de trading manual para MT5 focado em scalping e intraday. Execução em um clique com controle de risco rigoroso, gestão de trades e sistema de disciplina integrado. Desenvolvido para scalping de alta velocidade, este painel de execução oferece entradas precisas, gestão eficiente e consistência operacional. Opere mais rápido. Opere melhor. Opere com controle. Construído
Cumulative Delta MT5
Evgeny Shevtsov
4.53 (62)
The indicator analyzes the volume scale and splits it into two components - seller volumes and buyer volumes, and also calculates the delta and cumulative delta. The indicator does not flicker or redraw, its calculation and plotting are performed fairly quickly, while using the data from the smaller (relative to the current) periods. The indicator operation modes can be switched using the Mode input variable: Buy - display only the buyer volumes. Sell - display only the seller volumes. BuySell -
FREE
This indicator has been developed to identify and display these trends quickly and easily, allowing you to see instantly, those currency pairs which are trending, and those which are not – and in all timeframes, with just one click. The 28 currency pairs are displayed as a fan as they sweep from strong to weak and back again, and this is why we call it the ‘currency array’. All 28 pairs are arrayed before you, giving an instant visual description of those pairs that are trending strongly, those
TPO Profile MT5
Kyra Nickaline Watson-gordon
Definition : TPO is a Time Price Opportunity. Instead of using bars or candles with an Open, High, Low, and Close price, each "bar" in a Market Profile is represented by horizontal bars against the price It is called Market Profile terminology. In other words time-price-opportunity (TPO) profiles are histograms of how much time was spent at each price within the span of the profile. By using a TPO chart, you are able to analyze the amount of trading activity, based on time, for each price level
Advanced Volume Profile Analysis Tool for MetaTrader 5 The Kecia Volume Profile Order Finder provides traders with volume profile analysis capabilities. This MT5 indicator combines volume profile visualization with statistical calculations to help identify potential trading opportunities and suggests entry, stop loss, and take profit levels based on market structure. Market Profile Visualization Transform your chart with customizable volume profile visualizations: Multiple visualization options
Os compradores deste produto também adquirem
Azimuth Pro
Ottaviano De Cicco
5 (6)
Azimuth Pro V2: Estrutura Fractal Sintética e Entradas Confirmadas para MT5 Visão geral Azimuth Pro é um indicador de estrutura swing multinível da Merkava Labs . Quatro camadas de swing aninhadas, VWAP ancorado em swings, detecção de padrões ABC, filtragem estrutural de três timeframes e entradas confirmadas em barra fechada — um gráfico, um fluxo de trabalho dos micro-swings aos macro-ciclos. Este não é um produto de sinais cegos. É um fluxo de trabalho baseado em estrutura para traders que v
OmniSync Projection
Antonio-alin Teculescu
5 (1)
Chronos Fractal Engine is an innovative price projection indicator for MetaTrader 5, designed to transform your technical analysis by intelligently identifying and projecting historical price patterns. Built upon an advanced correlation algorithm and the fractal principles of the market, this powerful tool visualizes potential future price movements, giving you a unique edge in your trading decisions. What is Chronos Fractal Engine? At its core, the Chronos Fractal Engine employs a sophisticat
ARICoins
Temirlan Kdyrkhan
ARICoin is a powerful trading companion designed to generate high-probability entry signals with dynamic TP/SL/DP levels based on volatility. Built-in performance tracking shows win/loss stats, PP1/PP2 hits, and success rates all updated live. Key Features: Buy/Sell signals with adaptive volatility bands Real-time TP/SL/DP levels based on ATR Built-in MA Filter with optional ATR/StdDev volatility Performance stats panel (Success, Profit/Loss, PP1/PP2) Alerts via popup, sound, push, or email Cust
Antes de tudo, vale ressaltar que esta Ferramenta de Negociação é um Indicador Não Repintante, Não Redesenhante e Não Atrasado, o que a torna ideal para negociação profissional. Curso online, manual do utilizador e demonstração. O Indicador de Conceitos de Ação de Preço Inteligente é uma ferramenta muito poderosa tanto para traders novos quanto experientes. Ele combina mais de 20 indicadores úteis em um único, combinando ideias avançadas de negociação como Análise do Trader do Círculo Interno
Bill Williams Advanced
Siarhei Vashchylka
5 (11)
Bill Williams Advanced is designed for automatic chart analysis using Bill Williams' "Profitunity" system. The indicator analyzes four timeframes at once. Manual (Be sure to read before purchasing) Advantages 1. Analyzes the chart using Bill Williams' "Profitunity" system. Signals are displayed in a table in the corner of the screen and on the price chart. 2. Finds all known AO and AC signals, as well as zone signals. Equipped with a trend filter based on the Alligator. 3. Finds "Divergence Bar
RelicusRoad Pro: Sistema Operacional Quantitativo de Mercado 70% DE DESCONTO ACESSO VITALÍCIO (TEMPO LIMITADO) - JUNTE-SE A 2.000+ TRADERS Por que a maioria dos traders falha mesmo com indicadores "perfeitos"? Porque eles operam Conceitos Únicos no vácuo. Um sinal sem contexto é uma aposta. Você precisa de CONFLUÊNCIA . RelicusRoad Pro não é um simples indicador de seta. É um Ecossistema Quantitativo de Mercado completo. Ele mapeia a "Estrada do Valor Justo", distinguindo ruído de rupturas estru
Berma Bands
Muhammad Elbermawi
5 (8)
O indicador Berma Bands (BBs) é uma ferramenta valiosa para traders que buscam identificar e capitalizar tendências de mercado. Ao analisar a relação entre o preço e os BBs, os traders podem discernir se um mercado está em uma fase de tendência ou de variação. Visite o [ Blog Berma Home ] para saber mais. As Bandas de Berma são compostas por três linhas distintas: a Banda de Berma Superior, a Banda de Berma Média e a Banda de Berma Inferior. Essas linhas são plotadas em torno do preço, criando u
ARIPoint
Temirlan Kdyrkhan
ARIPoint is a powerful trading companion designed to generate high-probability entry signals with dynamic TP/SL/DP levels based on volatility. Built-in performance tracking shows win/loss stats, PP1/PP2 hits, and success rates all updated live. Key Features: Buy/Sell signals with adaptive volatility bands Real-time TP/SL/DP levels based on ATR Built-in MA Filter with optional ATR/StdDev volatility Performance stats panel (Success, Profit/Loss, PP1/PP2) Alerts via popup, sound, push, or email Cu
AriX
Temirlan Kdyrkhan
1 (4)
AriX Indicator for MT5 A powerful trend-following and signal-evaluation tool AriX is a custom MT5 indicator that combines Moving Averages and ATR-based risk/reward logic to generate clear buy/sell signals. It visualizes dynamic SL/TP levels, evaluates past trade outcomes, and displays win/loss statistics in a clean on-chart panel. Key features include: Buy/Sell signals based on MA crossovers ATR-based SL/TP1/TP2/TP3 levels with visual lines and labels Signal outcome tracking with real-time stat
Meravith MT5
Ivan Stefanov
5 (1)
Ferramenta dos market makers. O Meravith irá: Analisar todos os timeframes e exibir a tendência atual em vigor. Destacar zonas de liquidez (equilíbrio de volume) onde o volume comprador e vendedor é igual. Mostrar todos os níveis de liquidez de diferentes timeframes diretamente no seu gráfico. Gerar e apresentar análise de mercado em formato de texto para sua referência. Calcular alvos, níveis de suporte e pontos de stop-loss com base na tendência atual. Calcular a relação risco/retorno das suas
FX Analysis – Multi-Tool Trading Dashboard for MetaTrader 5 FX Analysis is an all-in-one MT5 indicator that consolidates eight analytical tools into a single interactive dashboard, helping traders identify high-probability setups without switching between multiple indicators. COMPONENT 1. Volatility Analyzer Displays historical average movement by hour and by day of the week. A real-time "Pip Balance" shows the remaining expected range for the current session. Example: if the daily average is
O indicador " Dynamic Scalper System MT5 " foi desenvolvido para o método de scalping, operando dentro de ondas de tendência. Testado nos principais pares de moedas e ouro, é possível a compatibilidade com outros instrumentos de negociação. Fornece sinais para a abertura de posições de curto prazo ao longo da tendência, com suporte adicional para o movimento dos preços. O princípio do indicador: As setas grandes determinam a direção da tendência. Um algoritmo para gerar sinais de scalping sob
Introduction to X3 Chart Pattern Scanner X3 Cherart Pattern Scanner is the non-repainting and non-lagging indicator detecting X3 chart patterns including Harmonic pattern, Elliott Wave pattern, X3 patterns, and Japanese Candlestick patterns. Historical patterns match with signal patterns. Hence, you can readily develop the solid trading strategy in your chart. More importantly, this superb pattern scanner can detect the optimal pattern of its kind. In addition, you can switch on and off individu
Este indicador é um indicador para análise automática de ondas que é perfeito para negociações práticas! Caso... Nota:   Não estou acostumado a usar nomes ocidentais para classificação de ondas. Devido à influência da convenção de nomenclatura de Tang Lun (Tang Zhong Shuo Zen), nomeei a onda básica como   uma caneta   e a banda de onda secundária como   um segmento   . ao mesmo tempo, o segmento tem a direção da tendência.   O segmento de tendência principal   é nomeado (esse método de nomencl
Ajuda a determinar se este ponto é adequado para comprar. Ajuda a determinar se este ponto é adequado para vender. Quando os quatro indicadores atingem o fundo ao mesmo tempo, concentre-se nas oportunidades de repique. Quando os quatro indicadores estão simultaneamente no topo, concentre-se nas oportunidades de queda. Este sistema foi desenvolvido com base em tecnologia algorítmica chinesa avançada e em uma estrutura de modelagem matemática de alto nível. Eu uso este indicador principalmente no
Ace Trend
Mikhail Sergeev
5 (3)
Apresentamos-lhe um indicador revolucionário que muda as regras do jogo no mundo da negociação de tendências. O indicador foi projetado para repensar o desempenho e elevar sua experiência de negociação a uma altura sem precedentes. Nosso indicador possui uma combinação única de recursos avançados que o diferenciam da concorrência. A tecnologia de ponta "Real Pricing Factors" oferece estabilidade incomparável, mesmo nas condições de mercado mais desafiadoras e voláteis. Diga adeus a padrões instá
OrderFlow Absorption – Indicador Profissional de Delta e Sinais de Absorção para MT5 Desbloqueie o poder da verdadeira análise de fluxo de ordens com o OrderFlow Absorption – o indicador definitivo de histograma de delta e sinais de absorção para MetaTrader 5. Desenvolvido para traders que desejam enxergar o que realmente acontece por trás de cada movimento de preço, esta ferramenta revela pressões ocultas de compra/venda e eventos de absorção que movimentam o mercado. Recursos Visualização do H
O Oscilador de Índice de Precisão (Pi-Osc) de Roger Medcalf da Precision Trading Systems A Versão 2 foi cuidadosamente reconfigurada para carregar rapidamente em seu gráfico, e algumas outras melhorias técnicas foram incorporadas para aprimorar a experiência. O Pi-Osc foi criado para fornecer sinais precisos de temporização de negociações projetados para encontrar pontos de exaustão extremos, os pontos para os quais os mercados são forçados a ir apenas para tirar as ordens de todos. Este pro
Moon Cycle
Navdeep Singh Kaur
Indicador técnico que utiliza o algoritmo astronômico de Jean Meeus para exibir fases lunares em gráficos de trading. Apresenta linha curva contínua representando o ciclo lunar com precisão científica equivalente a observatórios profissionais. Compatível com qualquer símbolo e timeframe no MT5, incluindo forex, commodities, índices e ações. Inclui painel informativo mostrando fase lunar atual, percentual de iluminação e níveis de referência para análise técnica. Configurações de cor e estilo co
Owl Smart Levels MT5
Sergey Ermolov
4.03 (32)
Ao operar a favor da tendência, a principal dificuldade não é encontrar um nível, mas entender onde uma entrada é realmente válida. O preço frequentemente reage aos níveis, mas não consegue dar continuidade — o que leva a entradas falsas ou movimentos perdidos. Owl Smart Levels não apenas mostra níveis , mas zonas formadas com base na estrutura do mercado e nos pullbacks. Isso permite avaliar os pontos de entrada de forma diferente e evitar parte dos sinais falsos. O que está incluído no sistem
ARIScalping
Temirlan Kdyrkhan
ARIScalp is a powerful trading companion designed to generate high-probability entry signals with dynamic TP/SL/DP levels based on volatility. Built-in performance tracking shows win/loss stats, PP1/PP2 hits, and success rates all updated live. Key Features: Buy/Sell signals with adaptive volatility bands Real-time TP/SL/DP levels based on ATR Built-in MA Filter with optional ATR/StdDev volatility Performance stats panel (Success, Profit/Loss, PP1/PP2) Alerts via popup, sound, push, or email Cus
Meta Cipher B
SILICON HALLWAY PTY LTD
Meta Cipher B: O conjunto de osciladores tudo-em-um para MT5 Meta Cipher B traz o popular conceito do Market Cipher B para o MetaTrader 5, otimizado para velocidade e precisão. Desenvolvido do zero para máximo desempenho, ele oferece sinais de nível profissional sem atrasos nem lentidão. Embora seja poderoso por si só, o Meta Cipher B também foi projetado para funcionar naturalmente com o Meta Cipher A , oferecendo um contexto de mercado completo e confirmações mais profundas. O que ele faz Um
TPA True Price Action indicator reveals the true price action of the market makers through 100% non-repainting signals strictly at the close of a candle! TPA shows entries and re-entries, every time the bulls are definitely stronger than the bears and vice versa. Not to confuse with red/green candles. The shift of power gets confirmed at the earliest stage and is ONE exit strategy of several. There are available now two free parts of the TPA User Guide for our customers. The first "The Basics"
GEM Signal Pro GEM Signal Pro é um indicador seguidor de tendência para MetaTrader 5, desenvolvido para traders que desejam sinais mais claros, setups mais estruturados e uma gestão de risco mais prática diretamente no gráfico. Em vez de mostrar apenas uma seta simples, o GEM Signal Pro ajuda a apresentar a ideia completa da operação de forma mais clara e fácil de entender. Quando as condições são confirmadas, o indicador pode mostrar o preço de entrada, o stop loss e os alvos de take profit no
Native Channels
BeeXXI Corporation
5 (1)
This indicator recognizes all support and resistance levels. A number of unique high-performance techniques have been applied, which made the existence of this indicator possible. All formed channels are naturally visible: horizontal linear linear parabolic cubic (Polynomial 3 degrees - Wave) This is due to a bundle of approximating channels. The formed channels form "standing waves" in a hierarchical sequence. Thus, all support and resistance levels are visible. All parameter management is i
O indicador destaca as zonas onde há declaração de interesse no mercado e, em seguida, mostra a zona de acumulação de ordens . Ele funciona como um livro de ofertas em escala ampliada . Este é o indicador para o dinheiro grande . Seu desempenho é excepcional. Qualquer interesse que existir no mercado, você verá com clareza . (Esta é uma versão totalmente reescrita e automatizada — não é mais necessário fazer análise manual .) A Velocidade de Transação é um indicador de conceito novo que mostra o
The iChannels
BeeXXI Corporation
5 (2)
Ultra-fast recognition of parabolic channels (as well as linear, horizontal and wavy channels) throughout the depth of history, creating a hierarchy of channels. Required setting: Max bars in chart: Unlimited This indicator is designed primarily for algorithmic trading, but can also be used for manual trading.  This indicator will have a very active evolution in the near future and detailed descriptions on how to apply to create robots
VTrende Pro
Andrii Diachenko
5 (1)
VTrende Pro - MTF indicator for trend trading with a display panel for MT5 *** Videos can be translated into any language using subtitles (video language - Russian) Although the signals of the VTrende Pro indicator can be used as signals of a full-fledged trading system, it is recommended to use them in conjunction with the Bill Williams TS. VTrende Pro is an extended version of the VTrende indicator. Difference between Pro version and VTrende: - Time zones - Signal V - signal 1-2 waves -    S
Ultimate SMC Indicator
Hicham Mahmoud Almoustafa
1 (1)
Ultimate SMC Indicator v2.20 — Smart Money Concepts All-in-One Stop switching between 5 different indicators. Ultimate SMC gives you everything Smart Money traders need — in one clean indicator with interactive controls. GUIDE **What makes this different?** Most SMC indicators show you Order Blocks or FVGs separately. You still have to figure out which zones actually matter. Ultimate SMC does the hard work: it scans for Order Blocks, Fair Value Gaps, Liquidity Sweep
TrendMaestro5
Stefano Frisetti
note: this indicator is for METATRADER4, if you want the version for METATRADER5 this is the link:  https://www.mql5.com/it/market/product/108106 TRENDMAESTRO ver 2.5 TRENDMAESTRO recognizes a new TREND from the start, he never makes mistakes. The certainty of identifying a new TREND is priceless. DESCRIPTION TRENDMAESTRO identifies a new TREND in the bud, this indicator examines the volatility, volumes and momentum to identify the moment in which there is an explosion of one or more of these da
Mais do autor
Tired of losing money? Neuro_Inverted_Panel_EA is your solution — the ultimate manual trading panel for those ready to embrace inverted psychology! Simply attach the EA to your chart, set the maximum daily loss you're willing to accept (for smart risk control), and trade as you normally would — but without watching your "Toolbox" for open trades . This panel turns your typical losing habits into a winning strategy by flipping your decisions upside down — literally. Once attached, the panel displ
ARTIFICIAL INTELLIGENCE INVESTMENT TOOL. ATTACH TO THE CHART, LEAVE AND FORGET. VPS HIGHLY RECOMMENDED-INVESTMENT SYSTEM. (MQL5 VPS) RR_EA is an investment-grade swing trading EA with a built-in Artificial Intelligence decision engine. It has been specifically engineered to trade the US30(Dow Jones) and NASDAQ-100 index market. The internal AI trading logic is fully automated — no manual intervention is required after setup. The only input from the user is the lot size they wish to trade (based
MP TPO Heatmap — Market Profile (TPO) with VAH/VAL/POC/IB Market Profile is a way to visualize how price accepts or rejects value within a session. Instead of averaging, it counts how often price traded at each level during equal-time “brackets.” The result is a distribution you can read at a glance: thick areas = acceptance; thin edges = rejection. This indicator implements a TPO-based Market Profile with clean session lines (POC, VAH, VAL, IBH, IBL) and a fast, two-tone heatmap cloud that high
Inverted_Chart_EA Utility Expert Advisor Inverted_Chart_EA creates and maintains a mirror-inverted chart of any symbol and timeframe. It automatically generates a custom instrument (e.g. US30_INV ) and keeps its price history updated in real time, with bars mirrored around a chosen pivot. This utility gives traders a new way to analyze the market from a different perspective by flipping the chart upside down. Why use an inverted chart? Highlight hidden patterns – price formations that look ordin
Pivot_Point_Weekly — clear, uncluttered weekly pivots for MT5 Pivot_Point_Weekly plots one thing and does it exceptionally well: the classic weekly pivot (P) calculated from the previous week’s high, low, and close. It renders each week’s pivot as a clean horizontal “step,” with short, perfectly vertical joins from week to week so you can see the regime shifts at a glance—without cluttering your chart with a forest of levels. This indicator is intentionally minimalist: no S1/R1 ladders, no fib v
Filtro:
Sem comentários
Responder ao comentário