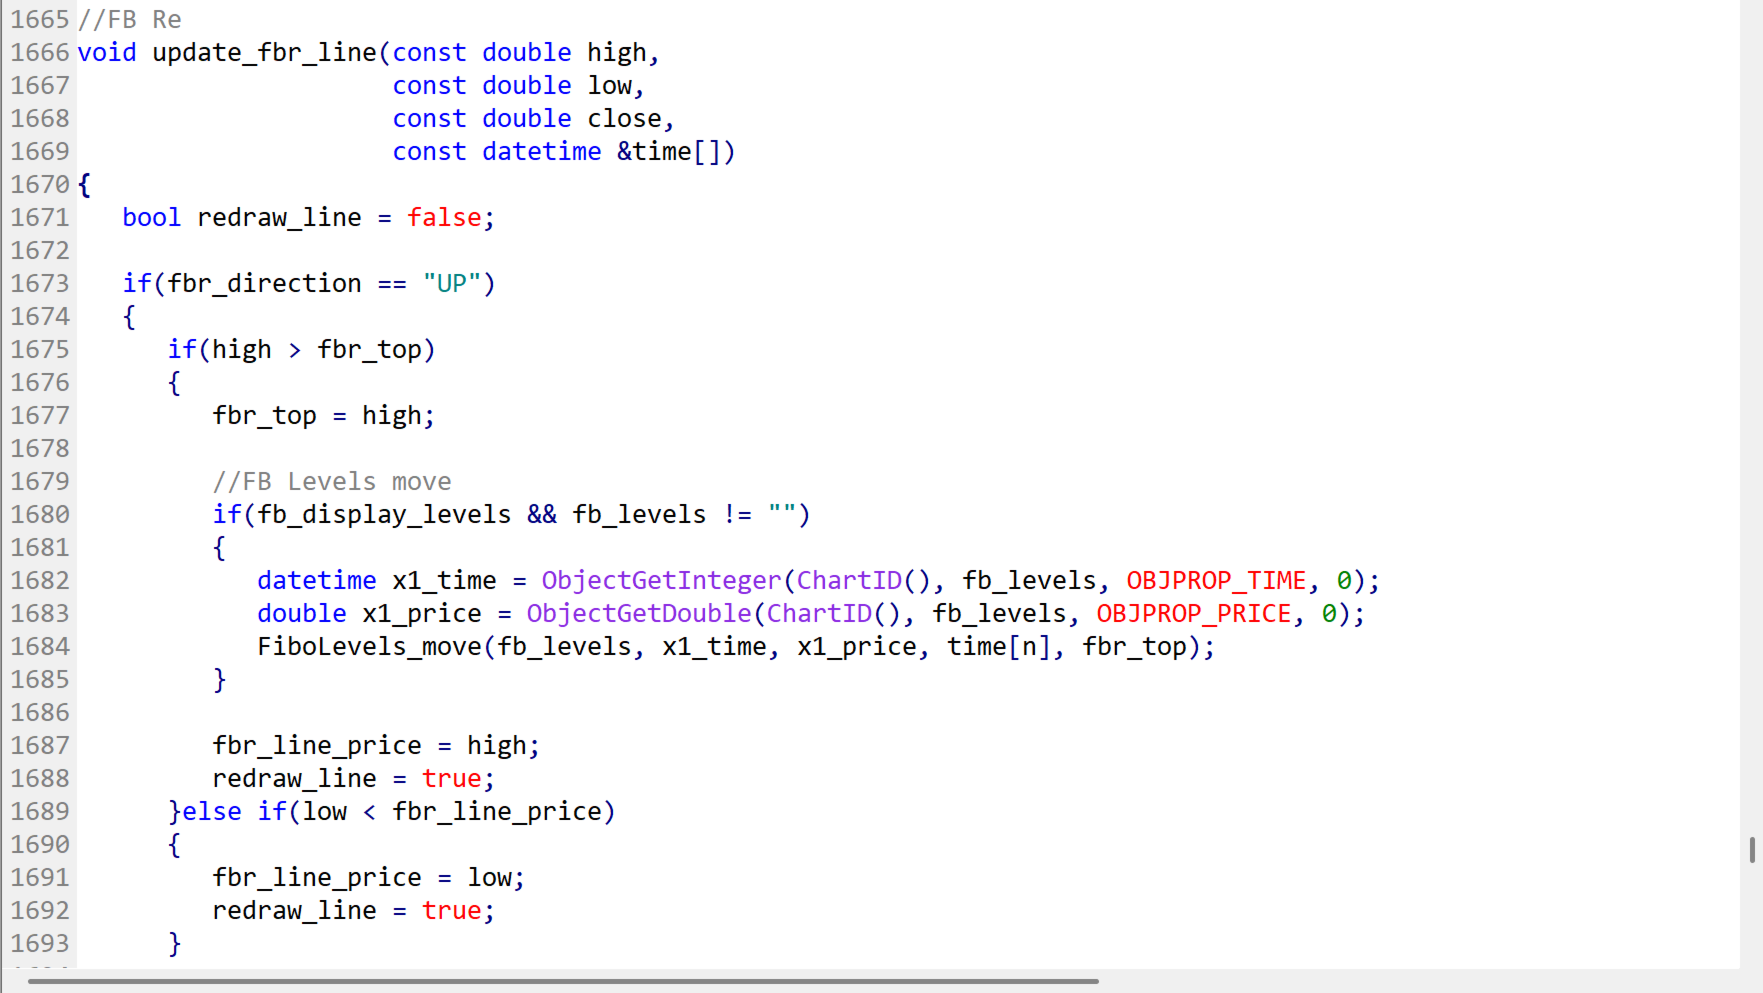
SMC FiboRe Source Code

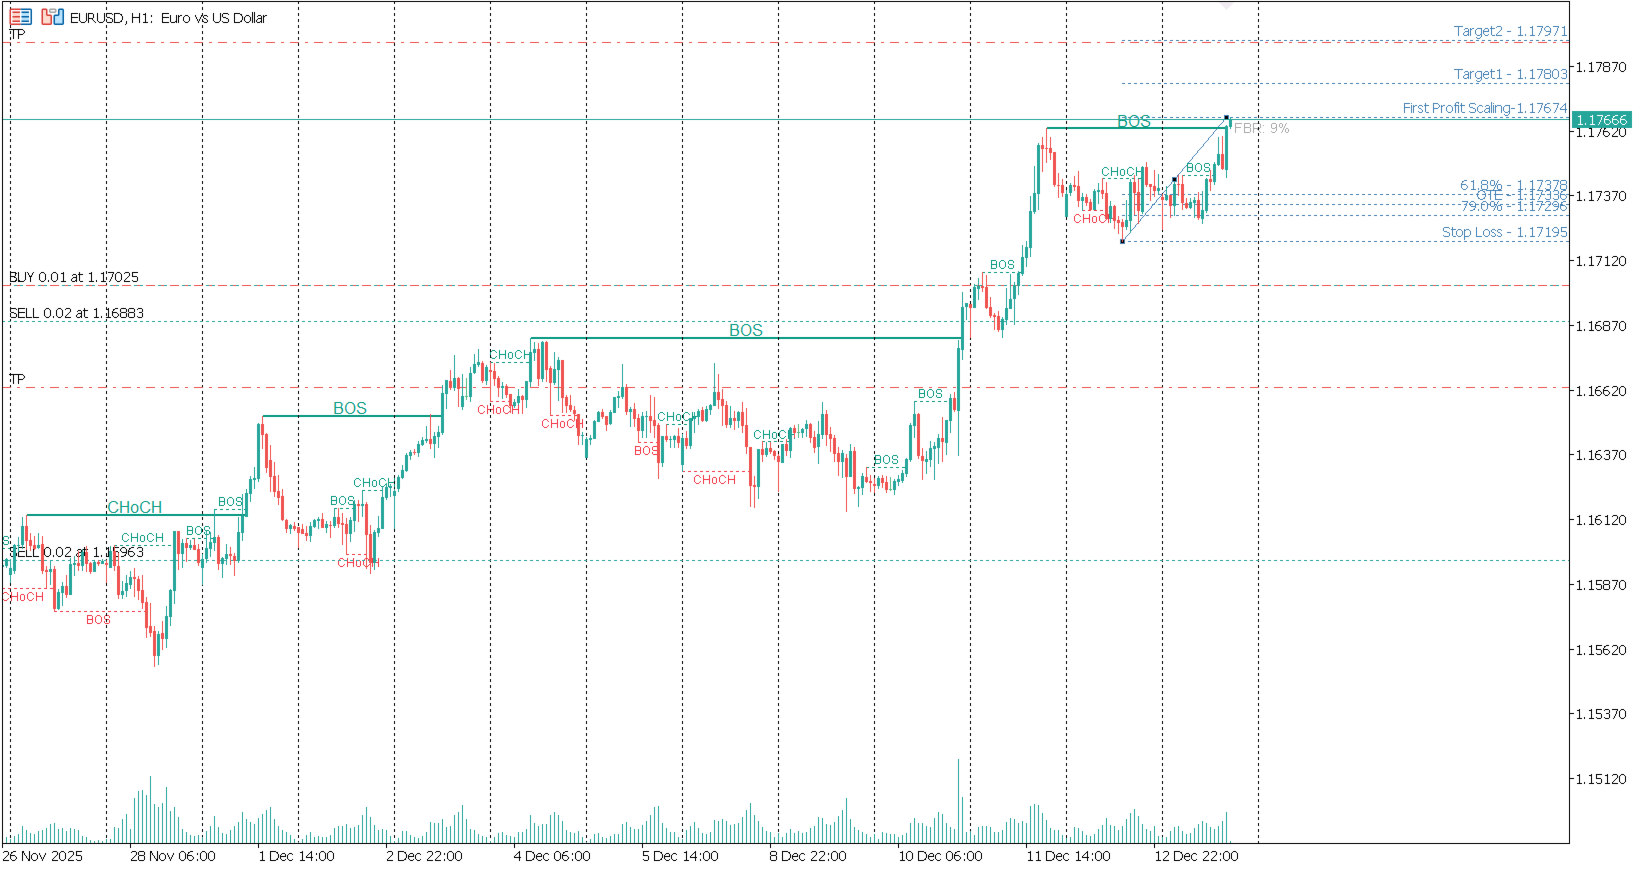
This indicator automatically identifies market structure and plots Fibonacci retracement levels in real time.
It detects key swing highs and lows to mark structural points such as higher highs, higher lows, lower highs, and lower lows, helping traders quickly understand trend direction and structural shifts.
Based on the detected structure, the indicator dynamically draws Fibonacci levels, allowing traders to easily spot potential retracement, pullback, and entry zones without manual drawing.

After purchasing the indicator, the full source code is provided, and via indicator buffers it can be easily integrated into your Expert Advisors (EAs) for automated trading strategies.

Produtos recomendados
Automatic Trendlines
Pasi Hakamaki
4.69 (48)
O indicador desenha linhas de tendência no gráfico. Este indicador possui seis entradas. O usuário pode especificar rótulos alternativos para ambas as linhas. Se várias instâncias do indicador forem usadas, os rótulos devem ser diferentes. O usuário pode definir a largura e a cor das linhas e a profundidade que especifica quais picos significativos devem ser usados. Por exemplo, Depth = 10 define as linhas de tendência usando os picos e vales atuais que têm pelo menos 10 barras à direita e à esq
FREE
Free automatic Fibonacci is an indicator that automatically plots a Fibonacci retracement based on the number of bars you select on the BarsToScan setting in the indicator. The Fibonacci is automatically updated in real time as new highest and lowest values appears amongst the selected bars. You can select which level values to be displayed in the indicator settings. You can also select the color of the levels thus enabling the trader to be able to attach the indicator several times with differe
FREE
Follow The Line MT5
Oliver Gideon Amofa Appiah
4.6 (35)
This indicator obeys the popular maxim that: "THE TREND IS YOUR FRIEND" It paints a GREEN line for BUY and also paints a RED line for SELL. (you can change the colors). It gives alarms and alerts of all kinds. IT DOES NOT REPAINT and can be used for all currency pairs and timeframes. Yes, as easy and simple as that. Even a newbie can use it to make great and reliable trades. NB: For best results, get my other premium indicators for more powerful and reliable signals. Get them here: https://www.m
FREE
The indicator detects and displays М. Gartley's Butterfly pattern. The pattern is plotted by the extreme values of the ZigZag indicator (included in the resources, no need to install). After detecting the pattern, the indicator notifies of that by the pop-up window, a mobile notification and an email. The pattern and wave parameters are displayed on the screenshots. The default parameters are used for demonstration purposes only in order to increase the amount of detected patterns. Parameters z
PZ Penta O MT5
PZ TRADING SLU
3.5 (4)
The Penta-O is a 6-point retracement harmonacci pattern which usually precedes big market movements. Penta-O patterns can expand and repaint quite a bit. To make things easier this indicator implements a twist: it waits for a donchian breakout in the right direction before signaling the trade. The end result is an otherwise repainting indicator with a very reliable trading signal. The donchian breakout period is entered as an input. [ Installation Guide | Update Guide | Troubleshooting | FAQ | A
FREE
VolumeBasedColorsBars
Henrique Magalhaes Lopes
VolumeBasedColorsBars — Free Powerful Volume Analysis for All Traders Unlock the hidden story behind every price bar! VolumeBasedColorsBars is a professional-grade, 100% FREE indicator that colorizes your chart candles based on real, adaptive volume analysis. Instantly spot surges in market activity, identify exhaustion, and catch the moves that matter. This indicator gives you:    • Dynamic color-coded bars for instant volume context    • Adaptive thresholds based on historical, session-awar
FREE
MACD Enhanced
Nikita Berdnikov
5 (3)
Introducing the MACD  Enhanced – an advanced MACD (Moving Average Convergence Divergence) indicator that provides traders with extended capabilities for trend and momentum analysis in financial markets. The indicator uses the difference between the fast and slow exponential moving averages to determine momentum, direction, and strength of the trend, creating clear visual signals for potential entry and exit points. Attention! To achieve the best results, it is recommended to adapt the indicator
FREE
Important Lines
Terence Gronowski
4.87 (23)
This indicator displays Pivot-Lines, preday high and low, preday close and the minimum and maximum of the previous hour. You just have to put this single indicator to the chart to have all these important lines, no need to setup many single indicators. Why certain lines are important Preday high and low : These are watched by traders who trade in a daily chart. Very often, if price climbs over or falls under a preday low/high there is an acceleration in buying/selling. It is a breakout out of a
FREE
Easy Correlations Indicator The Easy Correlations Indicator is designed to help traders analyze the relationship between two correlated instruments. By monitoring the distance between their Relative Strength Index (RSI) values, the indicator highlights situations where one instrument has moved significantly further than the other. This creates potential trading opportunities: Sell the stronger instrument (overstretched RSI) Buy the weaker instrument (lagging RSI) Because the positions are opened
FREE
ZigZag Support Resistance
Emmanuel Tshepang Mosweu
5 (3)
This indicator uses the Zigzag indicator to identify swing highs and swing lows in the price chart.  Once it has identified the swing highs and swing lows, it can use them to determine potential support and resistance levels. A support level is formed when the price drops and bounces back up from a swing low, indicating that there is buying pressure at that level. A resistance level is formed when the price rises and reverses downward from a swing high, suggesting selling pressure at that level.
FREE
This indicator is especially for the binary trading. Time frame is 1 minutes and exp time 5 or 3 minutes only. You must be use martingale 3 step. So you must put lots size is 10 % at most. You should use Mt2 trading platform to connect with my indicator to get more signal without human working. This indicator wining rate is over 80% but you may get 100% of profit by using martingale 3 step. You should use MT2 Trading Platform to connect meta trader platform and binary platform . You can get mt2
FREE
Zigzag Price Arrows
Aiman Saeed Salem Dahbag
The Zigzag Price Arrow indicator is an enhanced version of the classic Zigzag indicator, combining the traditional zigzag pattern with advanced visual features. It not only identifies major market turning points but also provides clear trading signals through: • Directional arrows: Displays colored arrows (green for buy, magenta for sell) indicating potential trend directions. • Price labels: Shows the exact price values at each pivot point directly on the chart. • Improved visual clarity: Make
FREE
LT Donchian Channel
Thiago Duarte
4.83 (6)
Donchian Channel (ou canal de Donchian) é um indicador criado por  Richard Donchian. Ele é  formado tomando a máxima mais alta e a mais baixa mais baixa do último período especificado em velas. A área entre alta e baixa é o canal para o período escolhido. Sua configuração é simples. É possível ter a média entre a linha superior e inferior além de alertas quando o preço atinge um dos lados. Se tiver alguma dúvida ou encontrar alguma falha, me contate. Faça bom uso!
FREE
This indicator is an automated version of the Fibonacci retracement (Fib) indicator. Deciding the best areas to use when drawing the fib can be tricky and this  indicator was made with that in mind. When you drop it on the chart it will automatically choose the best points to draw the fib with, but in case you aren't satisfied with those regions, you can adjust it as you wish.
FREE
Half ma
Artem Svistunov
The Half ma arrow indicator for the MetaTrader 5 trading terminal is a simple but effective tool that gives a signal about a change in the current trend. The Half ma indicator looks like a solid dynamic line that changes color at the points where the trend changes. At these points, the indicator draws arrows of the corresponding color and direction.The Half ma arrow indicator for the MT5 terminal is not an independent source of input signals. It will be most effective to use it as a trend filte
O indicador   "Haven Key Levels PDH PDL"   ajuda os traders a visualizar os níveis-chave no gráfico. Ele marca automaticamente os seguintes níveis: DO (Daily Open)   — o nível de abertura diária. NYM (New York Midnight)   — o nível da meia-noite de Nova Iorque. PDH (Previous Day High)   — o máximo do dia anterior. PDL (Previous Day Low)   — o mínimo do dia anterior. WO (Weekly Open)   — o nível de abertura semanal. MO (Monthly Open)   — o nível de abertura mensal. PWH (Previous Week High)   — o
FREE
The indicator highlights the points that a professional trader sees in ordinary indicators. VisualVol visually displays different volatility indicators on a single scale and a common align. Highlights the excess of volume indicators in color. At the same time, Tick and Real Volume, Actual range, ATR, candle size and return (open-close difference) can be displayed. Thanks to VisualVol, you will see the market periods and the right time for different trading operations. This version is intended f
FREE
Build your professional trading suite for less: I believe in providing high-quality tools for the community. If you find value in this free indicator, please consider leaving a 5-star review to support my work. You can also explore my full catalog of professional EAs and specialized indicators on my profile to find the perfect 'trigger' for your strategy. What is this indicator? This Basic Support and Resistance Indicator -Free-   is designed to help traders automatically identify key market
FREE
Pivot Points Indicator – a fast, reliable, and fully customizable pivot detection for MetaTrader 5. This indicator uses MetaTrader’s native iHighest and iLowest functions to identify pivot highs and lows by scanning for the highest and lowest prices within a user-defined window of bars. A pivot is confirmed only when the current bar is the absolute maximum or minimum within the selected range, ensuring accurate and timely signals based on robust built-in logic. Key Features No Repainting : Onc
FREE
VFI Quantum
Nikita Berdnikov
5 (1)
Introducing VFI (Volume Flow Indicator) – a trading indicator that analyzes the relationship between volume and price movement to identify key trading opportunities. The indicator displays the strength and direction of volume flow, providing clear signals about potential entry and exit points. Signals are formed based on zero line crossovers, crossovers between the VFI line and its exponential moving average (EMA), and when the indicator exits overbought and oversold zones. Attention! This stra
FREE
Indicador Heiken Ashi MT5 Eleve sua análise de mercado com o Indicador Heiken Ashi MT5. Esta poderosa ferramenta transforma os dados de preços padrão em velas mais suaves, focadas em tendências, facilitando a identificação de tendências de mercado e potenciais pontos de reversão. Características principais: Identificação clara de tendências: Distingue visualmente entre tendências de alta e baixa com cores de velas distintas. Redução de ruído: Filtra as flutuações de preços, proporcionando uma v
FREE
Girassol Sunflower MT5 Indicator
Saullo De Oliveira Pacheco
4.33 (6)
Este é o famoso indicador Girassol para Metatrader5. Este indicador marca possíveis topos e fundos nos gráficos dos preços. O indicador identifica topos e fundos no historico de preços do ativo, tenha em mente que o girassol atual, do ultimo candle repinta, pois não é possivel identificar um topo até que o mercado reverta e também não é possivel identificar um fundo sem que o mercado para de cair e comece a subir. Se você estiver procurando por um programador profissional para Metatrader5, entre
FREE
This indicator is a zero-lag indicator and displays  strength of trend change . True Trend  Oscillator Pro works best in combination with True Trend Moving Average Pro that displays exact trend as is. Oscillator value is exact price change in given direction of the trend. True Trend Moving Average Pro: https://www.mql5.com/en/market/product/103586 If you set PERIOD input parameter to 1 this indicator becomes a sharpshooter for binary options. Developers can use True Trend Oscillator in Exper
FREE
Magic 7 Indicator
Marek Pawel Szczesny
5 (1)
Overview Magic 7 Indicator is a comprehensive MetaTrader 5 (MQL5) indicator that identifies seven different trading scenarios based on candlestick patterns and technical analysis. The indicator combines traditional price action patterns with modern concepts like Fair Value Gaps (FVG) to provide trading signals with precise entry points and stop loss levels. Features 7 Trading Scenarios : Each scenario identifies specific market conditions and trading opportunities Visual Signals : Clear buy/sell
FREE
O indicador identifica quando ocorre uma divergência entre o preço e um indicador ou oscilador. Ele identifica divergências regulares e ocultas. Combinado com suas próprias regras e técnicas, este indicador permitirá que você crie (ou aprimore) seu próprio sistema poderoso. Recursos Pode detectar divergências para os seguintes osciladores / indicadores:       MACD, OsMA, Stochastics, RSI, CCI, RVI, Awesome, ADX, ATR, OBV, Índice composto, MFI e Momentum. Apenas um oscilador / indicador pode ser
FREE
Stamina HUD
Michele Todesco
STAMINA HUD – Advanced Market & Trend Dashboard (MT5) STAMINA HUD   is a professional   market information panel   designed for traders who want   clarity, speed, and control   directly on the chart. It provides a   clean heads-up display (HUD)   with essential market data and   multi-timeframe trend direction , without cluttering the chart or generating trading signals. What STAMINA HUD Shows   Current Price   Spread (in real pips)   Today High–Low range (pips)   Average D
FREE
Rainbow MT5
Jamal El Alama
4 (1)
Description : Rainbow MT5 is a technical indicator based on Moving Average with period 34 and very easy to use. When price crosses above MA and MA changes color to green, then this is a signal to buy. When price crosses below MA and MA changes color to red, then this is a signal to sell. The Expert advisor ( Rainbow EA MT5 ) based on Rainbow MT5 indicator is now available here . MT4 version is available here .
FREE
LT Nrtr
BacktestPro LLC
Apresentamos o poderoso indicador NRTR (Nick Rypock Trailing Reverse) - uma ferramenta técnica indispensável para os traders que buscam identificar reversões de tendência e estabelecer níveis efetivos de stop trailing. Desenvolvido por Nick Rypock, este indicador possui um algoritmo único que se adapta às constantes mudanças nas condições do mercado, tornando-se uma adição inestimável para o arsenal de qualquer trader. Aqui estão as duas formas populares pelas quais os traders utilizam este in
FREE
Donchian Channel DC is the indicator of Donchian Channels, that plots maximum and minimum values of a specific period, besides mean value line. It´s possible to configure simple period for analysis and the indicator will plot all three values. You can trade with this indicator as trend or reversal, according to each strategy. Do not let to test others indicators as soon as others expert advisors.
Curver Arrows
Francis Dube
3.75 (4)
Este indicador é uma porta em linha reta de um conhecido indicador MetaTrader 4 que está disponível gratuitamente na Internet. Ele não redesenha. Ele implementa um tipo de estratégia de fuga. As setas indicam a direção do mercado. Use o indicador em gráficos M15 e superior.
FREE
Os compradores deste produto também adquirem
Se você comprar este indicador, receberá meu Gerenciador de Operações Profissional + EA  GRATUITAMENTE. Primeiramente, vale ressaltar que este Sistema de Trading é um Indicador Não Repintado, Não Redesenho e Não Atrasado, o que o torna ideal tanto para o trading manual quanto para o automatizado. Curso online, manual e download de predefinições. O "Sistema de Trading Inteligente MT5" é uma solução completa de trading projetada para traders novos e experientes. Ele combina mais de 10 indicadores
Divergence Bomber
Ihor Otkydach
4.9 (81)
Cada comprador deste indicador recebe adicionalmente, e de forma gratuita: A ferramenta exclusiva "Bomber Utility", que acompanha automaticamente cada operação, define os níveis de Stop Loss e Take Profit e fecha operações de acordo com as regras da estratégia; Arquivos de configuração (set files) para ajustar o indicador em diferentes ativos; Set files para configurar o Bomber Utility nos modos: "Risco Mínimo", "Risco Balanceado" e "Estratégia de Espera"; Um vídeo tutorial passo a passo que aju
***Entry In The Zone and SMC Multi Timeframe é uma ferramenta de análise de mercado em tempo real desenvolvida com base nos Smart Money Concepts (SMC). Ela foi projetada para ajudar os traders a analisarem a estrutura do mercado de forma sistemática e obterem uma visão mais clara da direção geral do mercado. O sistema analisa automaticamente Pontos de Reversão, Zonas-Chave e a Estrutura de Mercado em múltiplos timeframes, enquanto exibe Points of Interest (POI), sinais sem repaint e níveis autom
SuperScalp Pro
Van Minh Nguyen
5 (1)
SuperScalp Pro – Sistema avançado de indicador de scalping com múltiplos filtros SuperScalp Pro é um sistema avançado de indicador de scalping que combina o clássico Supertrend com múltiplos filtros inteligentes de confirmação. O indicador opera de forma eficiente em todos os timeframes de M1 a H4 e é especialmente adequado para XAUUSD, BTCUSD e principais pares Forex. Pode ser usado como sistema independente ou integrado de forma flexível a estratégias de trading existentes. O indicador integra
Azimuth Pro
Ottaviano De Cicco
5 (1)
PROMOÇÃO DE LANÇAMENTO O preço do Azimuth Pro está inicialmente definido em 299$ para os primeiros 100compradores. O preço final será de 499$ . A DIFERENÇA ENTRE ENTRADAS RETAIL E INSTITUCIONAIS NÃO É O INDICADOR — É A LOCALIZAÇÃO. A maioria dos traders entra em níveis de preço arbitrários, perseguindo momentum ou reagindo a sinais atrasados. As instituições esperam o preço atingir níveis estruturados onde oferta e demanda realmente mudam. Azimuth Pro mapeia esses níveis automaticamente: VWA
Obtenha o AUX GRATUITO e suporte EA  Download direto — Clique aqui [ D.I.C.E ] O DICE Indicator Divergence in Chaos Environment é uma ferramenta MT5 especializada criada para traders que aplicam a Teoria das Ondas de Elliott dentro das técnicas de Trading Chaos. Identifica divergências ocultas e regulares na ação do preço, sincronizadas com o ambiente de mercado caótico descrito por Bill Williams. Principais recursos Divergência alinhada com Ondas de Elliott: detecta divergências altistas e bai
O Game Changer é um indicador de tendências revolucionário, concebido para ser utilizado em qualquer instrumento financeiro, transformando o seu metatrader num poderoso analisador de tendências. O indicador não se retraça nem apresenta atrasos. Funciona em qualquer período de tempo e auxilia na identificação de tendências, sinaliza potenciais reversões, atua como um mecanismo de trailing stop e fornece alertas em tempo real para respostas rápidas do mercado. Quer seja um profissional experiente
Trend Screener Pro MT5
STE S.S.COMPANY
4.84 (100)
Desbloqueie o poder da negociação de tendências com o indicador Trend Screener: sua solução definitiva de negociação de tendências, alimentada por lógica difusa e sistema de múltiplas moedas! Eleve sua negociação de tendências com o Trend Screener, o revolucionário indicador de tendências alimentado por lógica difusa. É um poderoso indicador de acompanhamento de tendências que combina mais de 13 ferramentas e recursos premium e 3 estratégias de negociação, tornando-o uma escolha versátil para to
Atomic Analyst MT5
Issam Kassas
4.07 (28)
Primeiramente, vale ressaltar que este Indicador de Negociação não repinta, não redesenha e não apresenta atrasos, tornando-o ideal tanto para negociação manual quanto automatizada. Manual do utilizador: configurações, entradas e estratégia. O Analista Atômico é um Indicador de Ação de Preço PA que utiliza a força e o momentum do preço para encontrar uma vantagem melhor no mercado. Equipado com filtros avançados que ajudam a remover ruídos e sinais falsos, e aumentam o potencial de negociação.
FX Power MT5 NG
Daniel Stein
5 (30)
FX Power: Analise a Força das Moedas para Decisões de Negociação Mais Inteligentes Visão Geral FX Power é a sua ferramenta essencial para compreender a força real das principais moedas e do ouro em quaisquer condições de mercado. Identificando moedas fortes para comprar e fracas para vender, FX Power simplifica as decisões de negociação e revela oportunidades de alta probabilidade. Quer você prefira seguir tendências ou antecipar reversões usando valores extremos de Delta, esta ferramenta adap
Este é um indicador para MT5 que fornece sinais precisos para entrar em uma negociação sem redesenhar. Ele pode ser aplicado a qualquer ativo financeiro: forex, criptomoedas, metais, ações, índices. Ele fornecerá estimativas bastante precisas e informará quando é melhor abrir e fechar um negócio. Assista o vídeo (6:22) com um exemplo de processamento de apenas um sinal que compensou o indicador! A maioria dos traders melhora seus resultados de negociação durante a primeira semana de negociação c
Super Signal – Skyblade Edition Sistema profissional de sinais de tendência sem repintar / sem atraso com taxa de acerto excepcional | Para MT4 / MT5 Funciona melhor em timeframes mais curtos, como 1 minuto, 5 minutos e 15 minutos. Principais características: Super Signal – Skyblade Edition é um sistema inteligente de sinais desenvolvido especificamente para operações com tendência. Utiliza uma lógica de filtragem em múltiplas camadas para detectar apenas movimentos direcionais fortes sustenta
O indicador destaca as zonas onde há declaração de interesse no mercado e, em seguida, mostra a zona de acumulação de ordens . Ele funciona como um livro de ofertas em escala ampliada . Este é o indicador para o dinheiro grande . Seu desempenho é excepcional. Qualquer interesse que existir no mercado, você verá com clareza . (Esta é uma versão totalmente reescrita e automatizada — não é mais necessário fazer análise manual .) A Velocidade de Transação é um indicador de conceito novo que mostra o
Antes de tudo, vale ressaltar que esta Ferramenta de Negociação é um Indicador Não Repintante, Não Redesenhante e Não Atrasado, o que a torna ideal para negociação profissional. Curso online, manual do utilizador e demonstração. O Indicador de Conceitos de Ação de Preço Inteligente é uma ferramenta muito poderosa tanto para traders novos quanto experientes. Ele combina mais de 20 indicadores úteis em um único, combinando ideias avançadas de negociação como Análise do Trader do Círculo Interno
Grabber System MT5
Ihor Otkydach
4.82 (22)
Apresento a você um excelente indicador técnico: Grabber, que funciona como uma estratégia de trading “tudo incluído”, pronta para usar. Em um único código estão integradas ferramentas poderosas de análise técnica de mercado, sinais de entrada (setas), funções de alertas e notificações push. Cada comprador deste indicador também recebe gratuitamente: Utilitário Grabber: ferramenta para gerenciamento automático de ordens abertas Vídeo tutorial passo a passo: como instalar, configurar e operar com
Shock Pullback
Suleiman Alhawamdah
5 (1)
De forma simples, você pode começar a operar quando o movimento dos números brancos — conhecidos como "pips" — começar a aparecer ao lado do candle atual. Os "pips" brancos indicam que uma operação de compra ou venda está ativa e se movendo na direção correta, conforme indicado pela cor branca. Quando o movimento dos pips brancos para e se transforma em uma cor verde estática, isso sinaliza o fim do momento atual. A cor verde dos números representa o lucro total obtido em "pips", independenteme
Market Structure Patterns
Samuel Manoel De Souza
4.47 (19)
Disponível para   MT4   e   MT5 . Junte-se ao canal Market Structure Patterns para baixar os materiais disponíveis para estudos e informações adicionais. Postagens relacionadas: Market Structure Patterns - Introduction Garanta agora com 50% de desconto | Preço anterior US$ 90 | Oferta válida até 31 de dezembro | Uma grande atualização está chegando em breve, e o preço original será ajustado. Market Structure Patterns   é um indicador baseado em   smart money concepts   que apresenta elementos
Trend indicator AI mt5
Ramil Minniakhmetov
5 (13)
O indicador Trend Ai é uma ótima ferramenta que irá melhorar a análise de mercado de um trader, combinando a identificação de tendências com pontos de entrada acionáveis e alertas de reversão. Este indicador permite que os usuários naveguem pelas complexidades do mercado forex com confiança e precisão Além dos sinais primários, o indicador Trend Ai identifica pontos de entrada secundários que surgem durante retrações ou retrações, permitindo que os comerciantes capitalizem as correções de preço
Quantum TrendPulse
Bogdan Ion Puscasu
5 (20)
Apresentando   Quantum TrendPulse   , a ferramenta de negociação definitiva que combina o poder do   SuperTrend   ,   RSI   e   Stochastic   em um indicador abrangente para maximizar seu potencial de negociação. Projetado para traders que buscam precisão e eficiência, este indicador ajuda você a identificar tendências de mercado, mudanças de momentum e pontos de entrada e saída ideais com confiança. Principais características: Integração SuperTrend:   siga facilmente a tendência predominante do
ARICoins
Temirlan Kdyrkhan
ARICoin is a powerful trading companion designed to generate high-probability entry signals with dynamic TP/SL/DP levels based on volatility. Built-in performance tracking shows win/loss stats, PP1/PP2 hits, and success rates all updated live. Key Features: Buy/Sell signals with adaptive volatility bands Real-time TP/SL/DP levels based on ATR Built-in MA Filter with optional ATR/StdDev volatility Performance stats panel (Success, Profit/Loss, PP1/PP2) Alerts via popup, sound, push, or email Cust
Gold Sniper Scalper Pro
Ich Khiem Nguyen
3.5 (8)
Gold Sniper Scalper Pro é um indicator profissional para MetaTrader 5, projetado para auxiliar traders a identificar pontos de entrada e gerenciar risco de forma eficaz. O indicator fornece um conjunto completo de ferramentas de análise incluindo sistema de detecção de sinais, gestão automática de Entry/SL/TP, análise de volume e estatísticas de desempenho em tempo real. Guia do usuário para entender o sistema   |   Guia do usuário para outros idiomas RECURSOS PRINCIPAIS Sistema de detecção
PZ Swing Trading MT5
PZ TRADING SLU
5 (5)
Swing Trading é o primeiro indicador projetado para detectar oscilações na direção da tendência e possíveis oscilações de reversão. Ele usa a abordagem de negociação de linha de base, amplamente descrita na literatura de negociação. O indicador estuda vários vetores de preço e tempo para rastrear a direção da tendência agregada e detecta situações nas quais o mercado está sobrevendido ou sobrecomprado em excesso e pronto para corrigir. [ Guia de instalação | Guia de atualização | Solução de prob
Introduction to X3 Chart Pattern Scanner X3 Cherart Pattern Scanner is the non-repainting and non-lagging indicator detecting X3 chart patterns including Harmonic pattern, Elliott Wave pattern, X3 patterns, and Japanese Candlestick patterns. Historical patterns match with signal patterns. Hence, you can readily develop the solid trading strategy in your chart. More importantly, this superb pattern scanner can detect the optimal pattern of its kind. In addition, you can switch on and off individu
ARIScalping
Temirlan Kdyrkhan
ARIScalp is a powerful trading companion designed to generate high-probability entry signals with dynamic TP/SL/DP levels based on volatility. Built-in performance tracking shows win/loss stats, PP1/PP2 hits, and success rates all updated live. Key Features: Buy/Sell signals with adaptive volatility bands Real-time TP/SL/DP levels based on ATR Built-in MA Filter with optional ATR/StdDev volatility Performance stats panel (Success, Profit/Loss, PP1/PP2) Alerts via popup, sound, push, or email Cus
Trend Forecaster
Alexey Minkov
5 (7)
The Trend Forecaster indicator utilizes a unique proprietary algorithm to determine entry points for a breakout trading strategy. The indicator identifies price clusters, analyzes price movement near levels, and provides a signal when the price breaks through a level. The Trend Forecaster indicator is suitable for all financial assets, including currencies (Forex), metals, stocks, indices, and cryptocurrencies. You can also adjust the indicator to work on any time frames, although it is recommen
O Support And Resistance Screener está em um indicador de nível para MetaTrader que fornece várias ferramentas dentro de um indicador. As ferramentas disponíveis são: 1. Screener de estrutura de mercado. 2. Zona de retração de alta. 3. Zona de retração de baixa. 4. Pontos de Pivô Diários 5. Pontos Pivot semanais 6. Pontos Pivot mensais 7. Forte suporte e resistência com base no padrão harmônico e volume. 8. Zonas de nível de banco. OFERTA POR TEMPO LIMITADO: O indicador de suporte e resistência
Berma Bands
Muhammad Elbermawi
5 (7)
O indicador Berma Bands (BBs) é uma ferramenta valiosa para traders que buscam identificar e capitalizar tendências de mercado. Ao analisar a relação entre o preço e os BBs, os traders podem discernir se um mercado está em uma fase de tendência ou de variação. Visite o [ Blog Berma Home ] para saber mais. As Bandas de Berma são compostas por três linhas distintas: a Banda de Berma Superior, a Banda de Berma Média e a Banda de Berma Inferior. Essas linhas são plotadas em torno do preço, criando u
AW Trend Predictor MT5
AW Trading Software Limited
4.76 (54)
A combinação de níveis de tendência e quebra em um sistema. Um algoritmo de indicador avançado filtra o ruído do mercado, determina a tendência, os pontos de entrada e os possíveis níveis de saída. Os sinais indicadores são registrados em um módulo estatístico, que permite selecionar as ferramentas mais adequadas, mostrando a eficácia do histórico do sinal. O indicador calcula as marcas Take Profit e Stop Loss. Manual e instruções ->   AQUI   / versão MT4 ->   AQUI Como negociar com o indicador
The Super Arrow Indicator provides non-repainting buy and sell signals with exceptional accuracy. Key Features No repainting – confirmed signals remain fixed Clear visual arrows: green for buy, red for sell Real-time alerts via pop-up, sound, and optional email Clean chart view with no unnecessary clutter Works on all markets: Forex, gold, oil, indices, crypto Adjustable Parameters TimeFrame Default:   "current time frame" Function:   Sets the time frame for indicator calculation Options:   Can
Gold Venamax MT5
Sergei Linskii
2.67 (3)
Gold Venamax - este é o melhor indicador técnico de ações. O algoritmo do indicador analisa o movimento do preço de um ativo e reflete a volatilidade e as zonas de entrada potenciais. Recursos do indicador: Este é um super indicador com Magic e dois blocos de setas de tendência para uma negociação confortável e lucrativa. O botão vermelho para alternar blocos é exibido no gráfico. Magic é definido nas configurações do indicador, para que você possa instalar o indicador em dois gráficos exibind
Mais do autor
ICT, SMC, SMART MONEY CONCEPTS, SMART MONEY, Smart Money Concept, Support and Resistance, Trend Analysis, Price Action, Market Structure, Order Blocks, BOS/CHoCH,   Breaker Blocks ,  Momentum Shift,   Supply&Demand Zone/Order Blocks , Strong Imbalance,   HH/LL/HL/LH,    Fair Value Gap, FVG,  Premium  &   Discount   Zones, Fibonacci Retracement, OTE, Buy Side Liquidity, Sell Side Liquidity, BSL/SSL Taken, Equal Highs & Lows, MTF Dashboard, Multiple Time Frame, BigBar, HTF OB, HTF Market Structure
ExpertSMC
Jing Bo Wu
4.27 (11)
ICT, SMC, SMART MONEY CONCEPTS, SMART MONEY, Smart Money Concept, Support and Resistance, Trend Analysis, Price Action, Market Structure, Order Blocks, BOS/CHoCH,   Breaker Blocks ,  Momentum Shift,   Supply Demand  ,  Supply&Demand Zone/Order Blocks , Strong Imbalance,   HH/LL/HL/LH,    Fair Value Gap, FVG, Inversion FVG, IFVG,  Premium  &   Discount   Zones, Fibonacci Retracement, OTE, Buy Side Liquidity, Sell Side Liquidity, BSL/SSL Taken, Equal Highs & Lows, MTF Dashboard, Multiple Time Fra
This is a derivative of John Carter's "TTM Squeeze" volatility indicator, as discussed in his book "Mastering the Trade" (chapter 11). Gray  dot on  the midline show that the market just entered a squeeze (Bollinger Bands are with in Keltner Channel). This signifies low volatility, market preparing itself for an explosive move (up or down). Blue dot signify "Squeeze release". Mr.Carter suggests waiting till the first blue after a gray dot, and taking a position in the direction of the moment
FREE
ICT, SMC, SMART MONEY CONCEPTS, SMART MONEY, Smart Money Concept, Support and Resistance, Trend Analysis, Price Action, Market Structure, Order Blocks, BOS/CHoCH,   Breaker Blocks ,  Momentum Shift,   Supply&Demand Zone/Order Blocks , Strong Imbalance, HH/LL/HL/LH,    Fair Value Gap, FVG,  Premium  &   Discount   Zones, Fibonacci Retracement, OTE, Buy Side Liquidity, Sell Side Liquidity, BSL/SSL Taken, Equal Highs & Lows, MTF Dashboard, Multiple Time Frame, BigBar, HTF OB, HTF Market Structure, 
ZhuQue S1 MT5
Jing Bo Wu
5 (1)
A specialized algorithmic trading system designed exclusively for the GBP/USD currency pair. Leveraging sophisticated trading strategies and dynamic position-sizing algorithms, it delivers exceptional risk-adjusted returns while maintaining low drawdown levels. This system prioritizes capital preservation through intelligent risk controls, achieving consistent profitability in volatile forex markets. Key features: GBP/USD focused precision trading Advanced strategy engine with multi-factor anal
Trade History for MT4  This indicator is specially developed for that traders want to display his trades on the charts. Shows history and current deals on the chart. Trades show on the chart with a dotted line, and profit will show realtime. Buy trades are displayed in bull color, Sell trades in bear color. Tip: The historical order displayed by the indicator is associated with the "Account History", so please set the historical order display in the "Account History" of MT software. If you a
FREE
This indicator automatically detects and marks Fair Value Gaps (FVG) and inverse Fair Value Gaps (iFVG) in real time. It analyzes price action to identify imbalances created by strong market moves, highlighting potential areas of interest for price rebalancing, continuation, or reversal. The indicator updates dynamically as new candles form, providing clear and objective visualization of valid FVG and iFVG zones without manual analysis. It is well suited for Smart Money Concepts (SMC), ICT-base
Filtro:
Sem comentários
Responder ao comentário