Cvd Divergence

CVD Divergence – 전문적인 주문 흐름 및 다이버전스 분석

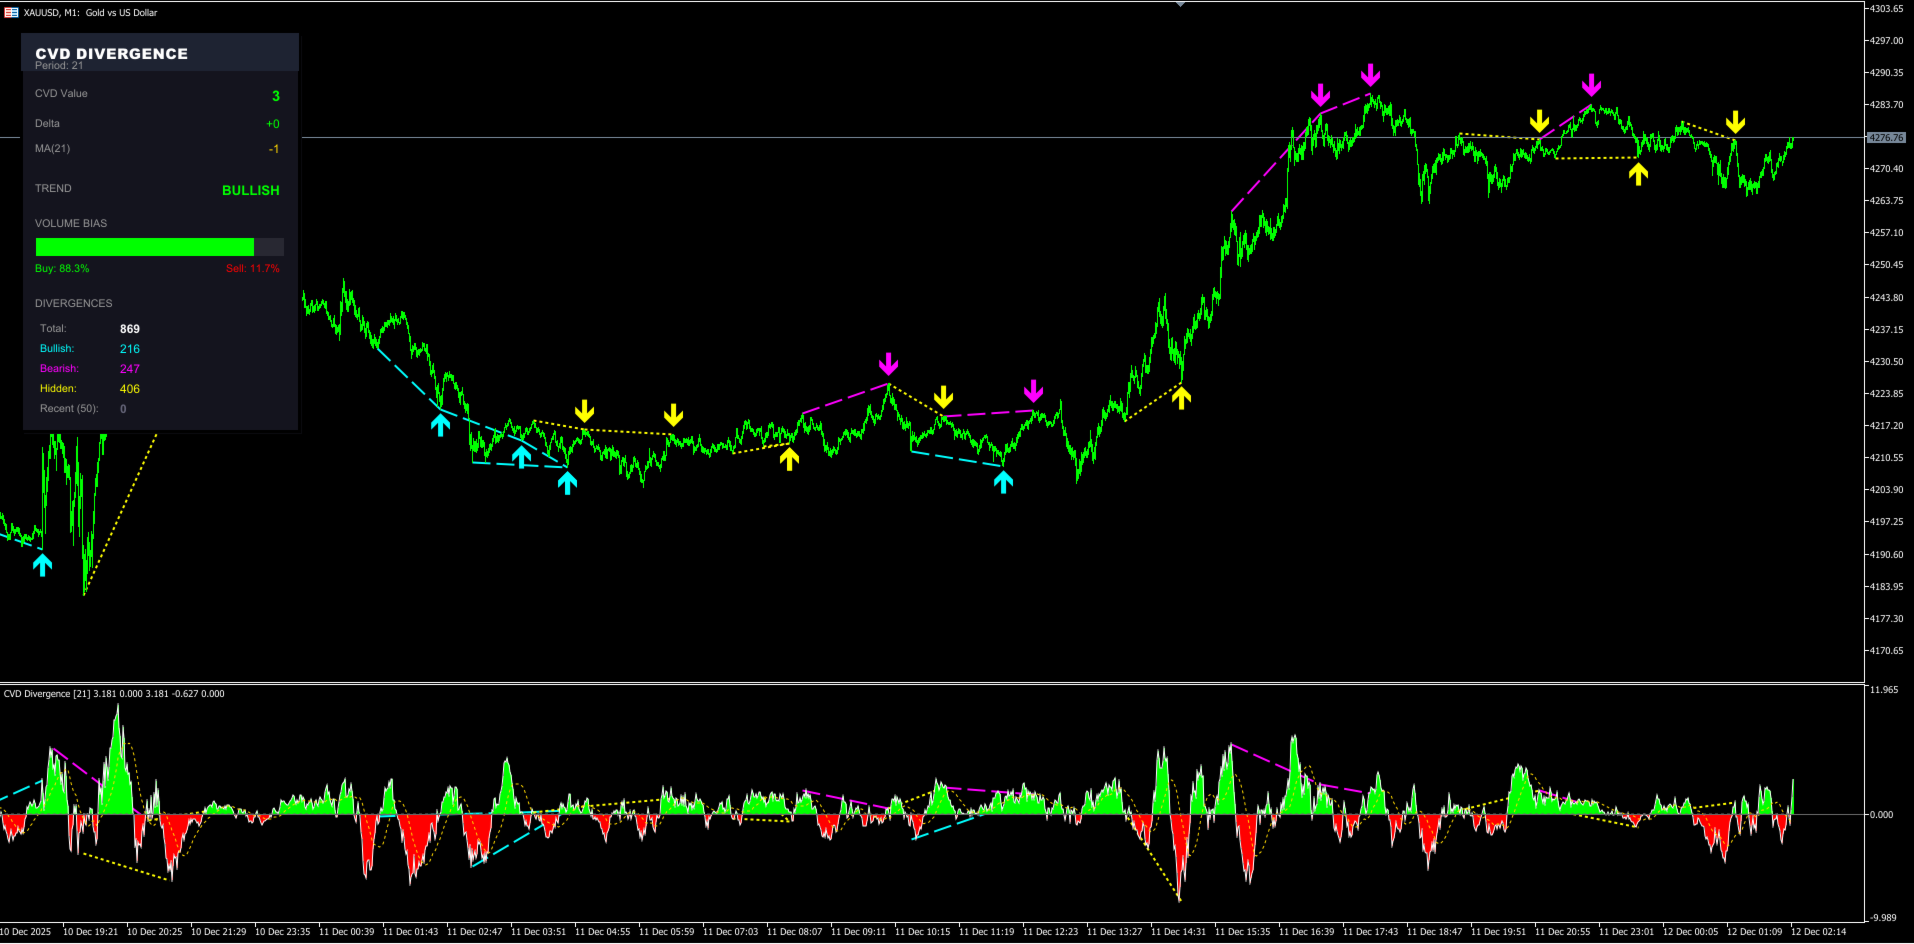
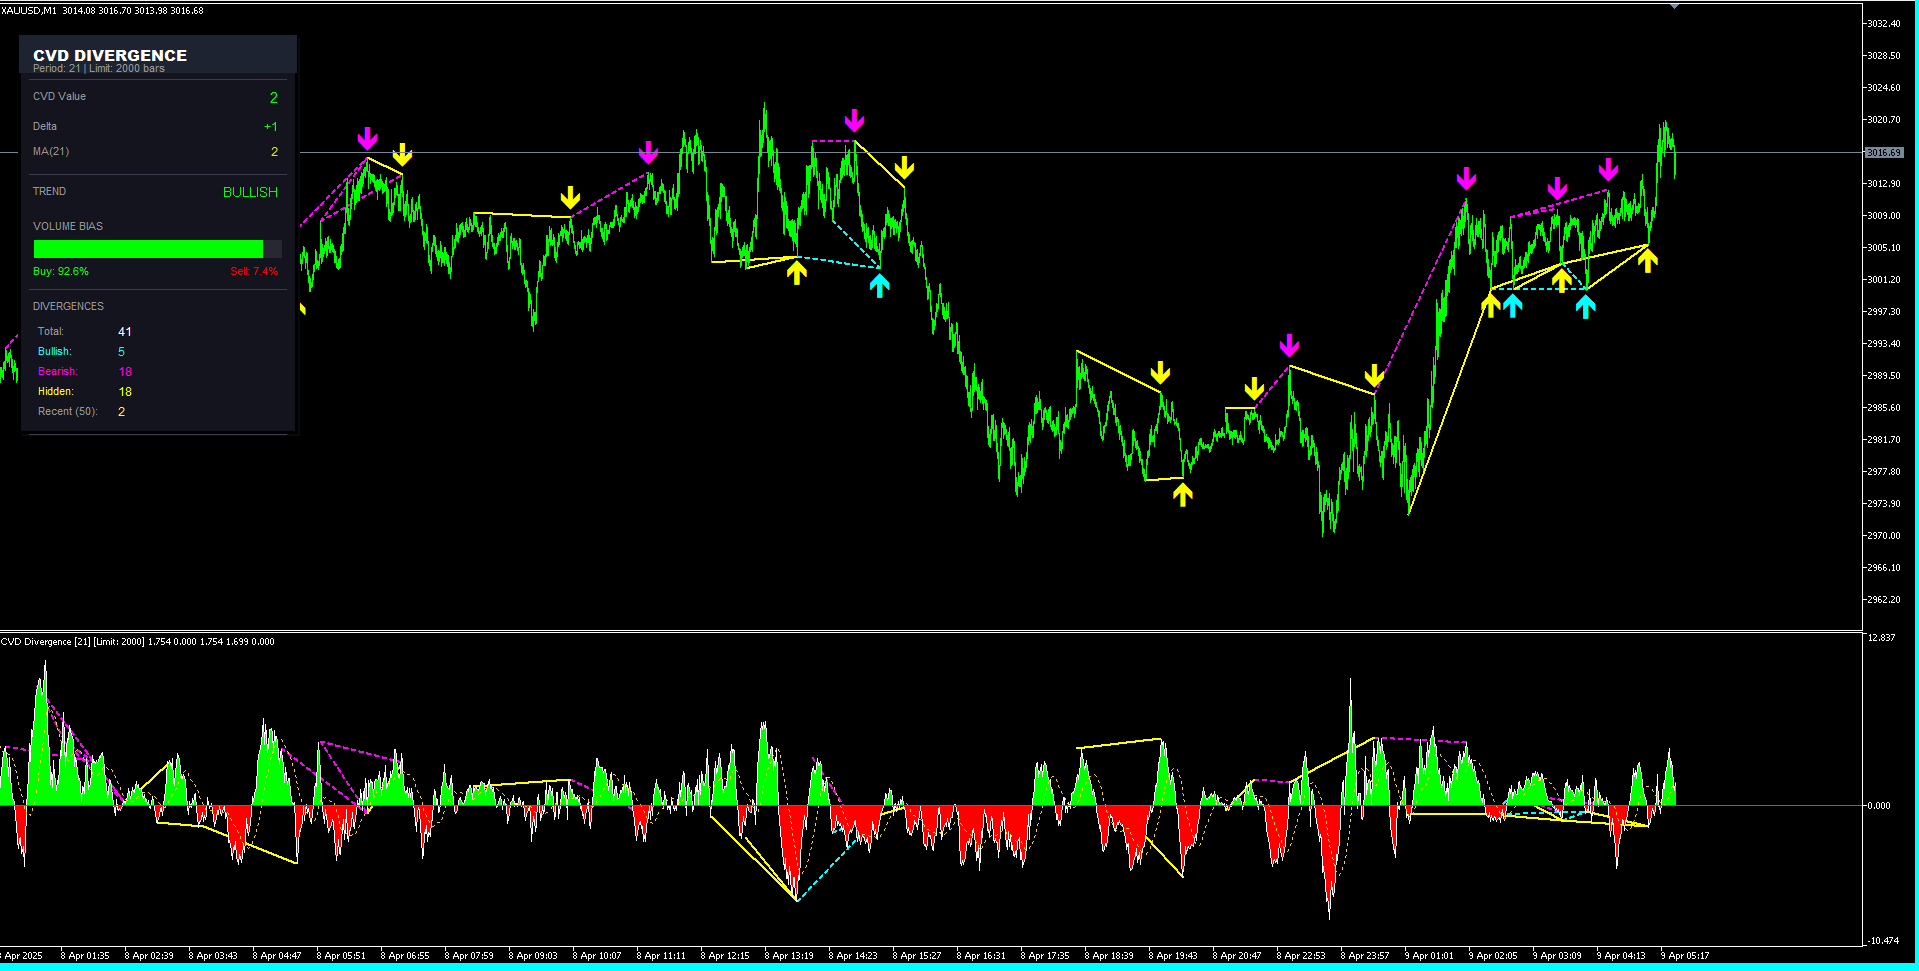
CVD Divergence는 가격과 Cumulative Delta Volume(CVD) 사이의 신뢰할 수 있는 다이버전스를 감지하기 위해 개발된 기술적 지표입니다. 실제 주문 흐름이 가격 움직임을 확인하지 않을 때를 정확하게 포착하여, 잠재적 추세 전환, 매수·매도 세력의 소진, 기관의 시장 조작 가능성을 보여줍니다.

이 지표는 공격적인 거래량 분석과 가격 구조 해석을 결합해 명확하고 객관적이며 빠른 신호를 제공합니다.

지표 기능

CVD Divergence는 누적 델타 거래량을 사용하여 주문 흐름의 방향과 가격 방향을 비교합니다. 두 값이 크게 괴리될 경우 차트에 시각적 표시를 남기고 다이버전스 방향을 명확하게 보여줍니다.

다음과 같은 상황을 감지합니다:

  • 강세 다이버전스 (가격이 하락하지만 CVD가 상승할 때)

  • 약세 다이버전스 (가격이 상승하지만 CVD가 하락할 때)

  • 매수·매도 세력의 힘 고갈

  • 기관 주문 불균형으로 인해 발생한 가짜 움직임

  • 가격이 인위적으로 압박되고 있을 가능성이 있는 시장 상황

Cumulative Delta Volume이 강력한 이유

CVD는 시장 참여자의 실제 의도를 드러냅니다.
대표적인 사례:

  • 가격은 상승하지만 CVD가 하락 → 외형상 상승처럼 보이지만 기관의 공격적인 매도 존재

  • 가격은 하락하지만 CVD가 상승 → 숨겨진 매수, 누적 매집 및 실제 수요 증가

  • 가격과 CVD의 큰 괴리는 추세 전환이나 가짜 돌파 전에 자주 나타남

가격 차트는 속일 수 있지만, 누적 델타는 거의 속이지 않습니다.
이 지표는 이러한 흐름을 실용적이고 신뢰할 수 있는 매매 신호로 변환합니다.

주요 특징

  • 가격과 누적 델타 간 다이버전스 자동 감지

  • 예측 방향을 명확히 보여주는 시각적 화살표

  • 공격적 거래량 기반의 정확한 CVD 계산

  • 깔끔하고 직관적인 인터페이스

  • 선택 가능한 알림 기능: 팝업, 푸시 알림, 사운드

  • 여러 종목에서도 낮은 CPU 사용량

  • 외환, 지수, 주식, 암호화폐 등 다양한 시장에서 높은 효율성

사용 대상

  • 주문 흐름을 기반으로 반전을 미리 포착하고 싶은 트레이더

  • 기관 매매 분석 및 델타 볼륨을 사용하는 전문 트레이더

  • 스캘퍼, 데이 트레이더, 스윙 트레이더

  • 진입/청산 전에 확실한 확인 신호가 필요한 사용자

  • 리페인트 없이 명확하고 객관적인 신호를 원하는 사용자

MQL5 버전

CVD Divergence는 MetaTrader 5 전용으로 개발되었으며 다음을 제공합니다:

  • 높은 성능과 안정성

  • EA 및 기타 지표와의 완전한 호환성

  • 빠르고 신뢰할 수 있는 실행

  • 리페인트 없는 안정적인 신호


추천 제품
The Optimized MACD Divergence indicator is a powerful tool designed to identify potential trading opportunities by detecting divergences between price action and the MACD indicator. It combines classic divergence analysis with candlestick pattern recognition and volume filtering to provide more accurate and reliable signals. How it Works The indicator operates on the following principles: MACD Calculation:   It calculates the MACD indicator using user-defined parameters for fast EMA, slow EMA,
FXC iMACD-DivergencE MT5 Indicator This is an advanced MACD indicator that finds trend-turn divergences on the current symbol. The indicator detects divergence between the MACD and the price movements as a strong trend-turn pattern. Main features: Advanced divergence settings Price based on Close, Open or High/Low prices Give Buy/Sell open signals PUSH notifications E-mail sending Pop-up alert Customizeable Information panel Input parameters: MACD Fast-EMA: The Fast-EMA variable of the MACD indi
FXC iDeM-DivergencE MT5 Indicator This is an advanced DeMarker indicator that finds trend-turn divergences on the current symbol. The indicator detects divergence between the DeMarker and the price movements as a strong trend-turn pattern. Main features: Advanced divergence settings Price based on Close, Open or High/Low prices Give Buy/Sell open signals PUSH notifications E-mail sending Pop-up alert Customizeable Information panel Input parameters: DeM Period: The Period size of the DeMarker in
The Trend Duration Forecast MT5 indicator is designed to estimate the probable lifespan of a bullish or bearish trend. Using a Hull Moving Average (HMA) to detect directional shifts, it tracks the duration of each historical trend and calculates an average to forecast how long the current trend is statistically likely to continue. This allows traders to visualize both real-time trend strength and potential exhaustion zones with exceptional clarity. KEY FEATURES Dynamic Trend Detection:   Utiliz
Heiken Ashi Smoothed Strategy is a very simple but powerful system to get forex market trend direction. This indicator is actually 2 indicators in 1 pack, Heiken Ashi and Heiken Ashi Smoothed Moving Average both included. Because HA (Heiken Ashi) and HAS (Heiken Ashi Smoothed) are calculated in the same one system event with necessary buffers and loop only, so it is the FAST, OPTIMIZED and EFFICIENT HA having the combined indicator of MetaTrader 5. You can choose to display HA and HAS in the sam
Owl Smart Levels MT5
Sergey Ermolov
4.03 (32)
MT4 버전  |  FAQ Owl Smart Levels Indicator 는 Bill Williams 의 고급 프랙탈, 시장의 올바른 파동 구조를 구축하는 Valable ZigZag, 정확한 진입 수준을 표시하는 피보나치 수준과 같은 인기 있는 시장 분석 도구를 포함하는 하나의 지표 내에서 완전한 거래 시스템입니다. 시장과 이익을 취하는 장소로. 전략에 대한 자세한 설명 표시기 작업에 대한 지침 고문-거래 올빼미 도우미의 조수 개인 사용자 채팅 ->구입 후 나에게 쓰기,나는 개인 채팅에 당신을 추가하고 거기에 모든 보너스를 다운로드 할 수 있습니다 힘은 단순함에 있습니다! Owl Smart Levels 거래 시스템은 사용하기 매우 쉽기 때문에 전문가와 이제 막 시장을 연구하고 스스로 거래 전략을 선택하기 시작한 사람들 모두에게 적합합니다. 전략 및 지표에는 눈에 보이지 않는 비밀 공식 및 계산 방법이 없으며 모든 전략 지표는 공개되어 있습니다. Owl Smart Levels를 사
Gekko MACD Plus
Rodrigo Galeote
3 (3)
Type: Oscillator This is Gekko's Cutomized Moving Average Convergence/Divergence (MACD), a customized version of the famous MACD indicator. Use the regular MACD and take advantage of several entry signals calculations and different ways of being alerted whenever there is potential entry point. Inputs Fast MA Period: Period for the MACD's Fast Moving Average (default 12); Slow MA Period: Period for the MACD's Slow Moving Average (default 26); Signal Average Offset Period: Period for the Signal A
Noize Absorption Index
Ekaterina Saltykova
Noize Absorption Index - is the manual trading system that measures the difference of pressure between bears forces and bulls forces. Green line - is a noize free index that showing curent situation. Zero value of index shows totally choppy/flat market.Values above zero level shows how powerfull bullish wave is and values below zero measures bearish forces.Up arrow appears on bearish market when it's ready to reverse, dn arrow appears on weak bullish market, as a result of reverse expectation.
MACDivergence MTF MT5
Pavel Zamoshnikov
4 (5)
Advanced ideas of the popular MACD indicator: It detects and displays classic and reverse divergences (two methods of detecting divergences). It uses different color to highlight an uptrend and a downtrend. Two methods of determining a trend: а) MACD crosses the 0 level (classic signal); б) MACD crosses its own average (early signal). This is a multi-timeframe indicator: it can display MACD data from other timeframes. Two methods of drawing: classic histogram and line. It generates sound and vis
Fractals
Mikhail Nazarenko
The Fractals indicator displays on the chart only fractals with the specified parameters in the indicator settings. This allows you to more accurately record a trend reversal, excluding false reversals. According to the classical definition of a fractal, it is a candlestick - an extremum on the chart, which was not crossed by the price of 2 candles before and 2 candles after the appearance of a fractal candle. This indicator provides the ability to adjust the number of candles before and after t
Nova AC Trader is a modern automation of the Accelerator Oscillator (AC) — a Bill Williams momentum tool designed to detect shifts in market acceleration before trends fully form. This EA transforms the indicator’s early-warning nature into a structured trading system that reacts only when momentum changes are clear and consistent. Instead of waiting for the trend to be obvious, Nova AC Trader identifies when market acceleration starts to turn — offering opportunities at the earliest stage of mo
The RSI Divergence + FVG Signal indicator combines Relative Strength Index (RSI) Divergence with Fair Value Gap (FVG) detection to generate high-probability buy and sell signals based on both momentum shifts and institutional imbalance zones. Core Features: RSI Divergence Detection : Identifies both regular and hidden bullish/bearish divergences between price and RSI. Divergences indicate potential trend reversals or continuation. FVG Zone Recognition : Detects Fair Value Gaps (imbalances caused
##   ONLY GOLD ##   Тiльки Золото ## **Mercaria Professional Trading Zones - Complete Guide** ## **Mercaria Professional Trading Zones - Повний посібник** ### **How Mercaria Zones Work / Як працюють зони Mercaria** **English:** Mercaria Zones is an advanced trading indicator that identifies high-probability support and resistance areas using ZigZag extremes combined with mathematical zone calculations. The indicator works on multiple timeframes simultaneously, providing a comprehensive view
Terra Infinity
Ivan Simonika
Terra Infinity is a flat indicator. This improved version of the CalcFlat indicator has three additional lines that significantly increase its effectiveness. Unlike its predecessor with two static levels, Terra Infinity adds three dynamic lines above the main histogram, which are interpreted as follows: base signal line, minimum signal line, maximum signal line. These lines are formed using the additional parameter Avg, which is the average value of the histogram. Averaging produces a line cl
MACD Intraday Trend PRO는 1960년대 Gerald Appel이 만든 원본 MACD를 개조하여 개발한 지표입니다. 수년간의 거래를 통해 MACD의 매개변수를 피보나치 비율로 변경함으로써 추세 움직임의 연속성을 더 잘 표현함으로써 가격 추세의 시작과 끝을 보다 효율적으로 감지할 수 있다는 것이 관찰되었습니다. 가격 추세를 감지하는 효율성으로 인해 상단과 하단의 차이를 매우 명확하게 식별하여 거래 기회를 더 잘 활용할 수도 있습니다. 특징 표시기 MACD Intraday Trend PRO는 모든 통화 쌍, 모든 시간대 및 Renko 차트에서 작동합니다. 5가지 모드를 선택하여 추세 감지 속도를 설정할 수 있습니다. 가장 빠른 빠른 정상 느린 가장 느림 자원 6개의 구성 가능한 경고가 있습니다. MACD는 신호 라인에서 후퇴 MACD가 신호선을 넘다 MACD는 레벨 0을 교차 신호선이 레벨 0을 넘습니다. MACD 변경 트렌드 색상 신호선 변경 TREND 색상
Vortex MT5
KEENBASE SOFTWARE SOLUTIONS
The Vortex Indicator was first presented by Douglas Siepman and Etienne Botes in January 2010 edition of Technical Analysis of Stocks & Commodities. Despite its based on a complex implosion phenomenon, the vortex is quite simple to interpret. A bullish signal is generated when +VI line cross above the -VI line and vice versa. The indicator is mostly used as a confirmation for trend trading strategies. The Vortex was inspired by the work of Viktor Schauberger, who studied the flow of water in tur
PZ Divergence Trading MT5
PZ TRADING SLU
3.71 (7)
Unlock hidden profits: accurate divergence trading for all markets Tricky to find and scarce in frequency, divergences are one of the most reliable trading scenarios. This indicator finds and scans for regular and hidden divergences automatically using your favourite oscillator. [ Installation Guide | Update Guide | Troubleshooting | FAQ | All Products ] Easy to trade Finds regular and hidden divergences Supports many well known oscillators Implements trading signals based on breakouts Displays
Universal Soul Reaper
Pieter Gerhardus Van Zyl
Universal Soul Reaper is an atmospheric market-flow oscillator designed to interpret price behavior as a cycle of spiritual energy. Instead of reacting to raw price alone, it visualizes the state of the market’s soul —revealing when momentum is awakening, stabilizing, or fading. The indicator operates in a separate window and presents three interwoven entities: the Ectoplasmic Veil , the Spirit Boundary , and the Soul Core . Together, they form a living framework that helps traders sense pressu
The   Fibonacci Confluence Toolkit   is a technical analysis tool designed to help traders identify potential price reversal zones by combining key market signals and patterns. It highlights areas of interest where significant price action or reactions are anticipated, automatically applies Fibonacci retracement levels to outline potential pullback zones, and detects engulfing candle patterns. Its unique strength lies in its reliance solely on price patterns, eliminating the need for user-define
Weis Wave Scouter
Jean Carlos Martins Roso
Weis Wave Scouter는 MetaTrader 5용으로 개발된 혁신적인 지표로, Wyckoff 방법론과 VSA(Volume Spread Analysis)의 검증된 원칙을 결합했습니다. 높은 정확성과 깊이 있는 분석을 원하는 트레이더를 위해 설계되었으며, 누적 거래량 파동 분석을 통해 시장을 전술적으로 읽고 추세 반전 및 지속의 핵심 포인트를 식별하는 데 도움을 줍니다. 이 지표는 선명한 시각적 인터페이스를 제공하며, Classic, NightVision, OceanBreeze 등 다양한 테마의 사용자 지정 가능한 색상 히스토그램을 통해 상승 및 하락 파동을 시각화합니다. 주요 기능에는 거래량 급증 감지, 낮은 활동 영역(DeadZone) 식별, 거래량 기반 파동 반전 경고 설정이 포함되어 있습니다. 또한 노력 대비 결과 분석, 원인과 결과 분석, 수요와 공급 분석 등 Wyckoff 및 VSA 이론의 핵심 요소를 지원합니다. Brick Size, Volume Scale Fact
Smart Stochastic Divergence Detector Description: The Smart Stochastic Divergence Detector is a professional tool that automatically identifies Bullish & Bearish Divergences on your chart using the Stochastic Oscillator . It helps traders detect early reversals , hidden momentum changes , and trend continuation signals without the need for manual analysis. Whether you trade Forex, Indices, Stocks, or Crypto , this tool provides clear divergence signals with arrows and trendlines – allowin
Schaff Trend Cycle STC
Mohammad Taher Halimi Tabrizi
The Schaff Trend Cycle indicator is the product of combining Slow Stochastics and the moving average convergence/divergence (MACD). The MACD has a reputation as a trend indicator, but it's also notorious for lagging due to its slow responsive signal line. The improved signal line gives the STC its relevance as an early warning sign to detect currency trends. this indicator is converted from Trading View code of STC Indicator - A Better MACD [SHK]
Технический индикатор Universal Oscillator является комбинацией торговых сигналов самых популярных и широко используемых осцилляторов. Индикатор представлен гистограммами, а также линиями fast и slow MA, что позволяет расширить список получаемых торговых рекомендаций и работать как по тренду, так и в боковом движении рынка. Таким образом, гистограммы позволяют определить момент пробоя ценовых значений и движение в новой фазе рынка, а линии указывают на зоны перекупленности и перепроданности.  Ос
Rainbow EA MT5
Jamal El Alama
Description : Rainbow EA MT5 is a simple Expert advisor based on   Rainbow MT5 indicator witch is based on Moving average with period 34. The indicator is incorporated in the EA, therefore, it is not required for the EA to operate, but if you wish, you can download it from   my product page . The Expert Advisor settings are as follows : Suitable for Timeframes up to H1 The parameters below can be set according to your trading rules. StopLoss ( Stop Loss in pips) TakeProfit ( Take Profit in pips
TRI Visualizer
Yoshimi Mon 三 Ura
TRI Visualizer MT5 – Thermodynamic Market Analysis Overview The TRI (Thermal Range Indicator) Visualizer Enhanced is a rare market analysis indicator that goes beyond conventional technical analysis, applying principles of thermodynamics from physics. It interprets market price fluctuations as “thermodynamic energy,” enabling the highly accurate detection of subtle market changes that are often overlooked. Innovative Mechanisms 1. Dual Calculation Engines Classic TRI Mode Formula: |Close
MACD Pro Master
Itumeleng Mohlouwa Kgotso Tladi
MACD Pro Master The MACD Pro Master is your ultimate trading companion, designed to revolutionize your financial journey and unlock the doors to wealth. Here's why it's the next best thing since sliced bread: Advantages Precision Trading : The MACD Pro Master leverages the powerful Moving Average Convergence Divergence (MACD) indicator to provide accurate buy and sell trades,  ensuring you capitalize on every market opportunity. Customizable Settings : Tailor the trading strategy to your unique
Stochastic R
Antony Augustine
Stochastic  Reversal  allows you to recognize reversals professionally. Stochastic Indicator: This technical indicator was developed by George Lane more than 50 years ago. The reason why this indicator survived for so many years is because it continues to show consistent signals even in these current times. The Stochastic indicator is a momentum indicator that shows you how strong or weak the current trend is. It helps you identify overbought and oversold market conditions within a trend.  Rules
SMC Order Blocks + FVG — Professional Smart Money Concept Indicator Unlock institutional trading insights with this professional-grade Smart Money Concept indicator. Automatically detect Order Blocks and Fair Value Gaps used by banks and hedge funds. KEY FEATURES: ORDER BLOCKS DETECTION • Automatic bullish and bearish Order Block identification • Based on price action and impulse strength analysis • Real-time mitigation tracking • Customizable imp
HLC bar MT5 Wyckoff
Eduardo Da Costa Custodio Santos
MT5에 대한 표시기 "HLC_bar_MT5 Wyckoff"는 거래 시 분석을 용이하게 하기 위해 생성되었습니다. HLC Bar는 Richard Wyckoff가 사용했으며 현재 "VSA" 작업에서 널리 사용됩니다. Wyckoff는 High, Low 및 Close를 사용하면 그래프가 훨씬 더 명확하고 분석하기 쉽다는 것을 발견했습니다. 표시기 "HLC_bar_MT5 Wyckoff"는 다음을 허용합니다. # 막대 너비를 변경합니다. # 막대를 같은 색으로 둡니다. # 그리고 같은 가격으로 열리고 닫힌 바를 강조 표시합니다. 색상과 너비는 설정에서 쉽게 수정할 수 있습니다. 지표를 사용하려면 차트로 끌어다 놓기만 하면 됩니다. Wyckoff는 볼륨과 함께 사용할 때 HLC 차트를 막대 그래프라고 불렀습니다.
Maximum Trend Arrows OT MT5
Mulweli Valdaz Makulana
STRICTLY FOR BOOM INDEX ONLY!!!!! Here I bring the Maximum Trend Arrows OT1.0 MT5 indicator. This indicator is made up of a combination of different trend indicators for entries and exits, for entries an orange arrow will paint on the chart below the current market and a red flag for closing of trades and it produces buy arrows only. When the orange arrow appears, it will appear along with it's sound to notify you. The 1H timeframe is recommended, don't use it anywhere else than on the 1H timefr
이 제품의 구매자들이 또한 구매함
Azimuth Pro
Ottaviano De Cicco
5 (1)
LAUNCH PROMO Azimuth Pro price is initially set at 299$ for the first 100 buyers. Final price will be 499$ . THE DIFFERENCE BETWEEN RETAIL AND INSTITUTIONAL ENTRIES ISN'T THE INDICATOR — IT'S THE LOCATION. Most traders enter at arbitrary price levels, chasing momentum or reacting to lagging signals. Institutions wait for price to reach structured levels where supply and demand actually shift. Azimuth Pro maps these levels automatically: swing-anchored VWAP, multi-timeframe structure lines, an
무료 AUX 인디케이터와 EA 지원을 받으세요 직접 다운로드 — 여기를 클릭 [ D.I.C.E ] The DICE Indicator  Divergence in Chaos Environment는 엘리엇 파동 이론과 트레이딩 카오스 기법을 함께 사용하는 트레이더를 위해 설계된 MT5 전문 도구입니다. 가격 움직임의 숨겨진 및 일반 다이버전스를 감지하며, 빌 윌리엄스가 설명한 혼돈 시장 환경과 동기화됩니다. 주요 특징 엘리엇 파동 정렬 다이버전스: 파동 구조에 조화된 강세 및 약세 다이버전스를 탐지하여 파동 카운팅 정확도를 높입니다. 카오스 기법 통합: AO(오썸 오실레이터) 및 시장 구조 원칙과 일치하도록 설계되었습니다. 다중 타임프레임 스캐닝: 다양한 시간 프레임에서 다이버전스를 분석하여 모멘텀 변화와 추세 소진을 확인합니다. 시각적 알림 및 객체: 명확한 화살표, 선, 표시로 빠른 인식 가능. 적응형 시장 판독: 혼돈 시장 조건에 자동으로 조정되어 노이즈를 필터링하고 유효한 셋업만
Super Signal – Skyblade Edition 전문가용 노리페인트 / 노래그 트렌드 신호 시스템, 뛰어난 승률 제공 | MT4 / MT5용 1분, 5분, 15분과 같은 낮은 타임프레임에서 가장 좋은 성능을 보입니다. 핵심 기능: Super Signal – Skyblade Edition은 추세 매매를 위해 설계된 스마트 신호 시스템입니다. 이 시스템은 다중 필터 로직을 활용하여, 명확한 방향성과 실질적인 모멘텀이 수반된 고품질 추세만을 감지합니다. 이 시스템은   고점 또는 저점을 예측하지 않으며 , 다음 세 가지 조건이 모두 충족될 때만 신호를 발생시킵니다: 명확한 추세 방향 강화되는 모멘텀 건전한 변동성 구조 또한, 시장 세션 기반의 유동성 분석을 통해 신호의 신뢰성과 타이밍을 더욱 향상시킵니다. 신호 특성: 모든 화살표 신호는 100% 리페인트 없음 / 지연 없음 신호가 한 번 발생하면 고정되며, 깜빡이거나 사라지지 않음 차트 상의 시각적 화살표, 정보 패널, 팝업
Transaction Speed MT5
Ivan Stefanov
5 (2)
이 지표는 시장에서 관심이 나타나는 영역 을 강조 표시한 후, 주문이 누적되는 영역 을 보여줍니다. 이는 **대규모 오더북(호가창)**처럼 작동합니다. 이것은 거대한 자금 을 위한 인디케이터입니다. 성능은 탁월하며, 시장에서 어떤 관심이 있든 반드시 포착할 수 있습니다 . (이것은 완전히 새로 작성되고 자동화된 버전 입니다 – 이제 수동 분석은 필요하지 않습니다.) **거래 속도(Transaction Speed)**는 새로운 개념의 인디케이터로, 시장에 대규모 주문이 언제, 어디에 쌓이는지를 보여주며 , 그 이점을 분석합니다. 매우 초기 단계에서 트렌드 전환 을 감지할 수 있습니다. FX 시장에서 흔히 사용하는 "거래량(volume)"은 오해입니다. 실제로는 시간당 가격 변화량 이므로, 올바른 용어는 거래 속도 입니다. 우리가 어떻게 사고하고, 행동하며, 분석하느냐 가 가장 중요합니다. 분석 패러다임의 전환 은 필수적입니다. 이 인디케이터는 외환 시장에서의 볼륨 개념을 논리적으로
우선적으로, 이 거래 도구는 전문적인 거래에 이상적인 비-다시 그리기 및 지연되지 않는 지표입니다.  온라인 강좌, 사용자 매뉴얼 및 데모. 스마트 가격 액션 컨셉트 인디케이터는 신규 및 경험 많은 트레이더 모두에게 매우 강력한 도구입니다. Inner Circle Trader Analysis 및 Smart Money Concepts Trading Strategies와 같은 고급 거래 아이디어를 결합하여 20가지 이상의 유용한 지표를 하나로 결합합니다. 이 인디케이터는 스마트 머니 컨셉트에 중점을 두어 대형 기관의 거래 방식을 제공하고 이동을 예측하는 데 도움을 줍니다.  특히 유동성 분석에 뛰어나 기관이 어떻게 거래하는지 이해하는 데 도움을 줍니다. 시장 트렌드를 예측하고 가격 변동을 신중하게 분석하는 데 탁월합니다. 귀하의 거래를 기관 전략에 맞추어 시장의 동향에 대해 더 정확한 예측을 할 수 있습니다. 이 인디케이터는 시장 구조를 분석하고 중요한 주문 블록을 식별하고 다양
ARICoins
Temirlan Kdyrkhan
ARICoin is a powerful trading companion designed to generate high-probability entry signals with dynamic TP/SL/DP levels based on volatility. Built-in performance tracking shows win/loss stats, PP1/PP2 hits, and success rates all updated live. Key Features: Buy/Sell signals with adaptive volatility bands Real-time TP/SL/DP levels based on ATR Built-in MA Filter with optional ATR/StdDev volatility Performance stats panel (Success, Profit/Loss, PP1/PP2) Alerts via popup, sound, push, or email Cust
Introduction to X3 Chart Pattern Scanner X3 Cherart Pattern Scanner is the non-repainting and non-lagging indicator detecting X3 chart patterns including Harmonic pattern, Elliott Wave pattern, X3 patterns, and Japanese Candlestick patterns. Historical patterns match with signal patterns. Hence, you can readily develop the solid trading strategy in your chart. More importantly, this superb pattern scanner can detect the optimal pattern of its kind. In addition, you can switch on and off individu
ARIScalping
Temirlan Kdyrkhan
ARIScalp is a powerful trading companion designed to generate high-probability entry signals with dynamic TP/SL/DP levels based on volatility. Built-in performance tracking shows win/loss stats, PP1/PP2 hits, and success rates all updated live. Key Features: Buy/Sell signals with adaptive volatility bands Real-time TP/SL/DP levels based on ATR Built-in MA Filter with optional ATR/StdDev volatility Performance stats panel (Success, Profit/Loss, PP1/PP2) Alerts via popup, sound, push, or email Cus
The Super Arrow Indicator provides non-repainting buy and sell signals with exceptional accuracy. Key Features No repainting – confirmed signals remain fixed Clear visual arrows: green for buy, red for sell Real-time alerts via pop-up, sound, and optional email Clean chart view with no unnecessary clutter Works on all markets: Forex, gold, oil, indices, crypto Adjustable Parameters TimeFrame Default:   "current time frame" Function:   Sets the time frame for indicator calculation Options:   Can
AriX
Temirlan Kdyrkhan
1 (4)
AriX Indicator for MT5 A powerful trend-following and signal-evaluation tool AriX is a custom MT5 indicator that combines Moving Averages and ATR-based risk/reward logic to generate clear buy/sell signals. It visualizes dynamic SL/TP levels, evaluates past trade outcomes, and displays win/loss statistics in a clean on-chart panel. Key features include: Buy/Sell signals based on MA crossovers ATR-based SL/TP1/TP2/TP3 levels with visual lines and labels Signal outcome tracking with real-time stat
MetaForecast M5
Vahidreza Heidar Gholami
5 (3)
MetaForecast는 가격 데이터의 조화를 기반으로 모든 시장의 미래를 예측하고 시각화합니다. 시장이 항상 예측 가능한 것은 아니지만 가격에 패턴이 있다면 MetaForecast는 가능한 정확하게 미래를 예측할 수 있습니다. 다른 유사한 제품과 비교했을 때, MetaForecast는 시장 동향을 분석하여 더 정확한 결과를 생성할 수 있습니다. 입력 매개변수 Past size (과거 크기) MetaForecast가 미래 예측을 생성하기 위한 모델을 만드는 데 사용하는 막대의 수를 지정합니다. 모델은 선택한 막대 위에 그려진 노란색 선으로 표시됩니다. Future size (미래 크기) 예측해야 할 미래 막대의 수를 지정합니다. 예측된 미래는 핑크색 선으로 표시되며 그 위에 파란색 회귀선이 그려집니다. Degree (차수) 이 입력은 MetaForecast가 시장에서 수행할 분석 수준을 결정합니다. Degree 설명  0 차수 0의 경우, "Past size" 입력에 모든 봉우리와
Big Player Range
Thalles Nascimento De Carvalho
5 (3)
BigPlayerRange – MT5 최고의 지표 BigPlayerRange 는 MetaTrader 5에서 미니 인덱스와 미니 달러를 위한 최고의 지표 로 평가받고 있습니다. 이 도구는 주요 기관 투자자들의 전략적 영역을 강조하여 높은 정확도의 기관 기술 분석을 제공합니다. BigPlayerRange 사용법: 이 지표는 매수 구간(녹색선)과 매도 구간(빨간선)을 표시합니다. 가격이 이 구간 밖에서 마감되면 추세 움직임이 예상됩니다. 녹색선 위에서 마감: 강한 매수세와 상승 추세 가능성. 빨간선 아래에서 마감: 매도 압력과 하락 가능성. 범위 내에서 마감: 횡보 시장, 돌파 신호 대기. 주요 혜택: 기관 투자자 영역 매핑: 주요 투자자들의 활동 구간을 식별합니다. 자동 목표 지점 산출: 거래 종료에 적합한 목표 지점을 제공합니다. 풀백 분석: 리스크 관리를 위한 가격 반등 가능성 평가. 활용 방법: BigPlayerRange와 함께 Imba
Rtc ML Ai Predictor
Muhammad Faisal Sagala
Rtc ML Ai | Predictor CORE MACHINE LEARNING ENGINE Adaptive ML Market Predictor – Multi-Bar Trend & Candle Forecast What This Indicator Does This indicator is a  real-time market prediction engine  designed to analyze price behavior and estimate  future market tendencies . Unlike conventional indicators, this system  does not rely on static parameters or historical curve-fitting , but adapts its internal state dynamically during live market operation. Instead of using static rules, the indic
Orderflow Scalp Pro v2.4   delivers institutional-grade trading intelligence through advanced volume analysis, dynamic VWAP calculations, real-time aggressive score monitoring, and precision arrow signals. This complete trading system transforms complex market data into clear, actionable signals for consistent profitability on 3-4 minute timeframes. Full Documentation: [Download PDF] Four Powerful Components in One System Volume Profile HeatMap with POC/VAH/VAL Transform your charts into inst
" Dynamic Scalper System MT5 " 지표는 추세 파동 내에서 스캘핑 방식으로 거래하도록 설계되었습니다. 주요 통화쌍 및 금에서 테스트되었으며, 다른 거래 상품과의 호환성이 가능합니다. 추가적인 가격 변동 지원을 통해 추세에 따라 단기 포지션 진입 신호를 제공합니다. 지표의 원리 큰 화살표는 추세 방향을 결정합니다. 작은 화살표 형태의 스캘핑 신호를 생성하는 알고리즘은 추세 파동 내에서 작동합니다. 빨간색 화살표는 상승 방향을, 파란색 화살표는 하락 방향을 나타냅니다. 민감한 가격 변동선은 추세 방향으로 그려지며, 작은 화살표의 신호와 함께 작용합니다. 신호는 다음과 같이 작동합니다. 적절한 시점에 선이 나타나면 진입 신호가 형성되고, 선이 있는 동안 미결제 포지션을 유지하며, 완료되면 거래를 종료합니다. 권장되는 작업 시간대는 M1~H4입니다. 화살표는 현재 캔들에 형성되며, 다음 캔들이 이미 시작되었더라도 이전 캔들의 화살표는 다시 그려지지 않습니다. 입
물론입니다. 아래는 제공해주신 텍스트의 한국어 번역입니다: MT4용 천문학 지표 소개: 귀하의 최상급 하늘 트레이딩 동반자 트레이딩 경험을 천체의 높이로 끌어올리기 준비가 되셨나요? MT4용 천문학 지표를 소개합니다. 이 혁신적인 도구는 복잡한 알고리즘의 힘을 활용하여 탁월한 천문학적 통찰과 정밀한 계산을 제공합니다. 정보의 우주를 손에 담다:   천문학적 데이터의 보물함을 드러내는 포괄적인 패널을 살펴보세요. 행성의 지오/헬리오센트릭 좌표, 태양/지구 거리, 크기, 길이, 별자리, 황도 좌표 및 적도 좌표, 심지어 수평 좌표 등 각각이 정밀하게 계산되고 아름답게 제시됩니다. 지표에 의해 생성된 수직선은 시간 값에 해당하여 트레이딩 여정에 우주적인 시각을 부여합니다. 행성 라인과 관계:   수정 가능한 스케일과 각도로 차트를 장식하는 행성 라인의 마법을 경험해보세요. 직관적인 컨트롤 패널을 통해 각 행성의 라인의 가시성을 손쉽게 전환할 수 있습니다. 쥰션이나 섹스타일, 사분각, 삼분
Weis Wave with Alert MT5
Trade The Volume Waves Single Member P.C.
4.94 (17)
Rental/Lifetime Package Options and Privileges  Rent Monthly Six Months   Yearly/Lifetime Weis Wave with Speed with Alert+Speed Index x x x Manual  x x x Quick Set up Video x x x Blog x x x Lifetime Updates x x x Setup and Training Material x x Discord Access Channel "The SI traders"          x Rectangle Break Alert Tool      x How to trade with it:    http://www.tradethevolumewaves.com   ** If you purchase please contact me to setup your  : Training Room and  complete manual access.  Wei
RelicusRoad Pro MT5
Relicus LLC
5 (24)
RelicusRoad Pro: 퀀트 시장 운영 체제 70% 할인 평생 이용권 (한정 시간) - 2,000명 이상의 트레이더와 함께하세요 왜 대부분의 트레이더는 "완벽한" 지표를 가지고도 실패할까요? 진공 상태에서 단일 개념 만으로 거래하기 때문입니다. 문맥 없는 신호는 도박입니다. 지속적인 승리를 위해서는 컨플루언스(중첩) 가 필요합니다. RelicusRoad Pro는 단순한 화살표 지표가 아닙니다. 완전한 퀀트 시장 생태계 입니다. 독점적인 변동성 모델링을 사용하여 가격이 이동하는 "공정 가치 로드"를 매핑하고, 단순 노이즈와 실제 구조적 돌파를 구분합니다. 추측은 그만두세요. 기관급 로드 로직으로 거래를 시작하세요. 핵심 엔진: "Road" 알고리즘 시스템의 중심에는 시장 상황에 실시간으로 적응하는 동적 변동성 채널인 Road Algo 가 있습니다. 세이프 라인(평형) 과 가격이 수학적으로 반전될 가능성이 높은 확장 레벨 을 투영합니다. Simple Road: 일반적인 시장을 위
Hunter Spike
Jaime Humberto Gomez Arias
Hunter Spike This indicator consists of two regression channels calibrated with the current movement of the synthetic index algorithm, for any Deriv or Weltrade broker. Each channel has a signal, a target that alerts us when the price touches them, indicating buys on booms or gains and sells on crashes or pains. -configuration for booms or gains: Channel zone 1 (30) Channel zone 2 (0) -configuration for crashes or pains: Channel zone 1 (100) Channel zone 2 (70) Zones freely configurable by
Elliott Wave Trend MT5
Young Ho Seo
4 (4)
Elliott Wave Trend was designed for the scientific wave counting. This tool focuses to get rid of the vagueness of the classic Elliott Wave Counting using the guideline from the template and pattern approach. In doing so, firstly Elliott Wave Trend offers the template for your wave counting. Secondly, it offers Wave Structural Score to assist to identify accurate wave formation. It offers both impulse wave Structural Score and corrective wave Structure Score. Structural Score is the rating to sh
Max Ribbon Mt5
Stefano Frisetti
WARNING: This indicator is distributed EXCLUSIVELY on MQL5.com MT4 version:   https://www.mql5.com/it/market/product/160363 MT5 version:   https://www.mql5.com/it/market/product/160410 ============================================================================================= MAX RIBBON ver 1.00 The indicator that shows you the TREND clearly and unambiguously! ============================================================================================= DESCRIPTION MAX RIBBON is an advanced tre
이 지표는 실제 거래에 완벽한 자동 파동 분석 지표입니다! 사례... 참고:   웨이브 그레이딩에 서양식 이름을 사용하는 데 익숙하지 않습니다. Tang Lun(Tang Zhong Shuo Zen)의 명명 규칙의 영향으로 기본 웨이브를   펜   으로 명명하고 2차 웨이브 밴드를   세그먼트   로 명명했습니다. 동시에, 세그먼트에는 추세 방향이 있습니다.   주요 추세 세그먼트에는   이름이 지정되지만(이 이름 지정 방법은 향후 노트에서 사용됩니다. 먼저 말씀드리겠습니다.) 알고리즘은 굴곡 이론과 거의 관련이 없으므로 그렇게 해서는 안 됩니다. 이는 나의 시장 분석을   통해 요약된 끊임없이 변화하고 복잡한 운영 규칙을   반영합니다. 밴드는 더 이상 사람마다 다르지 않도록 표준화되고 정의되었습니다. 인위적인 간섭의 드로잉 방법은 시장 진입을 엄격하게 분석하는 데 핵심적인 역할을 합니다. 이 지표를 사용하는 것은 거래 인터페이스의 미학을 개선하고 원래의 K-line 거래를
FootprintOrderflow
Jingfeng Luo
5 (3)
FOOTPRINTORDERFLOW: The Authoritative Guide ( This indicator is also compatible with economic providers that do not offer DOM data and BID/ASK data, It also supports various foreign exchange transactions, DEMO version,modleling must choose " Every tick based on real ticks"  ) Important notice: Before placing an order, please contact me first, and I will provide you with professional answers and services 1. Overview FOOTPRINTORDERFLOW  is an advanced Order Flow analysis tool designed for MetaTra
WVAP Scalping
Domantas Juodenis
VWAP Scalping Pro – Advanced VWAP & Market Profile System Professional-Grade VWAP + Market Profile Technology for Precision Trading VWAP Scalping Pro is an advanced analytical tool that integrates Volume-Weighted Average Price (VWAP) analysis with professional Market Profile visualization. It provides traders with institutional-style insights into price structure, volume distribution, and session dynamics — ideal for scalping, intraday, and swing trading strategies. Key Features Triple VWAP St
무료 AUX 지표, EA 지원 및 전체 가이드를 얻으시려면 방문하세요 – https://www.mql5.com/en/blogs/post/763955 트렌드를 포착하세요. 패턴을 읽으세요. 진입 시점을 타이밍하세요. 30초 이내의 3단계! 분석 없이도 쉽게 거래하세요 — 당신의 스마트 어시스턴트가 워크플로우를 단순화해 드립니다. 더 이상 차트 과부하 없음. 스마트 바이어스 감지로 자신감 있게 거래하세요. 모든 통화, 암호화폐, 주식, 금속, 지수 및 모든 시간대와 호환됩니다. 그냥 클릭하고 실행하세요 — 정말 간단합니다. 속도와 명확성을 원하는 바쁜 트레이더에게 이상적입니다. TPTSyncX는 추세, 패턴, 그리고 캔들스틱 트리거 분석을 하나로 통합하여 깨끗하고 지능적인 시각 시스템으로 동기화하는 강력한 올인원 MetaTrader 5 인디케이터입니다. 명확성, 정밀성, 속도를 원하는 트레이더를 위해 설계되었으며, 가격 행동, 구조적 패턴 및 시장 타이밍 도구의 조합을 통해 높은 확
VTrende Pro
Andrii Diachenko
5 (1)
VTrende Pro - MTF indicator for trend trading with a display panel for MT5 *** Videos can be translated into any language using subtitles (video language - Russian) Although the signals of the VTrende Pro indicator can be used as signals of a full-fledged trading system, it is recommended to use them in conjunction with the Bill Williams TS. VTrende Pro is an extended version of the VTrende indicator. Difference between Pro version and VTrende: - Time zones - Signal V - signal 1-2 waves -    S
SynaptixQuant Dominance Matrix
Devie Arevalo Montemayor
5 (1)
SynaptixQuant Dominance Matrix: Institutional-Grade Market State Extraction Engineered for traders who require a data-driven view of market behaviour beyond surface-level indicators. The Synaptix Quant (SQ) Dominance Matrix is not a conventional currency strength display. Behind its intentionally streamlined interface runs a sophisticated analytical architecture designed to quantify market conditions with precision. Every output is generated through layered signal processing built to identify d
Reversal regression indicator
Marrion Netondo Wabomba
Multi Kernel Regression Indicator MT5 Professional Non-Repainting Trend Following System with 17 Advanced Kernel Functions Overview The Multi Kernel Regression indicator is a sophisticated technical analysis tool that applies advanced statistical kernel regression methods to price data, offering traders a powerful edge in identifying trends and potential reversal points. Unlike traditional moving averages, kernel regression provides adaptive smoothing that responds intelligently to market dynam
Step into the world of Forex trading with confidence, clarity, and precision using Gold Indicator a next-generation tool engineered to take your trading performance to the next level. Whether you’re a seasoned professional or just beginning your journey in the currency markets, Gold Indicator equips you with powerful insights and help you trade smarter, not harder. Built on the proven synergy of three advanced indicators, Gold Indicator focuses exclusively on medium and long-term trends elimina
TrendMaestro5
Stefano Frisetti
note: this indicator is for METATRADER4, if you want the version for METATRADER5 this is the link:  https://www.mql5.com/it/market/product/108106 TRENDMAESTRO ver 2.5 TRENDMAESTRO recognizes a new TREND from the start, he never makes mistakes. The certainty of identifying a new TREND is priceless. DESCRIPTION TRENDMAESTRO identifies a new TREND in the bud, this indicator examines the volatility, volumes and momentum to identify the moment in which there is an explosion of one or more of these da
제작자의 제품 더 보기
Big Player Range
Thalles Nascimento De Carvalho
5 (3)
BigPlayerRange – MT5 최고의 지표 BigPlayerRange 는 MetaTrader 5에서 미니 인덱스와 미니 달러를 위한 최고의 지표 로 평가받고 있습니다. 이 도구는 주요 기관 투자자들의 전략적 영역을 강조하여 높은 정확도의 기관 기술 분석을 제공합니다. BigPlayerRange 사용법: 이 지표는 매수 구간(녹색선)과 매도 구간(빨간선)을 표시합니다. 가격이 이 구간 밖에서 마감되면 추세 움직임이 예상됩니다. 녹색선 위에서 마감: 강한 매수세와 상승 추세 가능성. 빨간선 아래에서 마감: 매도 압력과 하락 가능성. 범위 내에서 마감: 횡보 시장, 돌파 신호 대기. 주요 혜택: 기관 투자자 영역 매핑: 주요 투자자들의 활동 구간을 식별합니다. 자동 목표 지점 산출: 거래 종료에 적합한 목표 지점을 제공합니다. 풀백 분석: 리스크 관리를 위한 가격 반등 가능성 평가. 활용 방법: BigPlayerRange와 함께 Imba
Box Weis Wave
Thalles Nascimento De Carvalho
5 (1)
Weis Wave Box 와 함께 분석을 업그레이드하세요! 정확하고 명확한 트레이딩 을 원하신다면, Weis Wave Box 가 이상적인 도구입니다. 이 고급 볼륨 웨이브 지표 는 시장에서 노력과 결과 간의 역학을 명확하게 시각화하여, 주문 흐름과 볼륨 분석을 사용하는 트레이더에게 필수적입니다. 주요 기능: 사용자 지정 가능한 볼륨 웨이브 – 전략에 맞게 틱 단위로 조절 가능. 조정 가능한 히스토리 – 특정 기간을 더 정확하게 분석. 실제 거래량 vs 틱 수 – 시장에 미치는 실제 영향 이해. 시각적 에너지 박스 – 시장의 높은 노력과 낮은 움직임 영역 확인. ️ 5가지 스윙 유형 – totalVol, length, width, barDVol, lengthDVol 기반 맞춤 설정 가능. 실제 혜택: 볼륨 로직에 대한 시각적 명확성 주도하는 매수 또는 매도 세력 식별 잠재적 반전 또는 지속 신호 제공 관련 지표 Big Player Range – 기
VWAP FanMaster
Thalles Nascimento De Carvalho
3.5 (2)
VWAP FanMaster: 정확한 풀백 전략을 마스터하자! VWAP FanMaster 는 정확한 진입점 과 효율적인 풀백 을 찾는 트레이더를 위한 궁극적인 지표입니다. **VWAP(거래량 가중 평균 가격)**과 피보나치 팬 라인 을 결합하여 시장에서 중요한 가격 영역을 명확하게 표시합니다. 주요 기능 간단하고 강력함 : 수직선을 이동시키기만 하면 자동으로 VWAP 과 피보나치 팬 라인 이 그려집니다. 스마트한 거래 전략 : 가격이 그려진 영역으로 되돌아오는 것을 기다린 후, 완벽한 풀백 을 지원 및 저항 레벨에서 포착하세요. 고급 시각적 도구 : 가격의 융합 영역 을 즉시 찾아서 신속하고 정확한 거래 결정을 내리세요. VWAP FanMaster를 선택해야 하는 이유 초보자도 쉽게 사용할 수 있음 . 두 가지 강력한 분석 도구 를 결합하여 거래 정확도를 높입니다. 위험 관리 개선 을 위한 명확하고 일관된 가격 예측 제공. VWAP F
FREE
Tape Hunter
Thalles Nascimento De Carvalho
Tape Hunter – MT5에서 노력과 결과를 확인하는 레이더 Tape Hunter는 MetaTrader 5에서 가격 뒤에 숨겨진 진짜 움직임을 보고자 하는 트레이더를 위한 최고의 인디케이터입니다. POC(Point of Control)를 기반으로 매수와 매도의 공격적인 거래량을 명확하고 직관적으로 보여주며, 각 캔들에서 시장의 노력과 실제 결과를 시각화할 수 있습니다. ️ 왜 중요한가요? 모든 거래량이 가격을 움직이는 것은 아닙니다! Tape Hunter는 노력(공격적인 거래량)이 실제로 가격을 움직이고 있는지 강조하며, 다음을 파악하는 데 도움을 줍니다: 진짜 공격과 함정이 어디에 있는지 시장이 흡수되고 있는지, 아니면 밀리고 있는지 지배적인 거래량과 가격 방향의 일치 여부 Tape Hunter를 사용하면 프로페셔널한 테이프 리딩 관점을 얻어 더 정확한 진입과 청산 결정을 내릴 수 있습니다. 관련 인디케이터 – 플로우 분석 강화하기 보다 효율적인 트레
Footprint Hunter
Thalles Nascimento De Carvalho
Footprint Hunter – MT4에서 노력과 결과를 확인하는 레이더 Tape Hunter는 MetaTrader 4에서 가격 뒤에 숨겨진 진짜 움직임을 보고자 하는 트레이더를 위한 최고의 인디케이터입니다. POC(Point of Control)를 기반으로 매수와 매도의 공격적인 거래량을 명확하고 직관적으로 보여주며, 각 캔들에서 시장의 노력과 실제 결과를 시각화할 수 있습니다. ️ 왜 중요한가요? 모든 거래량이 가격을 움직이는 것은 아닙니다! Tape Hunter는 노력(공격적인 거래량)이 실제로 가격을 움직이고 있는지 강조하며, 다음을 파악하는 데 도움을 줍니다: 진짜 공격과 함정이 어디에 있는지 시장이 흡수되고 있는지, 아니면 밀리고 있는지 지배적인 거래량과 가격 방향의 일치 여부 Tape Hunter를 사용하면 프로페셔널한 테이프 리딩 관점을 얻어 더 정확한 진입과 청산 결정을 내릴 수 있습니다. 관련 인디케이터 – 플로우 분석 강화하기 보다 효율
Swing Point Volume
Thalles Nascimento De Carvalho
Swing Point Volume, the indicator that signals weakness and strength at the tops and bottoms. This indicador can be for used the Wyckoff Method. Information provided; - Swing on customized ticks. - Volume and points in each balance sheet. - Percentage of Displacement. - Sound alert option on top and bottom breaks. - Volume in ticks and Real Volume. - Volume HL (extreme) or (opening and closing) - Customized volume shapes.
Imbalance DOM Pro
Thalles Nascimento De Carvalho
5 (1)
Imbalance DOM Pro: 주문서의 불균형으로 거래를 강화하세요 MT5에서 주문서에 접근할 수 있나요? 거래를 새로운 수준으로 끌어올리고 싶나요? 주문 흐름을 기반으로 결정을 내리는 트레이더라면, Imbalance DOM Pro가 분석을 혁신적으로 바꿔줄 것입니다. 스캘퍼와 단기 트레이더를 위해 설계된 이 도구는 주문서의 불균형을 식별하고, 빠르고 정확한 진입과 청산을 위한 귀중한 거래 기회를 제공합니다. 작은 가격 변동에서 기회를 잡으세요 Imbalance DOM Pro는 작은 가격 변동을 잡고자 하는 트레이더에게 이상적인 도구입니다. 고급 계산을 통해 이 지표는 주문서의 불균형을 해석하고, 빠른 진입과 청산을 위한 중요한 정보를 제공합니다. 중요: MT5에서 주문서의 사용 가능 여부를 확인하세요 Imbalance DOM Pro를 사용하기 전에, 브로커가 MT5에서 주문서에 접근할 수 있는지 확인하세요. 이 지표는 실시간 데이터에 의존하기 때문에, M
Volume Flow Binance
Thalles Nascimento De Carvalho
Volume Flow Binance! 당신이 선호하는 암호화폐의 times and trades 데이터에 접근하고, 거래량 흐름과 가격 변동 분석에 대한 세부 정보를 얻을 수 있다고 상상해 본 적이 있나요? 심지어 브로커가 거래 기록에 대한 완전한 접근을 제공하지 않더라도 말이죠? Volume Flow Binance 로 이제 그것이 현실이 됩니다! 이 MQL5 스크립트는 실시간 시장 동향에 대한 상세한 뷰를 원하는 암호화폐 트레이더를 위해 설계되었습니다. 주요 특징: 스크립트 메뉴에서 사용 가능한 모든 암호화폐의 times and trades 데이터에 직접 접근. 세계적인 거래소인 Binance에서 실시간 데이터 업데이트. 가격 변동을 예측하고 거래량 흐름을 정확하게 분석. Times and Sales Crypto 인디케이터 와의 통합으로 시장 분석을 다음 수준으로 향상. 왜 Volume Flow Binance를 선택해야 할까요? 실시간으로 매
FREE
Book Data Binance
Thalles Nascimento De Carvalho
Book Data Binance! 좋아하는 암호화폐의 오더북에 접근하여 가격, 거래량, 불균형 분석의 세부 정보를 확인할 수 있다고 상상해 보세요. 거래소에서 DOM에 대한 접근을 제공하지 않더라도 말이죠. Book Data Binance와 함께라면 이제 그 꿈이 현실이 됩니다! 이 MQL5 스크립트는 시장의 역학을 깊이 이해하고자 하는 암호화폐 트레이더를 위해 특별히 개발되었습니다. 주요 기능: 스크립트 메뉴에서 사용할 수 있는 모든 암호화폐의 오더북에 직접 접근. 세계 최고의 거래소 중 하나인 Binance에서 제공하는 실시간 데이터 업데이트. 오더북의 불균형을 정확하게 분석하여 가격 변동을 식별하고 예측할 수 있습니다. Imbalance DOM Crypto 지표 와 통합되어 시장 분석을 다음 단계로 끌어올립니다. 왜 Book Data Binance를 선택해야 할까요? 각 가격 수준에서 구매자와 판매자의 행동을 이해하고자 하는 모든 분들에
FREE
Cumulative Volume Bands
Thalles Nascimento De Carvalho
CVB Cumulative Volume Bands: 누적 거래량으로 트레이드를 강화하세요! CVB Cumulative Volume Bands 는 누적 거래량에 기반한 정확한 신호를 찾는 트레이더를 위해 설계된 고급 지표입니다. 이 지표는 누적 거래량 밴드를 사용하여 시장의 매수 및 매도 압력을 명확하게 읽고, 반전 및 강력한 가격 변동을 식별하는 데 도움을 줍니다. Cumulative Volume Bands for MT5 ! 주요 특징: 누적 거래량 분석 : 거래량을 기반으로 주요 압력 지점을 감지합니다. 명확한 진입/퇴출 신호 : 실시간으로 기회를 포착하세요. 쉬운 해석 : 사용자 친화적인 인터페이스와 간단한 시각적 표현. 모든 자산 및 시간 프레임에 적합 : 모든 시장에서 언제든지 사용 가능합니다. CVB Cumulative Volume Bands 로 한 발 앞서 나가며 자신감을 가지고 트레이딩 결정을 개선하세요! 피드백
Atr Projection
Thalles Nascimento De Carvalho
ATR 프로젝션 지표는 금융 시장에서 가격 움직임의 잠재적 한계에 대한 정확한 통찰을 제공하도록 설계된 강력한 도구로, 기술적 분석에서 두드러지고 있습니다. 유연한 접근 방식으로 사용자는 각 거래 자산의 특정한 요구에 맞게 분석 메트릭스를 직관적으로 사용자 정의할 수 있습니다. 사용자 정의 가능한 운영: 기본 설정으로 ATR 프로젝션은 최근 100개의 캔들의 평균 중 30%를 고려하여 작동합니다. 이러한 유연성은 사용자가 각 자산의 특징과 선호도에 따라 메트릭스를 조정할 수 있도록 하여 더 개인화된 분석을 제공합니다. 30%와 100개 캔들의 선택에 대한 논리: 선택된 백분율과 캔들 수의 신중한 선택은 최근의 중요한 움직임을 포착하여 더 정확한 예측을 제공하려는 것입니다. 이 전략적 접근은 가격이 이동할 가능성이 높은 지역을 강조하여 트레이더에게 더 잘 통찰력을 제공합니다. ATR 프로젝션의 이점: 1. 사용자 정의 가능한 기술적 정확성: 사용자는 각 거래 자산의 특정 조
Long Short Pro
Thalles Nascimento De Carvalho
Long & Short 지표 - Pro 버전: 무한한 시장 분석 잠재력을 열어보세요! 모든 자산에 제한 없이 사용 Long & Short 지표의 Pro 버전은 모든 금융 자산에서 완전한 자유를 제공합니다. 이제 제한 없이 동일한 지표를 모든 선호 자산에 적용할 수 있습니다! 제한 없음 지표의 모든 기능을 제한 없이 사용하세요. Pro 버전은 완전하고 무제한의 경험을 제공하며, 모든 시장 기회를 최대한 활용할 수 있게 해줍니다. Pro 버전의 특징 무제한 접근 : 모든 금융 자산에서 지표를 사용하고 그 잠재력을 최대한 발휘하세요. 고급 정밀도 : 상세한 분석과 명확한 신호를 통해 정보에 기반한 안전한 결정을 내리세요. 완전한 유연성 : 자산이나 전략에 관계없이 거래 요구에 맞게 지표를 조정하세요. 중요한 기회에 대한 알림 받기 알림을 활성화하여 중요한 수준을 주의 깊게 모니터링하고 시장 기회에서 항상 앞서 나가세요. EA 구축을 위한 버퍼 파라미터
AI Channel
Thalles Nascimento De Carvalho
AI Channel | MT5용 인공지능 기반 가격 채널 지표 AI Channel: 진보된 기술 분석을 위한 인공지능 기반 도구 AI Channel 은 금융 시장에서 가격 채널을 분석하기 위해 인공지능 을 활용하는 강력한 도구입니다. 이 섹션에서는 이 혁신적인 지표가 투자자와 트레이더가 더 정보에 기반한 전략적 결정을 내리는 데 어떻게 도움을 주는지 살펴봅니다. AI Channel이란? AI Channel 은 고급 인공지능 알고리즘을 기반으로 개발된 지표입니다. 과거 가격 데이터를 사용하여 거래 채널을 식별하고 차트에서 중요한 지지선과 저항선을 강조 표시합니다. 이 분석을 바탕으로 시장 진입 및 청산의 유용한 인사이트를 제공합니다. ️ AI Channel 작동 원리 AI Channel은 인공지능을 가격 채널에 적용하여 자산의 추세, 패턴 및 과거 움직임을 분석합니다. 이 지표는 시장 변화에 따라 동적으로 적응하며 다양한 시간대와 금융 상품에 적용 가능합
Didi Index Volume
Thalles Nascimento De Carvalho
디디 지수 볼륨(Didi Index Volume)을 소개합니다. 이는 브라질 트레이더 오디르 아기아르(Odir Aguiar)이 개발한 기술적 분석 지표로, 금융 시장에서 기회를 식별하는 고급이고 강력한 접근 방식으로 주목받고 있습니다. 다양한 플랫폼에서 이용 가능한 디디 지수 볼륨은 정확한 통찰력과 가치 있는 정보를 찾는 트레이더들에게 필수적인 도구가 되었습니다. 이 지표는 오디르 아기아르가 개발한 유명한 디디 지수(Didi Index)와 거래량의 지능적인 활용을 결합합니다. 이 조합은 가격 동작과 거래량의 상호작용을 더 깊게 분석하여 자산의 움직임에 대한 독특한 시각을 제공합니다. 정교한 알고리즘과 가중 평균 계산을 통해 디디 지수 볼륨은 거래량을 기반으로 가격 변동을 예측할 수 있습니다. 이 기능은 신흥 트렌드, 시장 반전 및 적시적인 진입 및 청산 시점을 파악하는 데 매우 중요합니다. 디디 지수 볼륨을 사용하면 정확한 시장 해석을 돕고 허무맹랑한 결정을 피할 수 있는 객관
TimeChannel
Thalles Nascimento De Carvalho
The "Timechannel" is a powerful technical analysis tool designed specifically for traders who want to gain deeper and more accurate insights into price movements across multiple timeframes (multi-timeframe). This indicator is an essential addition to the toolbox of any serious trader seeking to make informed and data-driven trading decisions. Key Features: Advanced Multi-Timeframe Analysis : Timechannel allows traders to analyze price movements on different timeframes simultaneously. This is cr
Master OBV
Thalles Nascimento De Carvalho
MasterOBV: 시장 트렌드를 정확하게 파악하세요! MasterOBV 는 거래량 , 긍정적 상관관계 및 **이동 평균선(MA)**을 결합한 기술 분석 지표 로, 금융 시장에서 트렌드를 식별하는 능력을 향상시킵니다. 주요 기능: 스마트 거래량: 거래량을 분석하여 트렌드 강도의 중요한 변화를 식별합니다. 긍정적 상관관계: 상관된 자산을 포함하여 보다 넓고 정확한 시각을 제공하며, 쌍의 거래량을 기반으로 가격 이동 잠재력을 강화합니다. 비주얼 채널: 비주얼 채널을 사용하여 트렌드의 지속성과 반전 가능성을 명확하고 정확하게 평가하며 직관적인 시각 분석을 제공합니다. 스무딩 이동 평균선: MA는 가격의 변동을 부드럽게 하여 기본 트렌드 방향을 더 쉽게 식별할 수 있게 합니다. 왜 MasterOBV를 선택해야 하는가? 결정에 대한 자신감: 여러 요소를 통합하여 신뢰를 가지고 진입 및 퇴출 결정을 내릴 수 있도록 도와줍니다. 종합 분석: 가격뿐만
VolaMetrics VSA
Thalles Nascimento De Carvalho
VolaMetrics VSA | 기술 분석의 강력한 동반자 VolaMetrics VSA 는 Volume Spread Analysis (VSA) 방법론과 자세한 거래량 분석 을 결합한 기술 분석 지표입니다. 중요한 가격 변동 을 식별 하고 추적 하기 위해 설계된 이 도구는 거래량 과 가격 스프레드 의 상호작용을 활용하여 트레이딩 결정에 도움이 되는 귀중한 통찰을 제공합니다. Volume Spread Analysis (VSA)의 기초 **Volume Spread Analysis (VSA)**는 기술 분석에서 존경받는 방법으로, 거래량 , 가격 스프레드 및 종가 간의 관계를 특정 기간 내에 이해하는 데 중점을 둡니다. 가장 정보가 풍부한 운영자 ( 스마트 머니 )가 가격 움직임에 영향을 미친다는 개념에 기반하여, VSA는 축적 또는 분배 신호 를 식별하고 가격의 중요한 변화를 예측합니다. VolaMetrics VSA의 작동 원리 ️ VolaMetrics VSA 는 전통적인 V
SwingVolumePro
Thalles Nascimento De Carvalho
개요 SwingVolumePro 는 다양한 금융 자산에 적용할 수 있도록 설계된 고급 다목적 지표입니다. 엄격한 거래량과 가격 분석을 기반으로 개발되었으며, 모든 수준의 트레이더가 고품질 데이터에 기반하여 정보에 입각한 결정을 내릴 수 있도록 명확하고 정확한 신호를 제공합니다. SwingVolumePro.PDF 주요 특징 다재다능성: SwingVolumePro는 주식, 외환, 암호화폐 등 다양한 자산에 적용할 수 있습니다. 스캘핑에서 장기 포지션까지 다양한 거래 전략에 적합합니다. 정확하고 신뢰할 수 있는 신호: SwingVolumePro는 가격 흡수 패턴과 시장 공격을 식별하기 위해 복잡한 기술을 사용하여 높은 정확도의 신호를 제공합니다. 이러한 신호는 명확하게 표시되어 신속하고 효과적인 의사 결정을 돕습니다. 고급 거래량 및 가격 분석: 이 지표는 거래량과 가격 간의 상호 작용을 상세히 분석하여 노력과 결과 간의 불일치를 감지하고, 잠재적인 시장 움
CVD SmoothFlow Pro
Thalles Nascimento De Carvalho
CVD SmoothFlow Pro - 모든 자산에 대한 무제한 볼륨 분석! CVD SmoothFlow Pro 는 정밀하고 무제한의 볼륨 분석을 원하는 트레이더를 위한 최적의 솔루션입니다. Cumulative Volume Delta (CVD) 계산과 고급 노이즈 필터링을 활용하여, Pro 버전은 모든 금융 자산 거래에 필요한 유연성과 정확성을 제공합니다. CVD SmoothFlow Pro가 제공하는 기능: 명확한 분석 : 시장 노이즈를 필터링하고 모든 금융 자산에서 중요한 볼륨 변동을 강조합니다. ️ 정확한 계산 : 매수와 매도 차이를 모니터링하여 외환, 지수, 암호화폐 등 자산의 볼륨 행동을 상세히 제공합니다. 직관적인 인터페이스 : 데이터가 명확하게 제시되어 분석이 쉽고 효율적입니다. 트렌드 식별 : 시장 트렌드를 자신 있게 식별하여 정보에 기반한 결정을 지원합니다. 실용적인 적용: 모든 자산의 실시간 매수자와 매도자 균형을 모니터링합니다. 볼륨을 기반
Cumulative Vol Bands
Thalles Nascimento De Carvalho
CVB Cumulative Volume Bands: 누적 거래량으로 트레이드를 강화하세요! CVB Cumulative Volume Bands 는 누적 거래량에 기반한 정확한 신호를 찾는 트레이더를 위해 설계된 고급 지표입니다. 이 지표는 누적 거래량 밴드를 사용하여 시장의 매수 및 매도 압력을 명확하게 읽고, 반전 및 강력한 가격 변동을 식별하는 데 도움을 줍니다. 주요 특징: 누적 거래량 분석 : 거래량을 기반으로 주요 압력 지점을 감지합니다. 명확한 진입/퇴출 신호 : 실시간으로 기회를 포착하세요. 쉬운 해석 : 사용자 친화적인 인터페이스와 간단한 시각적 표현. 모든 자산 및 시간 프레임에 적합 : 모든 시장에서 언제든지 사용 가능합니다. CVB Cumulative Volume Bands 로 한 발 앞서 나가며 자신감을 가지고 트레이딩 결정을 개선하세요! 피드백을 남기시고 개선에 도움을 주세요!
ZigWave Oscillator
Thalles Nascimento De Carvalho
ZigWave Oscillator: 오실레이터와 ZigZag로 거래를 강화하세요! ZigWave Oscillator는 금융 시장 분석에서 정확성과 명확성을 추구하는 트레이더를 위한 완벽한 도구입니다. 이 지표는 오실레이터의 강점과 ZigZag의 시각적 단순성을 결합하여 최고의 매수 및 매도 기회를 신속하고 효율적으로 식별할 수 있도록 도와줍니다. ZigWave Oscillator를 선택해야 하는 이유 정밀한 오실레이터 분석 : RSI, Williams %R 또는 CCI를 통합하여 시장의 주요 움직임을 포착합니다. 동적 ZigZag와 세밀한 조정 : ZigZag 스윙은 오실레이터의 과매수 및 과매도 영역에서 세밀하게 조정되어 반전 포인트를 명확히 강조합니다. 완전한 커스터마이즈 ️: 오실레이터와 ZigZag의 설정을 조정하여 자신의 전략에 맞게 최적화할 수 있습니다. 직관적이고 사용하기 쉬운 디자인 세련되고 사용자 정의 가능한 시각적 레이아웃으로 Zig
Times and Sales Pro
Thalles Nascimento De Carvalho
Times and Sales Pro: 거래 흐름의 불균형으로 거래를 강화하세요 작은 가격 변동의 기회 Times and Sales Pro 는 Times and Trades 를 통해 주문 흐름을 운영하는 분석가들에게 필수적인 도구입니다. 스캘퍼에게 이상적이며, 높은 정확도로 작은 가격 변동을 활용하고자 하는 분들을 위해 설계되었습니다. 고급 계산을 통해 이 지표는 거래의 불균형을 식별하여 빠른 진입 및 퇴출을 위한 귀중한 신호를 제공합니다. 중요: MT5에서의 Times and Trades 이용 가능성 Times and Sales Pro 를 사용하기 전에 브로커가 MT5에서 Times and Trades 에 대한 접근을 제공하는지 확인하세요. 이 지표는 실시간으로 정확한 계산을 생성하기 위해 이 데이터에 의존하며, MT5는 거래 이력을 저장하지 않습니다. 따라서 이 지표는 실시간에서만 작동하며, 시장에서 실행된 거래에 대한 즉각적인 통찰을 제공합니다. Ti
Mini Indice Composition
Thalles Nascimento De Carvalho
Mini Índice Composition: A Revolução na Análise do Mini Índice! O Mini Índice Composition é um indicador inovador que monitora em tempo real as principais ações que compõem o mini índice, trazendo uma visão quantitativa poderosa sobre o fluxo de ordens do mercado! Como Funciona? Diferente de outros indicadores que utilizam apenas dados históricos, o Mini Índice Composition faz uma leitura ao vivo das ordens que entram e saem das ações, pesando o impacto direto no mini índice. Com
Radar DI
Thalles Nascimento De Carvalho
Radar DI – Indicador de Taxa de Juros para Mini Índice e Mini Dólar com Exportação CSV e Integração IA Radar DI é um indicador especializado que transforma as variações da taxa de juros DI (Depósitos Interfinanceiros) em sinais operacionais estratégicos para os ativos mini índice (WIN) e mini dólar (WDO) . NOVA FUNCIONALIDADE: Exportação CSV + Integração com IA Agora o Radar DI permite exportar todos os dados em formato CSV , incluindo: Variações dos DIs Variação do Mini Índice (WIN)
LSTM Library
Thalles Nascimento De Carvalho
LSTM Library - MetaTrader 5용 고급 신경망 알고리즘 트레이딩을 위한 전문 신경망 라이브러리 LSTM Library는 MQL5 트레이딩 전략에 순환 신경망의 힘을 가져다줍니다. 이 전문적인 구현에는 일반적으로 특수 기계 학습 프레임워크에서만 볼 수 있는 고급 기능을 갖춘 LSTM, BiLSTM 및 GRU 네트워크가 포함되어 있습니다. "트레이딩을 위한 기계 학습의 성공 비결은 적절한 데이터 처리에 있습니다. 쓰레기를 넣으면 쓰레기가 나옵니다 – 예측의 품질은 절대 훈련 데이터의 품질을 넘을 수 없습니다." — 마르코스 로페즈 데 프라도 박사, Advances in Financial Machine Learning 주요 기능 LSTM, BiLSTM 및 GRU의 완전한 구현 더 나은 일반화를 위한 재귀 드롭아웃 다양한 최적화 알고리즘(Adam, AdamW, RAdam) 고급 정규화 기술 포괄적인 지표 평가 시스템 훈련 진행 시각화 클래스 가중치를 통한 불균형 데이터 지
필터:
리뷰 없음
리뷰 답변