Gekko MACD Plus
- 지표
- Rodrigo Galeote
- 버전: 1.14
- 업데이트됨: 17 2월 2023
- 활성화: 5
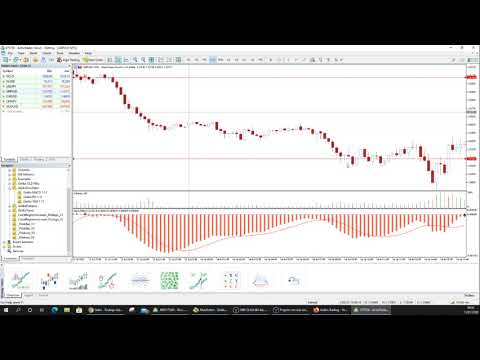
Type: Oscillator
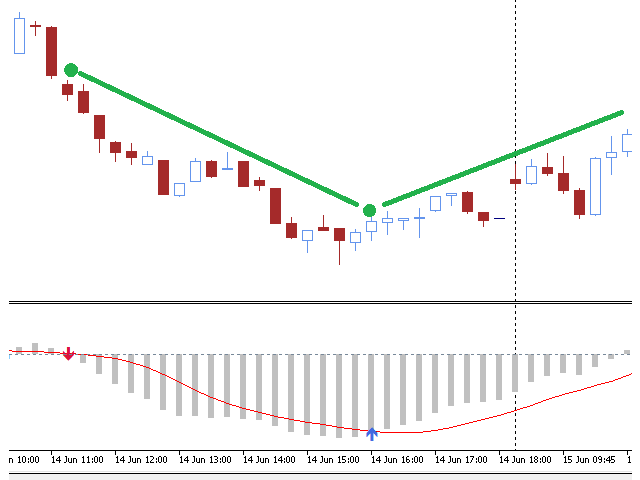
This is Gekko's Cutomized Moving Average Convergence/Divergence (MACD), a customized version of the famous MACD indicator. Use the regular MACD and take advantage of several entry signals calculations and different ways of being alerted whenever there is potential entry point.
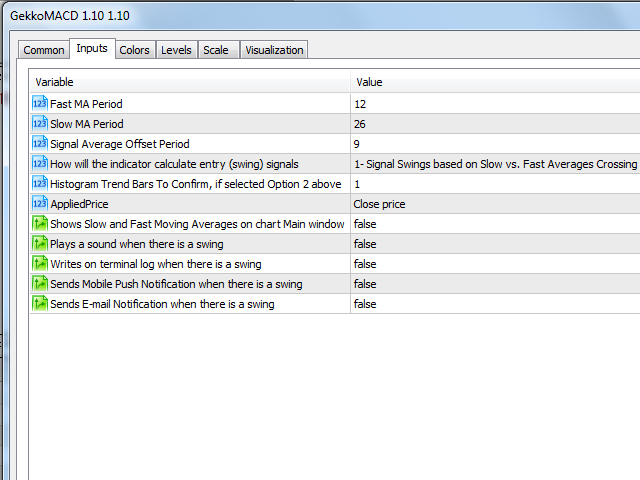
Inputs
- Fast MA Period: Period for the MACD's Fast Moving Average (default 12);
- Slow MA Period: Period for the MACD's Slow Moving Average (default 26);
- Signal Average Offset Period: Period for the Signal Average on the MACD;
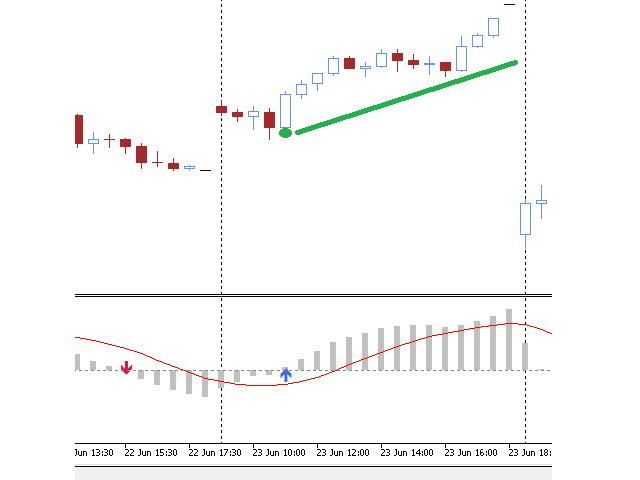
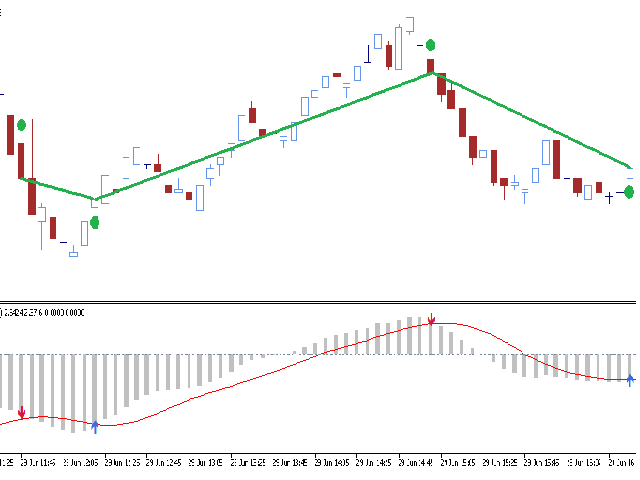
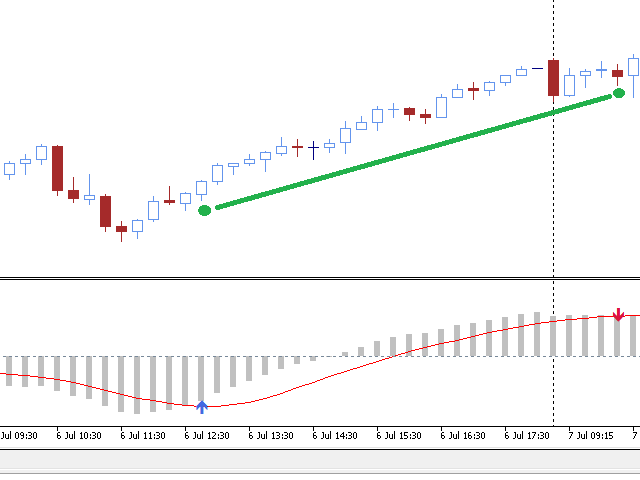
- How will the indicator calculate entry (swing) signals:
- 1- Produces Entry/Exit Signals for Swings based on Slow vs. Fast Averages Crossing;
- 2- Produces Entry/Exit Signals for Swings based on Histogram bars changes on Trend (Fast and Slow MA delta);
- 3- Produces Entry/Exit Signals for Swings based on Signal Average vs. MACD Crossing;
- Histogram Trend Bars To Confirm: If selected option "2" on the input parameter above, this will tell how many MACD bars required to confirm a trend swing;
- Applied Price: Price applied for the calculations, eg: High, Low, Open, Close, etc.
- Show Moving Averages On Main Chart: True if you want the Fast and Slow Moving Averages to be plotted on the main (prices) chart;
- Write Logs On Terminal Window: set it as true if you want the indicator to write logs on the Terminal's Experts tab for signal swings;
- Send Mobile Push Notifications: set it as true if you desire to receive Push Notification on the MetaTrader app on your mobile for signal swings;
- Send E-Mail Alerts: set it as true if you desire to receive e-mail alerts at the e-mail address configured on the terminal for signal swings;
Good Trades!


Nice and clean. Everything is working as it is supposed to.