Cvd Divergence

CVD Divergence ― オーダーフローとダイバージェンスのプロフェッショナル分析

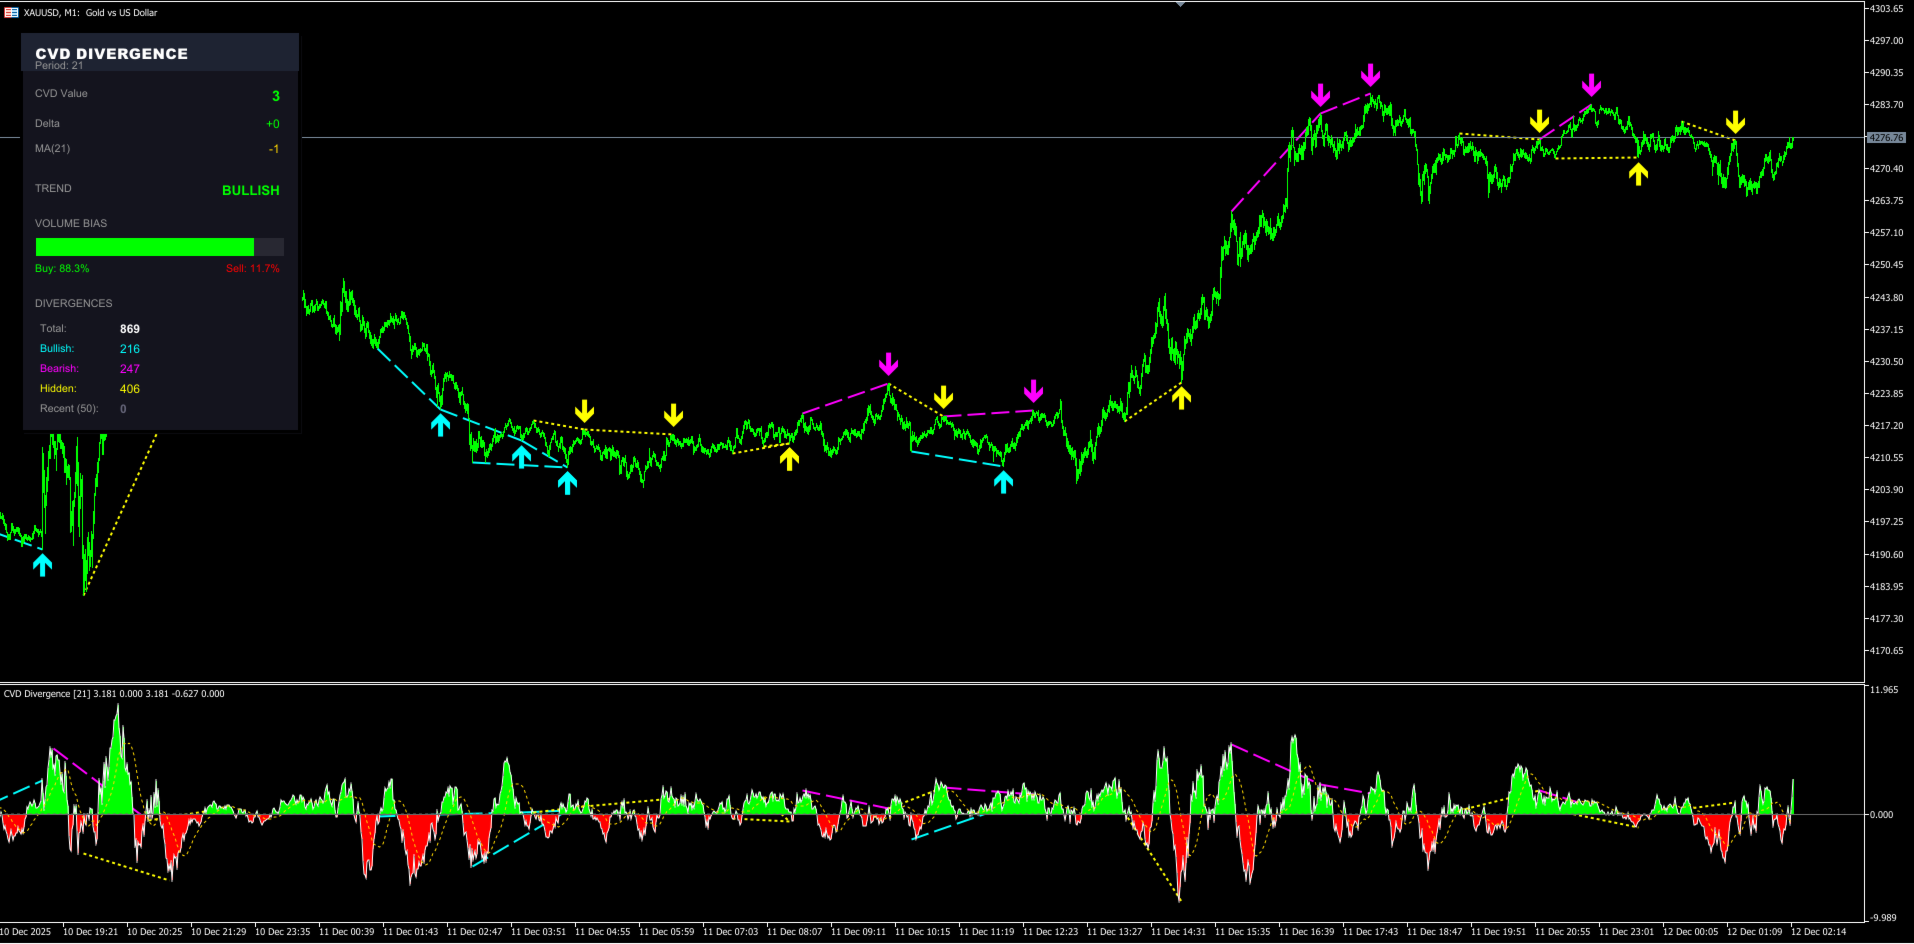
CVD Divergence は、価格と Cumulative Delta Volume(CVD)との間に発生する信頼性の高いダイバージェンスを検出するために開発されたテクニカル指標です。実際の注文フローが価格の動きを確認していない局面を正確に捉え、反転、勢いの減衰、そして機関投資家による操作の可能性を示します。

このインジケーターは、アグレッシブボリュームの読み取りと価格構造の分析を組み合わせ、明確で客観的かつ先行性のあるシグナルを提供します。

インジケーターの機能

CVD Divergence は、累積デルタボリュームを用いて注文フローの方向と価格の方向を比較します。両者が大きく乖離した際、チャート上にマーカーを表示し、ダイバージェンスの方向を視覚的に示します。

検出できる内容:

  • 強気ダイバージェンス(価格が下落しているが CVD が上昇している場合)

  • 弱気ダイバージェンス(価格が上昇しているが CVD が下降している場合)

  • 買い手・売り手の勢いの枯渇

  • 機関投資家の不均衡によるフェイクムーブ

  • 価格が人工的に押し上げ/押し下げられている可能性のある局面

Cumulative Delta Volume が強力な理由

CVD は市場参加者の「本当の意図」を示します。
代表的なシナリオ:

  • 価格が上昇しているのに CVD が下降 → 見かけ上は上昇でも、機関投資家が積極的に売っている証拠

  • 価格が下落しているのに CVD が上昇 → 隠れた買い集め(アキュムレーション)と実需の増加

  • 価格と CVD の大きな乖離は、反転やフェイクブレイクアウトの前兆になることが多い

価格チャートは騙すことがありますが、累積デルタはほとんど嘘をつきません。
このインジケーターはその情報を、実用的で信頼性の高いトレードシグナルに変換します。

主な特徴

  • 価格と累積デルタの自動ダイバージェンス検出

  • 予測方向を示す矢印による視覚的ハイライト

  • アグレッシブボリュームに基づく正確な CVD 計算

  • シンプルで見やすく、解釈しやすいインターフェース

  • ポップアップ、プッシュ通知、サウンドなどのオプションアラート

  • 複数銘柄でも CPU 負荷が低い軽量設計

  • FX、株式指数、株式、暗号資産など幅広い市場で高い効果

このインジケーターが適しているユーザー

  • フローデータで反転を先読みしたいトレーダー

  • インスティテューショナル分析やデルタボリュームを使うプロ

  • スキャルパー、デイトレーダー、スイングトレーダー

  • エントリー/イグジットに強力な根拠を求めるユーザー

  • リペイントなし・主観なしの明確なシグナルを求める方

MQL5 バージョン

CVD Divergence は MetaTrader 5 専用に開発されており、以下を保証します:

  • 高いパフォーマンスと安定性

  • EA や他のインジケーターとの完全互換性

  • 高速かつ信頼性の高い動作

  • リペイントしない安定したシグナル


おすすめのプロダクト
The Optimized MACD Divergence indicator is a powerful tool designed to identify potential trading opportunities by detecting divergences between price action and the MACD indicator. It combines classic divergence analysis with candlestick pattern recognition and volume filtering to provide more accurate and reliable signals. How it Works The indicator operates on the following principles: MACD Calculation:   It calculates the MACD indicator using user-defined parameters for fast EMA, slow EMA,
FXC iMACD-DivergencE MT5 Indicator This is an advanced MACD indicator that finds trend-turn divergences on the current symbol. The indicator detects divergence between the MACD and the price movements as a strong trend-turn pattern. Main features: Advanced divergence settings Price based on Close, Open or High/Low prices Give Buy/Sell open signals PUSH notifications E-mail sending Pop-up alert Customizeable Information panel Input parameters: MACD Fast-EMA: The Fast-EMA variable of the MACD indi
FXC iDeM-DivergencE MT5 Indicator This is an advanced DeMarker indicator that finds trend-turn divergences on the current symbol. The indicator detects divergence between the DeMarker and the price movements as a strong trend-turn pattern. Main features: Advanced divergence settings Price based on Close, Open or High/Low prices Give Buy/Sell open signals PUSH notifications E-mail sending Pop-up alert Customizeable Information panel Input parameters: DeM Period: The Period size of the DeMarker in
The Trend Duration Forecast MT5 indicator is designed to estimate the probable lifespan of a bullish or bearish trend. Using a Hull Moving Average (HMA) to detect directional shifts, it tracks the duration of each historical trend and calculates an average to forecast how long the current trend is statistically likely to continue. This allows traders to visualize both real-time trend strength and potential exhaustion zones with exceptional clarity. KEY FEATURES Dynamic Trend Detection:   Utiliz
Heiken Ashi Smoothed Strategy is a very simple but powerful system to get forex market trend direction. This indicator is actually 2 indicators in 1 pack, Heiken Ashi and Heiken Ashi Smoothed Moving Average both included. Because HA (Heiken Ashi) and HAS (Heiken Ashi Smoothed) are calculated in the same one system event with necessary buffers and loop only, so it is the FAST, OPTIMIZED and EFFICIENT HA having the combined indicator of MetaTrader 5. You can choose to display HA and HAS in the sam
MT4版  |  FAQ Owl Smart Levels Indicator は、 Bill Williams の高度なフラクタル、市場の正しい波構造を構築する Valable ZigZag、エントリの正確なレベルをマークする Fibonacci レベルなどの一般的な市場分析ツールを含む 1 つのインジケーター内の完全な取引システムです。 利益を得るために市場と場所に。 戦略の詳細な説明 インジケータを操作するための指示 顧問-取引助手 プライベートユーザーチャット ->購入後に私に書いて、私はプライベートチャットにあなたを追加し、あなたはそこにすべてのボーナスをダウンロードすることができます 力はシンプルさにあります! Owl Smart Levels 取引システムは非常に使いやすいので、専門家にも、市場を勉強し始めて自分で取引戦略を選択し始めたばかりの人にも適しています。 戦略と指標に秘密の数式や計算方法が隠されているわけではなく、すべての戦略指標は公開されています。 Owl Smart Levels を使用すると、取引を開始するためのシグナルをすばやく確認し、注文を出すための
Type: Oscillator This is Gekko's Cutomized Moving Average Convergence/Divergence (MACD), a customized version of the famous MACD indicator. Use the regular MACD and take advantage of several entry signals calculations and different ways of being alerted whenever there is potential entry point. Inputs Fast MA Period: Period for the MACD's Fast Moving Average (default 12); Slow MA Period: Period for the MACD's Slow Moving Average (default 26); Signal Average Offset Period: Period for the Signal A
Noize Absorption Index - is the manual trading system that measures the difference of pressure between bears forces and bulls forces. Green line - is a noize free index that showing curent situation. Zero value of index shows totally choppy/flat market.Values above zero level shows how powerfull bullish wave is and values below zero measures bearish forces.Up arrow appears on bearish market when it's ready to reverse, dn arrow appears on weak bullish market, as a result of reverse expectation.
Advanced ideas of the popular MACD indicator: It detects and displays classic and reverse divergences (two methods of detecting divergences). It uses different color to highlight an uptrend and a downtrend. Two methods of determining a trend: а) MACD crosses the 0 level (classic signal); б) MACD crosses its own average (early signal). This is a multi-timeframe indicator: it can display MACD data from other timeframes. Two methods of drawing: classic histogram and line. It generates sound and vis
The Fractals indicator displays on the chart only fractals with the specified parameters in the indicator settings. This allows you to more accurately record a trend reversal, excluding false reversals. According to the classical definition of a fractal, it is a candlestick - an extremum on the chart, which was not crossed by the price of 2 candles before and 2 candles after the appearance of a fractal candle. This indicator provides the ability to adjust the number of candles before and after t
Stochastic Divergen MT5
Komang Putra Riswanjaya
2 (1)
Overview The Stochastic Divergence Indicator is a tool designed to help identify potential market turning points by analyzing divergences between price and the Stochastic Oscillator. It highlights divergence signals visually on the chart, assisting traders in observing possible trend changes. Key Features No Repaint: Once a signal is formed, it remains on the chart. Adjustable Parameters: Settings can be modified to fit different trading preferences and timeframes. Visual Display: Arrows are plo
Nova AC Trader is a modern automation of the Accelerator Oscillator (AC) — a Bill Williams momentum tool designed to detect shifts in market acceleration before trends fully form. This EA transforms the indicator’s early-warning nature into a structured trading system that reacts only when momentum changes are clear and consistent. Instead of waiting for the trend to be obvious, Nova AC Trader identifies when market acceleration starts to turn — offering opportunities at the earliest stage of mo
The RSI Divergence + FVG Signal indicator combines Relative Strength Index (RSI) Divergence with Fair Value Gap (FVG) detection to generate high-probability buy and sell signals based on both momentum shifts and institutional imbalance zones. Core Features: RSI Divergence Detection : Identifies both regular and hidden bullish/bearish divergences between price and RSI. Divergences indicate potential trend reversals or continuation. FVG Zone Recognition : Detects Fair Value Gaps (imbalances caused
##   ONLY GOLD ##   Тiльки Золото ## **Mercaria Professional Trading Zones - Complete Guide** ## **Mercaria Professional Trading Zones - Повний посібник** ### **How Mercaria Zones Work / Як працюють зони Mercaria** **English:** Mercaria Zones is an advanced trading indicator that identifies high-probability support and resistance areas using ZigZag extremes combined with mathematical zone calculations. The indicator works on multiple timeframes simultaneously, providing a comprehensive view
Terra Infinity is a flat indicator. This improved version of the CalcFlat indicator has three additional lines that significantly increase its effectiveness. Unlike its predecessor with two static levels, Terra Infinity adds three dynamic lines above the main histogram, which are interpreted as follows: base signal line, minimum signal line, maximum signal line. These lines are formed using the additional parameter Avg, which is the average value of the histogram. Averaging produces a line cl
MACD Intraday Trend PROは、1960年代にGeraldAppelによって作成された元のMACDを応用して開発されたインジケーターです。 長年の取引を通じて、MACDのパラメーターをフィボナッチの比率で変更することにより、トレンドの動きの連続性をより適切に表現できることが観察され、価格トレンドの開始と終了をより効率的に検出できるようになりました。 価格トレンドの検出が効率的であるため、トップとボトムの相違を非常に明確に識別し、取引機会をより有効に活用することもできます。 特徴 インディケータMACD日中トレンドPROは、任意の通貨ペア、任意の時間枠、および練行足チャートで機能します。 5つのモードを選択することにより、トレンド検出速度を設定することができます。 最速 速い 正常 スロー 最も遅い 資力 6つの構成可能なアラートがあります。 MACDがシグナルラインを引き戻す MACDが信号線を横切る MACDがレベル0を超える 信号線がレベル0を超えています MACDはトレンドカラーを変更します 信号線変更トレンドカラー アラートごとに、以下を構成できま
Vortex MT5
KEENBASE SOFTWARE SOLUTIONS
The Vortex Indicator was first presented by Douglas Siepman and Etienne Botes in January 2010 edition of Technical Analysis of Stocks & Commodities. Despite its based on a complex implosion phenomenon, the vortex is quite simple to interpret. A bullish signal is generated when +VI line cross above the -VI line and vice versa. The indicator is mostly used as a confirmation for trend trading strategies. The Vortex was inspired by the work of Viktor Schauberger, who studied the flow of water in tur
発見が困難で頻度が少ないため、分岐は最も信頼できる取引シナリオの1つです。このインジケーターは、お気に入りのオシレーターを使用して、通常の隠れた分岐点を自動的に見つけてスキャンします。 [ インストールガイド | 更新ガイド | トラブルシューティング | よくある質問 | すべての製品 ] 取引が簡単 通常の隠れた発散を見つけます 多くのよく知られている発振器をサポート ブレイクアウトに基づいて取引シグナルを実装します 適切なストップロスおよび利益レベルを表示します 設定可能なオシレーターパラメーター カスタマイズ可能な色とサイズ バー単位でサイズ別に分岐をフィルタリング パフォーマンス統計を実装します 電子メール/音声/視覚アラートを実装します 幅広い市場の見通しを提供するために、異なるオシレーターを使用して、干渉なしで同じチャートにインジケーターを何度もロードできます。このインジケーターは、次のオシレーターをサポートしています。 RSI CCI MACD オスマ 確率的 勢い 素晴らしい発振器 加速器発振器 ウィリアムズパーセントレンジ 相対活力指数 特に外国為替市場では、
The   Fibonacci Confluence Toolkit   is a technical analysis tool designed to help traders identify potential price reversal zones by combining key market signals and patterns. It highlights areas of interest where significant price action or reactions are anticipated, automatically applies Fibonacci retracement levels to outline potential pullback zones, and detects engulfing candle patterns. Its unique strength lies in its reliance solely on price patterns, eliminating the need for user-define
Weis Wave Scouterは、MetaTrader 5向けに開発された革新的なインジケーターであり、WyckoffメソッドとVSA(Volume Spread Analysis)の確立された原則を組み合わせています。精度と深みを求めるトレーダー向けに設計され、累積ボリューム波の分析を通じて市場を戦略的に読み取り、トレンドの反転ポイントや継続ポイントを特定する支援を行います。 Weis Wave Scouterは、クラシック、ナイトビジョン、オーシャンブリーズといったカスタマイズ可能なカラーテーマで、上昇波と下降波を色分けしたヒストグラムで明瞭に表示します。主な機能には、ボリュームピークの検出、低アクティビティゾーン(DeadZone)の識別、およびボリュームベースの波の反転に関するカスタマイズ可能なアラートが含まれます。また、エフォート対リザルト分析、因果関係、需給バランスといったWyckoffおよびVSA理論の基本概念をサポートしています。Brick Size、Volume Scale Factor、Pivot Lookbackといったパラメータで柔軟に調整でき、あらゆるスタ
Smart Stochastic Divergence Detector Description: The Smart Stochastic Divergence Detector is a professional tool that automatically identifies Bullish & Bearish Divergences on your chart using the Stochastic Oscillator . It helps traders detect early reversals , hidden momentum changes , and trend continuation signals without the need for manual analysis. Whether you trade Forex, Indices, Stocks, or Crypto , this tool provides clear divergence signals with arrows and trendlines – allowin
Schaff Trend Cycle STC
Mohammad Taher Halimi Tabrizi
The Schaff Trend Cycle indicator is the product of combining Slow Stochastics and the moving average convergence/divergence (MACD). The MACD has a reputation as a trend indicator, but it's also notorious for lagging due to its slow responsive signal line. The improved signal line gives the STC its relevance as an early warning sign to detect currency trends. this indicator is converted from Trading View code of STC Indicator - A Better MACD [SHK]
Технический индикатор Universal Oscillator является комбинацией торговых сигналов самых популярных и широко используемых осцилляторов. Индикатор представлен гистограммами, а также линиями fast и slow MA, что позволяет расширить список получаемых торговых рекомендаций и работать как по тренду, так и в боковом движении рынка. Таким образом, гистограммы позволяют определить момент пробоя ценовых значений и движение в новой фазе рынка, а линии указывают на зоны перекупленности и перепроданности.  Ос
Description : Rainbow EA MT5 is a simple Expert advisor based on   Rainbow MT5 indicator witch is based on Moving average with period 34. The indicator is incorporated in the EA, therefore, it is not required for the EA to operate, but if you wish, you can download it from   my product page . The Expert Advisor settings are as follows : Suitable for Timeframes up to H1 The parameters below can be set according to your trading rules. StopLoss ( Stop Loss in pips) TakeProfit ( Take Profit in pips
TRI Visualizer Enhanced - 熱力学的市場分析の革命 概要 TRI(Thermal Range Indicator)Visualizer Enhanced は、従来のテクニカル分析を超越した、物理学の熱力学理論を応用した革新的なマーケット分析インジケーターです。市場の価格変動を「熱力学的エネルギー」として捉え、これまで見落とされていた市場の微細な変化を高精度で検出します。 革新的な仕組み 1. デュアル計算エンジン クラシックTRIモード 基本公式: |終値-始値| + (高値-安値) ローソク足の実体とヒゲを統合した純粋なボラティリティ測定 シンプルで直感的、あらゆる市場環境で安定動作 熱力学的TRIモード(独自開発) 価格加速度 :2次微分による価格変化の勢いを測定 出来高変化率 :相対的な出来高の変化を動的に評価 ポジションエネルギー :正規化された価格変動エネルギーを計算 熱力学的係数 :物理学の熱力学法則を市場分析に応用 2. 高度な平滑化システム SMA(単純移動平均) :基本的なノイズ除去 EMA(指数移動平均) :最新データ重視の平滑化
MACD Pro Master
Itumeleng Mohlouwa Kgotso Tladi
MACD Pro Master The MACD Pro Master is your ultimate trading companion, designed to revolutionize your financial journey and unlock the doors to wealth. Here's why it's the next best thing since sliced bread: Advantages Precision Trading : The MACD Pro Master leverages the powerful Moving Average Convergence Divergence (MACD) indicator to provide accurate buy and sell trades,  ensuring you capitalize on every market opportunity. Customizable Settings : Tailor the trading strategy to your unique
Stochastic  Reversal  allows you to recognize reversals professionally. Stochastic Indicator: This technical indicator was developed by George Lane more than 50 years ago. The reason why this indicator survived for so many years is because it continues to show consistent signals even in these current times. The Stochastic indicator is a momentum indicator that shows you how strong or weak the current trend is. It helps you identify overbought and oversold market conditions within a trend.  Rules
SMC Order Blocks + FVG — Professional Smart Money Concept Indicator Unlock institutional trading insights with this professional-grade Smart Money Concept indicator. Automatically detect Order Blocks and Fair Value Gaps used by banks and hedge funds. KEY FEATURES: ORDER BLOCKS DETECTION • Automatic bullish and bearish Order Block identification • Based on price action and impulse strength analysis • Real-time mitigation tracking • Customizable imp
HLC bar MT5 Wyckoff
Eduardo Da Costa Custodio Santos
MT5のインジケーター「HLC_bar_MT5Wyckoff」は、取引時の分析を容易にするために作成されました。 HLCバーはRichardWyckoffによって使用され、現在「VSA」操作で広く使用されています。 Wyckoffは、High、Low、およびCloseを使用すると、グラフがはるかにクリーンになり、分析が容易になることを発見しました。 区分 "HLC_bar_MT5 Wyckoff"により、以下が可能になります。 #バーの幅を変更します。 #バーを同じ色のままにします。 #そして、同じ価格で開閉したバーを強調表示します。 色と幅は設定で簡単に変更できます インジケーターを使用するには、インジケーターをチャートにドラッグするだけです。
Elliott Wave Oscillator Pro for MetaTrader 5 Elliott Wave Oscillator Pro is a precision momentum analysis tool designed to help traders visualize wave structure, trend strength, and market rhythm in real time. By calculating the difference between fast and slow moving averages, the oscillator reveals the internal energy of price movement, allowing traders to better anticipate shifts in momentum and potential wave transitions. This indicator transforms complex Elliott-based momentum behavior into
このプロダクトを購入した人は以下も購入しています
Market Flow Pro Market Flow Pro is an intelligent trading advisor for the MetaTrader 5 platform, designed for automatic trading on financial markets using algorithmic analysis and strict risk management. -Key features: - Fully automatic trading 24/5 - Adaptive trend and momentum entry algorithm -  Built-in risk management - Flexible lot settings (fixed/auto-calculation) - Support for major currency pairs and indices - Optimised for operation on various timeframes  How it works Market
ARICoin is a powerful trading companion designed to generate high-probability entry signals with dynamic TP/SL/DP levels based on volatility. Built-in performance tracking shows win/loss stats, PP1/PP2 hits, and success rates all updated live. Key Features: Buy/Sell signals with adaptive volatility bands Real-time TP/SL/DP levels based on ATR Built-in MA Filter with optional ATR/StdDev volatility Performance stats panel (Success, Profit/Loss, PP1/PP2) Alerts via popup, sound, push, or email Cust
AriX
Temirlan Kdyrkhan
1 (4)
AriX Indicator for MT5 A powerful trend-following and signal-evaluation tool AriX is a custom MT5 indicator that combines Moving Averages and ATR-based risk/reward logic to generate clear buy/sell signals. It visualizes dynamic SL/TP levels, evaluates past trade outcomes, and displays win/loss statistics in a clean on-chart panel. Key features include: Buy/Sell signals based on MA crossovers ATR-based SL/TP1/TP2/TP3 levels with visual lines and labels Signal outcome tracking with real-time stat
ARIPoint is a powerful trading companion designed to generate high-probability entry signals with dynamic TP/SL/DP levels based on volatility. Built-in performance tracking shows win/loss stats, PP1/PP2 hits, and success rates all updated live. Key Features: Buy/Sell signals with adaptive volatility bands Real-time TP/SL/DP levels based on ATR Built-in MA Filter with optional ATR/StdDev volatility Performance stats panel (Success, Profit/Loss, PP1/PP2) Alerts via popup, sound, push, or email Cu
Azimuth Pro
Ottaviano De Cicco
5 (4)
発売プロモーション Azimuth Proは先着100名様限定で 299ドル でご提供します。最終価格は 499ドル となります。 リテールとインスティテューショナルのエントリーの違いはインジケーターではなく、ロケーションにあります。 多くのトレーダーは、モメンタムを追いかけたり、遅行シグナルに反応して、任意の価格レベルでエントリーします。機関投資家は、需給が実際にシフトする構造的なレベルに価格が到達するのを待ちます。 Azimuth Proはこれらのレベルを自動的にマッピングします:スイングアンカーVWAP、マルチタイムフレーム構造ライン、高確率ロケーションにのみ出現するABCパターン。 Azimuth Proは、構造分析とインテリジェントな自動化の両方を求めるプロフェッショナルトレーダー向けに構築されています。 Azimuthが外科的精度で市場構造をマッピングする一方、Azimuth Proはインテリジェンスレイヤーを追加します:トレーディングスタイルの自動検出、スマート設定された移動平均線、20年のデータでバックテストされた最適化パラメータ。その結果、お使いの銘柄と
RelicusRoad Pro: 定量的市場オペレーティングシステム 【期間限定】無制限アクセス 70% OFF - 2,000人超のトレーダーと共に なぜ多くのトレーダーは「完璧な」インジケーターを使っても失敗するのでしょうか? それは、文脈を無視して 単一の概念 だけでトレードしているからです。文脈のないシグナルは単なるギャンブルです。勝ち続けるには、 根拠の重なり(コンフルエンス) が必要です。 RelicusRoad Proは単なる矢印インジケーターではありません。完全な 定量的市場エコシステム です。独自のボラティリティモデリングを用いて、価格が推移する「適正価値の道(Fair Value Road)」をマッピングし、ノイズと真の構造的ブレイクを判別します。 推測はやめましょう。機関投資家レベルの「ロード・ロジック」でトレードを。 コアエンジン:「Road」アルゴリズム システムの中心となる Road Algo は、市場環境にリアルタイムで適応するダイナミックなボラティリティチャネルです。 安全ライン(平衡点) と、価格が数学的に反転しやすい 拡張レベル を投影します。 Si
Ultimate SMC Indicator
Hicham Mahmoud Almoustafa
1 (1)
Ultimate SMC PRO – Smart Money Concepts Indicator (Order Blocks, FVG, Liquidity, BOS) for MetaTrader 5 Ultimate SMC PRO is a professional trading indicator designed to visualize Smart Money Concepts directly on the chart. The indicator combines several institutional trading tools in one system to help traders identify potential high-probability trading zones. The indicator analyzes market structure, liquidity behavior and price imbalance to highlight areas where institutional activity may occu
「 Dynamic Scalper System MT5 」インジケーターは、トレンド波の中でスキャルピング取引を行う手法のために設計されています。 主要通貨ペアと金でテスト済みで、他の取引商品との互換性があります。 トレンドに沿った短期的なポジションオープンのシグナルを提供し、追加の価格変動サポートも提供します。 インジケーターの原理 大きな矢印はトレンドの方向を決定します。 トレンド波の中では、小さな矢印の形でスキャルピングシグナルを生成するアルゴリズムが機能します。 赤い矢印は強気方向、青い矢印は弱気方向です。 トレンドの方向には敏感な価格変動ラインが描かれ、小さな矢印のシグナルと連動します。 シグナルは次のように機能します。適切なタイミングでラインが現れるとエントリーシグナルが形成され、ラインが開いている間はポジションが保持され、完了すると取引が終了します。 推奨される動作時間枠はM1~H4です。 矢印は現在のローソク足に形成され、次のローソク足が開いている場合は、前のローソク足の矢印は再描画されません。 入力パラメータ Trend Wave Period - トレ
CGE Trading Suite
Carl Gustav Johan Ekstrom
5 (1)
CGE Trading Suite delivers the analytical edge typically reserved for professional trading desks. The platform integrates a full suite of analytical tools into one seamless workflow: dynamic grid mapping, liquidity behavior analysis, ECM, trend lines, MIDAS, trade cycles, and directional channel projections. Together, these provide a unified view of market structure and momentum. Directional clarity is further enhanced by the capital flow index, which measures currency basket strength to identif
まず第一に、この取引ツールはノンリペイント、ノンリドロー、ノンラグの指標であり、プロの取引に理想的ですことを強調する価値があります。 オンラインコース、ユーザーマニュアル、デモ。 スマートプライスアクションコンセプトインジケーターは、新米から経験豊富なトレーダーまで、非常 に強力なツールです。Inner Circle Trader AnalysisやSmart Money Concepts Trading Strategiesなど、20以上の有用な指標を1つに組み合わせています。このインジケーターはスマートマネーコンセプトに焦点を当て、大手機関の取引方法を提供し、彼らの動きを予測するのに役立ちます。 特に、流動性分析に優れており、機関がどのように取引しているかを理解しやすくしています。市場のトレンドを予測し、価格の動きを慎重に分析するのに優れています。機関の戦略とトレードを合わせることで、市場の動向についてより正確な予測ができます。このインジケーターは多目的であり、市場構造を分析し、重要な注文ブロックを特定し、さまざまなパターンを認識するのに優れています。 このインジケーター
Cyclic Impulse MT5 — このテクニカル指標はチャートを構築し、周期的な価格変動を識別します。これにより、反転する周期的な価格変動とエントリーシグナルを見つけることができます。 指標の仕組み 周期的な下降傾向が検出されると、ローソク足が閉じた後に青い下降バーが生成されます。このバーは現在のローソク足上でちらつく場合があり、シグナルはまだ確認されていません。青い矢印は価格チャートに複製されます。 周期的な上昇傾向が検出されると、ローソク足が閉じた後に赤い上向きバーが生成されます。このバーは現在のローソク足上でちらつく場合があり、シグナルはまだ確認されていません。オレンジ色の矢印は価格チャートに複製されます。 あらゆるチャート、時間枠、取引商品で使用できます。 複数のアラートタイプ。 価格チャートに追加の矢印を表示。 履歴データの再描画は行わず、ローソク足の終値に基づいて機能します。ローソク足が閉じても、矢印またはバーは消えません。 使いやすく、パラメータの設定も簡単で、不要な情報でチャートが乱雑になることはありません。 異なるパラメータを持つ2つのインジケーターを使用
このインジケーターは、市場で 関心が示されたゾーン をハイライトし、その後に 注文の蓄積ゾーン を表示します。 これは、大規模な**板情報(オーダーブック)**のように機能します。 これは、 巨大な資金 のためのインジケーターです。その性能は卓越しています。 市場にどんな関心が存在していても、 必ず目に見えるようになります 。 (これは 完全に再設計され、自動化されたバージョン です。もはや手動分析は必要ありません。) トランザクションスピード(取引速度) は新しい概念のインジケーターで、市場で大口注文が どこに・いつ 集中しているかを示し、それに基づいたチャンスを提供します。 トレンドの変化を 非常に早い段階 で察知することができます。 FXでは「出来高」と呼ばれているものは誤解されています。実際には、これは 時間あたりの価格変動量 です。したがって、正しい名称は トランザクションスピード です。 考え方・行動・分析の仕方すべてが問われます。 分析パラダイムの転換は非常に重要です。 このインジケーターは、FXにおける出来高の考え方を 根本から再定義 し、論理的な形で正確に活用する、
1. Tool Description The   Dynamic Liquidity HeatMap Profile   is an advanced technical indicator originally designed by BigBeluga (Pine Script) and ported to MQL5. Unlike a standard Volume Profile which shows where volume   has   occurred, this tool attempts to visualize where liquidity (limit orders and stop losses) is   likely waiting   (resting liquidity). It works by identifying pivots (local highs and lows) weighted by volume and ATR.   Crucially, if price moves through a level, that liquid
Pointer Trend Switch — precision trend reversal indicator Pointer Trend Switch is a high-precision arrow indicator designed to detect key moments of trend reversal based on asymmetric price behavior within a selected range of bars. It identifies localized price impulses by analyzing how far price deviates from the opening level, helping traders find accurate entry points before a trend visibly shifts. This indicator is ideal for scalping, intraday strategies, and swing trading, and performs equa
Overview TriParity AfterShock PRO Scanner は、MetaTrader 5 用の裁量判断支援ダッシュボード型インジケーターです。本説明において、トライアッドとは 3 つの通貨ペアまたは銘柄の関係を意味します。Scanner は複数のトライアッドと時間足を 1 つのパネルで確認し、トレーダーが監視対象をより構造的に整理できるよう支援します。目的は、チャートの過密状態を減らし、候補を横並びで比較し、より詳しく確認すべき条件を目立たせることです。 本製品は三角裁定を実行するものではありません。真の三角裁定には、3 レッグのほぼ同時執行、非常に低いレイテンシー、そして非常に小さい取引コストが必要です。Scanner は、パリティ調整後にも一時的に残り得る歪み状態を裁量的にレビューするために設計されています。 Functions Scanner は、選択されたトライアッドを複数の時間足で分析し、NOWCAST によって現在の状態を表示します。NOWCAST はセットアップを A、B、C、または NG として評価します。この文脈で NG は、現在の状態が適して
ARIScalp is a powerful trading companion designed to generate high-probability entry signals with dynamic TP/SL/DP levels based on volatility. Built-in performance tracking shows win/loss stats, PP1/PP2 hits, and success rates all updated live. Key Features: Buy/Sell signals with adaptive volatility bands Real-time TP/SL/DP levels based on ATR Built-in MA Filter with optional ATR/StdDev volatility Performance stats panel (Success, Profit/Loss, PP1/PP2) Alerts via popup, sound, push, or email Cus
TPA True Price Action indicator reveals the true price action of the market makers through 100% non-repainting signals strictly at the close of a candle! TPA shows entries and re-entries, every time the bulls are definitely stronger than the bears and vice versa. Not to confuse with red/green candles. The shift of power gets confirmed at the earliest stage and is ONE exit strategy of several. There are available now two free parts of the TPA User Guide for our customers. The first "The Basics"
Trend deviation scalper - is the manual system to scalp choppy market places. Indicator defines bull/bear trend and it's force. Inside exact trend system also defines "weak" places, when trend is ready to reverse. So as a rule, system plots a sell arrow when bull trend becomes weak and possibly reverses to bear trend. For buy arrow is opposite : arrow is plotted on bear weak trend. Such arrangement allows you to get a favorable price and stand up market noise. Loss arrows are closing by common p
Matreshka
Dimitr Trifonov
5 (2)
Matreshka self-testing and self-optimizing indicator: 1. Is an interpretation of the Elliott Wave Analysis Theory. 2. Based on the principle of the indicator type ZigZag, and the waves are based on the principle of interpretation of the theory of DeMark. 3. Filters waves in length and height. 4. Draws up to six levels of ZigZag at the same time, tracking waves of different orders. 5. Marks Pulsed and Recoil Waves. 6. Draws arrows to open positions 7. Draws three channels. 8. Notes support and re
Native Channels
BeeXXI Corporation
5 (1)
This indicator recognizes all support and resistance levels. A number of unique high-performance techniques have been applied, which made the existence of this indicator possible. All formed channels are naturally visible: horizontal linear linear parabolic cubic (Polynomial 3 degrees - Wave) This is due to a bundle of approximating channels. The formed channels form "standing waves" in a hierarchical sequence. Thus, all support and resistance levels are visible. All parameter management is i
The Institutional Secret Method  represents a paradigm shift in market analysis, moving away from lagging indicators and into the realm of Topological Finance . It is engineered to decode the hidden geometry of price movement by calculating the most efficient path—the Geodesic —between current price action and institutional liquidity targets. The system views the market as a physical landscape where price is naturally drawn toward massive pools of liquidity (Stops). It uses two primary calculati
UZFX {SSS} スキャルピング・スマートシグナル MT5 は、変動の激しい市場で正確かつリアルタイムのシグナルを求めるスキャルパー、デイトレーダー、スイングトレーダー向けに設計された、再描画しない高性能取引指標です。(UZFX-LABS) によって開発されたこの指標は、価格行動分析、トレンド確認、スマートフィルタリングを組み合わせて、全ての通貨ペアと時間枠で高確率の売買シグナルを生成します。 主な機能 スマートシグナル検出 – 強力なトレンド反転と継続パターンを正確に識別。 マルチタイムフレーム・スキャルピング – 全タイムフレームで完璧に動作。 カスタマイズ可能なアラート – 全シグナルに対しポップアップ、メール、モバイル通知を取得(設定可能)。 明確な視覚的矢印 – チャート上で見やすい青(買い)と赤(売り)の矢印を表示。 適応型シグナル強度 – 短期・中期・長期取引向けにシグナル強度を調整可能。 ユーザーフレンドリーなインターフェース – リペインティングやシグナル遅延のないクリーンなチャート表示。 動作原理 UZFX SSSインジケーターは価格行動をスキャンし以下を検
note: this indicator is for METATRADER4, if you want the version for METATRADER5 this is the link:  https://www.mql5.com/it/market/product/108106 TRENDMAESTRO ver 2.5 TRENDMAESTRO recognizes a new TREND from the start, he never makes mistakes. The certainty of identifying a new TREND is priceless. DESCRIPTION TRENDMAESTRO identifies a new TREND in the bud, this indicator examines the volatility, volumes and momentum to identify the moment in which there is an explosion of one or more of these da
UZFX SWS {スキャルピング・ウィニング・シグナルズ} Pro v1.0 は、Usman Zabir(UZFX LABS)が開発した強力なノンリペインティング指標です。急変する市場で正確なエントリーシグナルを求めるスキャルパー、デイトレーダー、スイングトレーダー向けに特別に設計されています。遅延や誤った再描画のない、信頼性の高いリアルタイムシグナルを求めるトレーダーに最適です。 私のおすすめ* 最適時間枠:30分以上。 {1時間} が私のお気に入りです。そして結果は驚くべきもの...! 主な機能: 直近および過去のシグナルを明確な視覚的矢印で表示(古いシグナルを点で表示するオプション付き)。 取引ラインの自動計算・描画:エントリー、ストップロス(直近のスイングロー/ハイに基づく)、複数テイクプロフィットレベル(RRR 1:1、2:1、3.5:1 – 完全カスタマイズ可能)。 最新シグナル詳細、エントリー価格、SL、TPレベルを表示するチャート上情報パネル。 包括的アラート:ポップアップ、サウンド、プッシュ通知、メール。 チャートカスタマイズオプション(色、背景、ローソク足ス
Weis Wave with Alert MT5
Trade The Volume Waves Single Member P.C.
4.94 (17)
Rental/Lifetime Package Options and Privileges  Rent Monthly Six Months   Yearly/Lifetime Weis Wave with Speed with Alert+Speed Index x x x Manual  x x x Quick Set up Video x x x Blog x x x Lifetime Updates x x x Setup and Training Material x x Discord Access Channel "The SI traders"          x Rectangle Break Alert Tool      x How to trade with it:    http://www.tradethevolumewaves.com   ** If you purchase please contact me to setup your  : Training Room and  complete manual access.  Wei
MetaForecast M5
Vahidreza Heidar Gholami
5 (3)
MetaForecastは、価格データのハーモニクスに基づいて、どんな市場の未来を予測し視覚化します。市場が常に予測可能ではありませんが、価格にパターンがある場合、MetaForecastは可能な限り正確な未来を予測できます。他の類似製品と比較して、MetaForecastは市場のトレンドを分析することでより正確な結果を生成することができます。 入力パラメータ Past size (過去のサイズ) MetaForecastが将来の予測を生成するために使用するバーの数を指定します。モデルは選択したバー上に描かれた黄色の線で表されます。 Future size (将来のサイズ) 予測すべき将来のバーの数を指定します。予測された将来は、ピンクの線で表示され、その上に青い回帰線が描かれます。 Degree (程度) この入力は、MetaForecastが市場で行う分析のレベルを決定します。 Degree 説明  0 Degree 0の場合、価格の全てのピークや谷、そして詳細をカバーするために、「Past size」の入力に大きな値を使用することが推奨されています。  1 (推奨) Degre
Introduction to X3 Chart Pattern Scanner X3 Cherart Pattern Scanner is the non-repainting and non-lagging indicator detecting X3 chart patterns including Harmonic pattern, Elliott Wave pattern, X3 patterns, and Japanese Candlestick patterns. Historical patterns match with signal patterns. Hence, you can readily develop the solid trading strategy in your chart. More importantly, this superb pattern scanner can detect the optimal pattern of its kind. In addition, you can switch on and off individu
Rtc ML Ai | Predictor CORE MACHINE LEARNING ENGINE Adaptive ML Market Predictor – Multi-Bar Trend & Candle Forecast What This Indicator Does This indicator is a  real-time market prediction engine  designed to analyze price behavior and estimate  future market tendencies . Unlike conventional indicators, this system  does not rely on static parameters or historical curve-fitting , but adapts its internal state dynamically during live market operation. Instead of using static rules, the indic
Jita Indicator Pro MT5 | All Timeframes Professional Trend Agreement System – Premium Edition ($500) What Is Jita Indicator Pro? Jita Indicator Pro is a structured trend-confirmation system designed for serious traders who value precision, alignment, and controlled signal behavior. It combines: Advanced band-based trend direction logic ATR-driven structural trigger engine Dual-confirmation agreement system Locked history update design This indicator prints signals only when multiple conditions
無料のAUXインジケーター、EAサポート、完全ガイドをご利用ください – https://www.mql5.com/en/blogs/post/763955 トレンドを見極める。パターンを読む。エントリーのタイミングを掴む。 30秒以内の3ステップ!分析不要で簡単トレード — あなたのスマートアシスタントがワークフローを簡素化します チャートの過剰な情報にもう悩まされない。 スマートバイアス検出で自信を持ってトレード。 すべての通貨、暗号資産、株式、金属、指数、あらゆる時間足に対応。 クリックして実行するだけ — それだけで十分。 スピードと明快さを求める忙しいトレーダーに最適。 TPTSyncXは、 トレンド、パターン、 ローソク足のトリガー 分析を、洗練されたインテリジェントなビジュアルシステムとしてシームレスに統合する、強力なオールインワンMetaTrader 5インジケーターです。明確さ、正確さ、スピードを求めるトレーダー向けに設計されており、プライスアクション、構造的パターン、市場タイミングツールを組み合わせて、高確率のトレードセットアップを特定するのに役立ちます。 主な
作者のその他のプロダクト
Big Player Range
Thalles Nascimento De Carvalho
5 (3)
BigPlayerRange — MT5向け最強インジケーター BigPlayerRange は、MetaTrader 5 で日経ミニやドル先物などの取引において、 最も効果的なインジケーター と評価されています。大口投資家(機関投資家)の行動を可視化し、高精度なテクニカル分析を可能にします。 どのように機能するのか? BigPlayerRangeは、買い圧力ゾーン(緑ライン)と売り圧力ゾーン(赤ライン)を描画し、価格がその範囲を超えるとトレンド方向への動きを示唆します。 緑のライン上で終値: 買いの勢いが強く、上昇トレンドの可能性。 赤のライン下で終値: 売り圧力が優勢で、下落が予想される。 範囲内での価格: レンジ相場でブレイクを待つ段階。 主なメリット: 機関投資家ゾーンの検出: 大口のエントリーポイントを視覚化。 自動ターゲット計算: 利確ポイントを戦略的に設定。 プルバックの可能性分析: リスク管理に役立つ情報提供。 推奨の使い方: Imbalance DOM Pro と併用してゾーンブレイクを確認。 SwingVolum
Tape Hunter
Thalles Nascimento De Carvalho
Tape Hunter – MT5で努力と結果を見極めるレーダー Tape Hunterは、MetaTrader 5で価格の裏にある真実の動きを見たいトレーダーのための究極のインジケーターです。POC(ポイント・オブ・コントロール)に基づく買いと売りのアグレッシブな出来高を明確かつ直感的に表示し、各ローソク足の市場の努力と実際の結果を視覚化します。 ️ なぜ重要なのか? すべての出来高が価格を動かすわけではありません!Tape Hunterは、努力(アグレッシブな出来高)が価格を本当に動かしているかを示し、以下を見極めるのに役立ちます: 本当のアグレッションとトラップの位置 市場が吸収されているのか押し込まれているのか 支配的な出来高と価格の方向性の一致 Tape Hunterを使えば、プロのテープリーディング視点を得て、より精度の高いエントリーとエグジットの判断が可能になります。 関連インジケーター – フロー分析を強化 より効率的なトレードのために、Tape Hunterと以下の強力なインジケーターを組み合わせて使いましょう: Big Player
VWAP FanMaster
Thalles Nascimento De Carvalho
3.5 (2)
VWAP FanMaster: 正確なプルバック戦略をマスターしよう! VWAP FanMaster は、 正確なエントリーポイント と 効率的なプルバック を求めるトレーダーのための究極のインジケーターです。 VWAP(出来高加重平均価格) と フィボナッチファンライン を組み合わせ、市場での重要な価格ゾーンを明確にマッピングします。 主な機能 シンプルかつ強力 : 垂直線を動かすだけで、自動的に VWAP と フィボナッチファンライン を描画します。 賢いトレーディング戦略 : 描かれたゾーンに価格が戻るのを待ち、 完璧なプルバック をサポートとレジスタンスのレベルで捉えます。 高度なビジュアルツール : 価格のコンフルエンスエリア を即座に見つけて、迅速な意思決定をサポートします。 VWAP FanMasterを選ぶ理由 初心者にも使いやすい 。 2つの強力な分析ツール を組み合わせることで、取引精度を向上させます。 リスク管理を改善 し、明確で一貫した価格予測を提供します。 VWAP FanMasterでトレード戦略を最適化
FREE
Swing Point Volume
Thalles Nascimento De Carvalho
Swing Point Volume, the indicator that signals weakness and strength at the tops and bottoms. This indicador can be for used the Wyckoff Method. Information provided; - Swing on customized ticks. - Volume and points in each balance sheet. - Percentage of Displacement. - Sound alert option on top and bottom breaks. - Volume in ticks and Real Volume. - Volume HL (extreme) or (opening and closing) - Customized volume shapes.
Imbalance DOM Pro
Thalles Nascimento De Carvalho
5 (1)
Imbalance DOM Pro:注文帳の不均衡でトレードを強化 MT5で注文帳にアクセスできますか?トレードを新たなレベルに引き上げたいですか? 注文フローを基に意思決定を行っているトレーダーであれば、Imbalance DOM Proはあなたの分析を変革します。スキャルパーや短期トレーダー向けに設計されたこのツールは、注文帳の不均衡を特定し、迅速かつ正確な取引のための貴重な機会を提供します。 小さな価格変動でのチャンスを捉える Imbalance DOM Proは、価格の小さな動きをキャッチしたいトレーダーに最適なツールです。高度な計算により、このインジケーターは注文帳の不均衡を解釈し、素早いエントリーとエグジットのための重要なインサイトを提供します。 重要:MT5で注文帳が利用できることを確認してください Imbalance DOM Proを使用する前に、あなたのブローカーがMT5で注文帳にアクセスできることを確認してください。このインジケーターはリアルタイムデータに依存しているため、MT5は注文帳の履歴を保存しません。そのため、Imbalance D
Book Data Binance
Thalles Nascimento De Carvalho
Book Data Binance! お気に入りの暗号通貨のオーダーブックにアクセスし、価格、ボリューム、バランスの分析を詳しく知ることができるとしたら、あなたの取引所がDOMへのアクセスを提供していなくてもどうでしょうか? Book Data Binanceを使えば、それが現実になります!このMQL5スクリプトは、市場のダイナミクスを深く理解したい暗号通貨トレーダーのために特別に開発されました。 主な機能: スクリプトメニューで利用可能な任意の暗号通貨のオーダーブックへの直接アクセス。 世界の主要な取引所の1つであるBinanceからのリアルタイムデータの更新。 オーダーブックのバランスを正確に分析し、価格の動きを特定して予測することが可能です。 Imbalance DOM Crypto インジケーター との統合により、市場分析を次のレベルに引き上げます。 なぜBook Data Binanceを選ぶべきなのか? これは、各価格レベルにおける買い手と売り手の行動を理解したい人にとって完璧な補完です!このスクリプトを使用することで、深い洞察を得る
FREE
Volume Flow Binance
Thalles Nascimento De Carvalho
Volume Flow Binance! お気に入りの暗号通貨の times and trades データにアクセスし、取引量の流れや価格の動きを分析する詳細を得られるとしたら、あなたのブローカーが取引履歴の完全なアクセスを提供していなくても、それが現実になると思いませんか? Volume Flow Binance を使えば、それが実現します!この MQL5 スクリプトは、リアルタイムの市場のダイナミクスを詳しく理解したい暗号通貨トレーダーのために設計されています。 主な特徴: スクリプトのメニューにある任意の暗号通貨の times and trades データに直接アクセス。 世界的に有名な取引所 Binance からのリアルタイムデータ更新。 価格の動きを予測し、取引量の流れを正確に分析。 Times and Sales Crypto インジケーター と統合し、市場分析を次のレベルに引き上げます。 なぜ Volume Flow Binance を選ぶべきなのか? これは、リアルタイムで売買行動を理解し、行われた取引を観察するための完璧なツールで
FREE
Cumulative Volume Bands
Thalles Nascimento De Carvalho
CVB Cumulative Volume Bands: 累積ボリュームでトレードを強化! CVB Cumulative Volume Bands は、累積ボリュームに基づく正確なシグナルを求めるトレーダー向けに設計された高度なインジケーターです。 このインジケーターは、累積ボリュームバンドを使用して、買いと売りの圧力を明確に読み取り、反転や強い価格変動を特定するのに役立ちます。 Cumulative Volume Bands for MT5 ! 主な特徴: 累積ボリューム分析 : ボリュームに基づいて重要な圧力点を検出します。 明確なエントリー/エグジットシグナル : リアルタイムでチャンスを捉えます。 簡単な解釈 : ユーザーフレンドリーなインターフェースとシンプルなビジュアル。 全ての資産とタイムフレームに対応 : どの市場でも、いつでも使用可能。 CVB Cumulative Volume Bands で一歩先を行き、自信を持ってトレードの判断を改善しましょう! フィードバックをお寄せいただき、改善にご協力ください!
Footprint Hunter
Thalles Nascimento De Carvalho
Footprint Hunter – MT4で努力と結果を見極めるレーダー Tape Hunterは、MetaTrader 4で価格の裏にある真実の動きを見たいトレーダーのための究極のインジケーターです。POC(ポイント・オブ・コントロール)に基づく買いと売りのアグレッシブな出来高を明確かつ直感的に表示し、各ローソク足の市場の努力と実際の結果を視覚化します。 ️ なぜ重要なのか? すべての出来高が価格を動かすわけではありません!Footprint Hunterは、努力(アグレッシブな出来高)が価格を本当に動かしているかを示し、以下を見極めるのに役立ちます: 本当のアグレッションとトラップの位置 市場が吸収されているのか押し込まれているのか 支配的な出来高と価格の方向性の一致 Tape Hunterを使えば、プロのテープリーディング視点を得て、より精度の高いエントリーとエグジットの判断が可能になります。 関連インジケーター – フロー分析を強化 より効率的なトレードのために、Tape Hunterと以下の強力なインジケーターを組み合わせて使いましょう:
Atr Projection
Thalles Nascimento De Carvalho
ATRプロジェクション指標は、金融市場における価格の潜在的な動きの限界について正確な洞察を提供するために設計され、テクニカル分析において堅牢なツールとして際立っています。その柔軟なアプローチにより、ユーザーは各取引資産の特定のニーズに適応する形で直感的に分析メトリクスをカスタマイズすることが可能です。 カスタマイズ可能な動作: ATRプロジェクションは、デフォルトでは過去100本のローソク足の平均の30%を考慮して動作します。この柔軟性により、ユーザーは好みや各資産の固有の特性に合わせてメトリクスを調整でき、よりパーソナライズされた分析が可能です。 30%および100本のローソク足の選択の裏にある論理: 慎重な割合とローソク足の数の選択は、過去の動きを正確に捉え、より精密なプロジェクションを提供することを目的としています。この戦略的なアプローチは、価格が有意な動きの可能性が高い領域を強調し、トレーダーにより情報を提供します。 ATRプロジェクションの利点: 1. カスタマイズ可能なテクニカル精度: ユーザーは各取引資産の特定の条件に合わせてメトリクスをカスタマイズできます。
Box Weis Wave
Thalles Nascimento De Carvalho
5 (1)
Weis Wave Box で分析力を高めましょう! 取引における正確さと明確さ を求めるなら、 Weis Wave Box が理想的なツールです。この 高度なボリューム波動インジケーター は、市場における努力と結果のダイナミクスを明確に可視化し、フロー読みやボリューム取引を行うトレーダーに不可欠です。 主な特徴: カスタマイズ可能なボリューム波 – ティック単位で調整し、戦略に合わせられます。 調整可能な履歴 – 特定期間の分析をより精密に行えます。 実際のボリューム vs ティック数 – 市場への実際の影響を理解します。 エナジーボックスの視覚化 – 市場が大きな努力を示し、価格変動が小さい箇所を確認できます。 ️ 5種類のスイング形態 – totalVol、length、width、barDVol、lengthDVolに基づきカスタマイズ可能。 実際のメリット: ボリューム論理の視覚的明確化 買い手・売り手の力関係の把握 反転や継続の可能性を示す視覚的シグナル 関連インジケーター Big Player Range – 機関投資家の活動ゾーン
Long Short Pro
Thalles Nascimento De Carvalho
Long & Short インジケーター - Pro バージョン: 市場分析の無限の可能性を解き放とう! すべての資産に制限なし Long & Short インジケーターの Pro バージョンは、すべての金融資産に対して完全な自由を提供します。制限なしで、同じインジケーターをお気に入りのすべての資産に適用できます! 制限なし インジケーターのすべての機能を制限なしでお楽しみください。Pro バージョンは、完全かつ無制限の体験を提供し、市場のあらゆる機会を最大限に活用できるようにします。 Pro バージョンの特徴 無制限のアクセス : インジケーターをすべての金融資産で使用し、その完全な可能性を探ります。 高度な精度 : 詳細な分析と明確なシグナルを活用して、情報に基づいた安全な決定を下すことができます。 完全な柔軟性 : 資産や戦略に関係なく、取引のニーズに合わせてインジケーターを調整します。 重要な機会のアラートを受け取る アラートを有効にして、重要なレベルを注意深く監視し、市場機会の最前線に立ち続けましょう。 EA 作成のためのバッファパラメ
AI Channel
Thalles Nascimento De Carvalho
AI Channel | MT5向け人工知能搭載の価格チャネル分析インジケーター AI Channel:人工知能でテクニカル分析を次のレベルへ AI Channel は、金融市場の価格チャネルを分析するために 人工知能 を活用した強力なツールです。このセクションでは、この革命的なインジケーターが投資家やトレーダーにどのように役立つかを詳しく解説します。 AI Channelとは? AI Channel は、高度な人工知能アルゴリズムで開発されたインジケーターです。過去の価格データを使用して取引チャネルを識別し、グラフ上の重要なサポートとレジスタンスレベルを強調表示します。 この分析に基づき、市場のエントリーやエグジットの可能性があるポイントに関する貴重なインサイトを提供します。 ️ AI Channelの仕組み AI Channelは価格チャネルに人工知能を適用し、資産のトレンド、パターン、過去の動きを分析します。市場の変化に動的に対応し、異なる時間軸や資産に適応します。 チャネルの上限と下限を特定し、トレーダーに反転やトレンド継続の可能性を明確に示しま
Didi Index Volume
Thalles Nascimento De Carvalho
Didiインデックスボリュームをご紹介します。これは、ブラジルのトレーダーであるオディール・アギアールによって開発されたテクニカル分析の指標であり、金融市場での機会を特定するための先進的かつ強力なアプローチで注目されています。さまざまなプラットフォームで利用可能なDidiインデックスボリュームは、正確な洞察と貴重な情報を求めるトレーダーにとって不可欠なツールとなっています。 この指標は、オディール・アギアールによって作成された名高いDidiインデックスと、取引量の知恵を駆使した組み合わせです。この組み合わせにより、価格の動向と取引量の相互作用をより深く分析し、資産の動きに対するユニークな視点を提供します。 洗練されたアルゴリズムと加重平均の計算を用いて、Didiインデックスボリュームは取引量に基づいた価格変動を予測することができます。この特徴は、新興トレンドの特定、市場の反転、そして適切なエントリーポイントや出口ポイントのタイミングを把握する上で非常に重要です。 Didiインデックスボリュームを使用することで、正確な市場の解釈が可能な客観的かつ信頼性の高い情報にアクセスできます。
TimeChannel
Thalles Nascimento De Carvalho
The "Timechannel" is a powerful technical analysis tool designed specifically for traders who want to gain deeper and more accurate insights into price movements across multiple timeframes (multi-timeframe). This indicator is an essential addition to the toolbox of any serious trader seeking to make informed and data-driven trading decisions. Key Features: Advanced Multi-Timeframe Analysis : Timechannel allows traders to analyze price movements on different timeframes simultaneously. This is cr
Master OBV
Thalles Nascimento De Carvalho
MasterOBV:市場のトレンドを正確に把握しよう! MasterOBV は、 ボリューム 、 ポジティブコレレーション 、および 移動平均線(MA) を組み合わせた テクニカル分析指標 で、金融市場でのトレンドの識別を向上させます。 主な機能: スマートボリューム: 取引量を分析し、トレンドの強さにおける重要な変化を特定します。 ポジティブコレレーション: 相関のある資産を組み合わせ、ペアのボリュームに基づいて価格の移動の可能性を強化する、より広範で正確な視点を提供します。 ビジュアルチャンネル: ビジュアルチャンネルを利用して、トレンドの継続と反転の可能性を明確かつ正確に評価し、直感的な視覚分析を提供します。 スムーズな移動平均線: MA が価格の変動を平滑化し、基礎的なトレンドの方向を特定しやすくします。 なぜ MasterOBV を選ぶべきか? 決定の自信: 複数の要素を統合し、自信を持ってエントリーとイグジットの決定ができるようにします。 包括的な分析: 価格だけでなく、ボリューム、資産の相関関係、およびビジュアルチャンネ
VolaMetrics VSA
Thalles Nascimento De Carvalho
VolaMetrics VSA | 技術分析の強力な味方 VolaMetrics VSA は、 Volume Spread Analysis (VSA) メソッドと詳細な 取引量分析 を組み合わせた技術分析指標です。 価格の重要な動き を 特定 し、 追跡 するために設計されたこのツールは、 取引量 と 価格スプレッド の相互作用を利用して、トレーディング決定をサポートする貴重な洞察を提供します。 Volume Spread Analysis (VSA) の基礎 Volume Spread Analysis (VSA) は、技術分析で尊敬されているメソッドで、 取引量 、 価格スプレッド 、および 価格の終値 の関係を特定の期間内で理解することに焦点を当てています。最も情報を持つオペレーター( スマートマネー )が価格の動きに影響を与えるという考えに基づき、VSA は 積み上げまたは分配のシグナル を特定し、価格の重要な変化を予測します。 VolaMetrics VSA の機能 ️ VolaMetrics VSA は、従来の VSA 分析を自動化し、 逆転の可能性があるシ
SwingVolumePro
Thalles Nascimento De Carvalho
概要 SwingVolumePro は、幅広い金融資産に適用できる高度で多用途なインジケーターであり、さまざまな取引スタイルをサポートします。厳密なボリュームと価格の分析に基づいて開発されており、すべてのレベルのトレーダーが高品質のデータに基づいて情報に基づいた意思決定を行うための明確で正確なシグナルを提供します。 SwingVolumePro.PDF 主な特徴 多用途性: SwingVolumePro は、株式、外為(フォレックス)、暗号通貨など、さまざまな資産に適用できます。スキャルピングから長期ポジションまで、さまざまな取引戦略に対応しています。 正確で信頼できるシグナル: 高精度なシグナルを提供することに重点を置いているSwingVolumeProは、価格吸収パターンや市場のアグレッションを特定するために高度な技術を使用しています。これらのシグナルは明確に表示され、迅速かつ効果的な意思決定が容易になります。 高度なボリュームと価格の分析: インジケーターは、ボリュームと価格の相互作用の詳細な分析を使用して、努力と結果の間にズレがある状況を検出
CVD SmoothFlow Pro
Thalles Nascimento De Carvalho
CVD SmoothFlow Pro - すべての資産に対応した無制限のボリューム分析! CVD SmoothFlow Pro は、精密で無制限のボリューム分析を求めるトレーダーに最適なソリューションです。Cumulative Volume Delta(CVD)の計算と高度なノイズフィルタリングを使用することで、プロ版はあらゆる金融資産の取引に必要な柔軟性と精度を提供します。 CVD SmoothFlow Pro が提供するもの: クリアな分析 :ノイズをフィルタリングし、すべての金融資産における重要なボリュームの動きを際立たせます。 ️ 正確な計算 :買いと売りの差を監視し、外為、インデックス、暗号通貨などの資産におけるボリュームの詳細な動きを提供します。 直感的なインターフェース :データの表示が明確で、分析がわかりやすく効率的です。 トレンドの特定 :市場のトレンドを自信を持って特定し、情報に基づいた意思決定をサポートします。 実用的な用途: リアルタイムで任意の資産における買い手と売り手のバランスを監視します。 ボリュームに基づいてトレンドの反転
Cumulative Vol Bands
Thalles Nascimento De Carvalho
CVB Cumulative Volume Bands: 累積ボリュームでトレードを強化! CVB Cumulative Volume Bands は、累積ボリュームに基づく正確なシグナルを求めるトレーダー向けに設計された高度なインジケーターです。 このインジケーターは、累積ボリュームバンドを使用して、買いと売りの圧力を明確に読み取り、反転や強い価格変動を特定するのに役立ちます。 主な特徴: 累積ボリューム分析 : ボリュームに基づいて重要な圧力点を検出します。 明確なエントリー/エグジットシグナル : リアルタイムでチャンスを捉えます。 簡単な解釈 : ユーザーフレンドリーなインターフェースとシンプルなビジュアル。 全ての資産とタイムフレームに対応 : どの市場でも、いつでも使用可能。 CVB Cumulative Volume Bands で一歩先を行き、自信を持ってトレードの判断を改善しましょう! フィードバックをお寄せいただき、改善にご協力ください!
ZigWave Oscillator
Thalles Nascimento De Carvalho
ZigWave Oscillator: オシレーターとZigZagで取引を強化! ZigWave Oscillatorは、金融市場分析において精度と明瞭さを求めるトレーダーに最適なツールです。このインジケーターは、オシレーターの強みとZigZagの視覚的なシンプルさを組み合わせ、迅速かつ効率的に最適な売買機会を見つけるのに役立ちます。 ZigWave Oscillatorを選ぶ理由 精密なオシレーター分析 : RSI、Williams %R、またはCCIを統合し、市場の主要な動きをキャッチします。 動的なZigZagと精密調整 : ZigZagのスイングは、オシレーターの買われすぎや売られすぎの領域で微調整され、反転ポイントを明確に示します。 完全なカスタマイズ ️: オシレーターとZigZagの設定を調整し、自分の戦略に合わせて最適化できます。 直感的で使いやすいデザイン エレガントでカスタマイズ可能なビジュアルレイアウトにより、ZigWave Oscillatorは市場のシグナルを簡単に読み取ることができ、取引に集中できます。 全てのアセット
Times and Sales Pro
Thalles Nascimento De Carvalho
Times and Sales Pro: 取引フローの不均衡であなたの取引を強化 小さな価格変動のチャンス Times and Sales Pro は、 Times and Trades に基づいて注文フローを操作するアナリストにとって欠かせないツールです。スキャルパーに最適で、高精度で小さな価格変動を活用したい方のために設計されています。高度な計算を使用して、このインジケーターは取引の不均衡を特定し、迅速なエントリーとエグジットのための貴重なシグナルを提供します。 重要: MT5でのTimes and Tradesの可用性 Times and Sales Pro を使用する前に、ブローカーがMT5で Times and Trades へのアクセスを提供していることを確認してください。このインジケーターは、正確なリアルタイム計算を生成するためにこのデータに依存しており、MT5は取引履歴を保存しません。したがって、このインジケーターはリアルタイムでのみ機能し、市場で実行された取引の即時の洞察を提供します。 Times and Sales Proの利点 明確
Mini Indice Composition
Thalles Nascimento De Carvalho
Mini Índice Composition: A Revolução na Análise do Mini Índice! O Mini Índice Composition é um indicador inovador que monitora em tempo real as principais ações que compõem o mini índice, trazendo uma visão quantitativa poderosa sobre o fluxo de ordens do mercado! Como Funciona? Diferente de outros indicadores que utilizam apenas dados históricos, o Mini Índice Composition faz uma leitura ao vivo das ordens que entram e saem das ações, pesando o impacto direto no mini índice. Com
Radar DI
Thalles Nascimento De Carvalho
Radar DI – Indicador de Taxa de Juros para Mini Índice e Mini Dólar com Exportação CSV e Integração IA Radar DI é um indicador especializado que transforma as variações da taxa de juros DI (Depósitos Interfinanceiros) em sinais operacionais estratégicos para os ativos mini índice (WIN) e mini dólar (WDO) . NOVA FUNCIONALIDADE: Exportação CSV + Integração com IA Agora o Radar DI permite exportar todos os dados em formato CSV , incluindo: Variações dos DIs Variação do Mini Índice (WIN)
LSTM Library
Thalles Nascimento De Carvalho
LSTM Library - MetaTrader 5用高度神経ネットワーク アルゴリズム取引のためのプロフェッショナル神経ネットワークライブラリ LSTM Libraryは、MQL5の取引戦略にリカレントニューラルネットワークのパワーをもたらします。このプロフェッショナルレベルの実装には、通常は専門的な機械学習フレームワークでしか見られない高度な機能を備えたLSTM、BiLSTM、GRUネットワークが含まれています。 "トレーディングにおける機械学習の成功の秘訣は、適切なデータ処理にあります。 Garbage In, Garbage Out –予測の品質はトレーニングデータの品質を超えることはありません。" — マルコス・ロペス・デ・プラド博士, Advances in Financial Machine Learning 主な機能 LSTM、BiLSTM、GRUの完全実装 より良い一般化のためのリカレントドロップアウト 複数の最適化アルゴリズム(Adam、AdamW、RAdam) 高度な正規化テクニック 包括的な評価指標システム トレーニング進捗の可視化 クラス重みによる不均衡デー
フィルタ:
レビューなし
レビューに返信