Times and Sales Pro
- 지표
- 버전: 2.1
- 업데이트됨: 24 10월 2024
- 활성화: 5

Times and Sales Pro: 거래 흐름의 불균형으로 거래를 강화하세요 📊🚀
🔎 작은 가격 변동의 기회
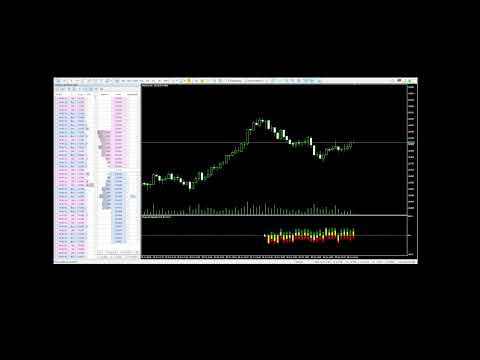
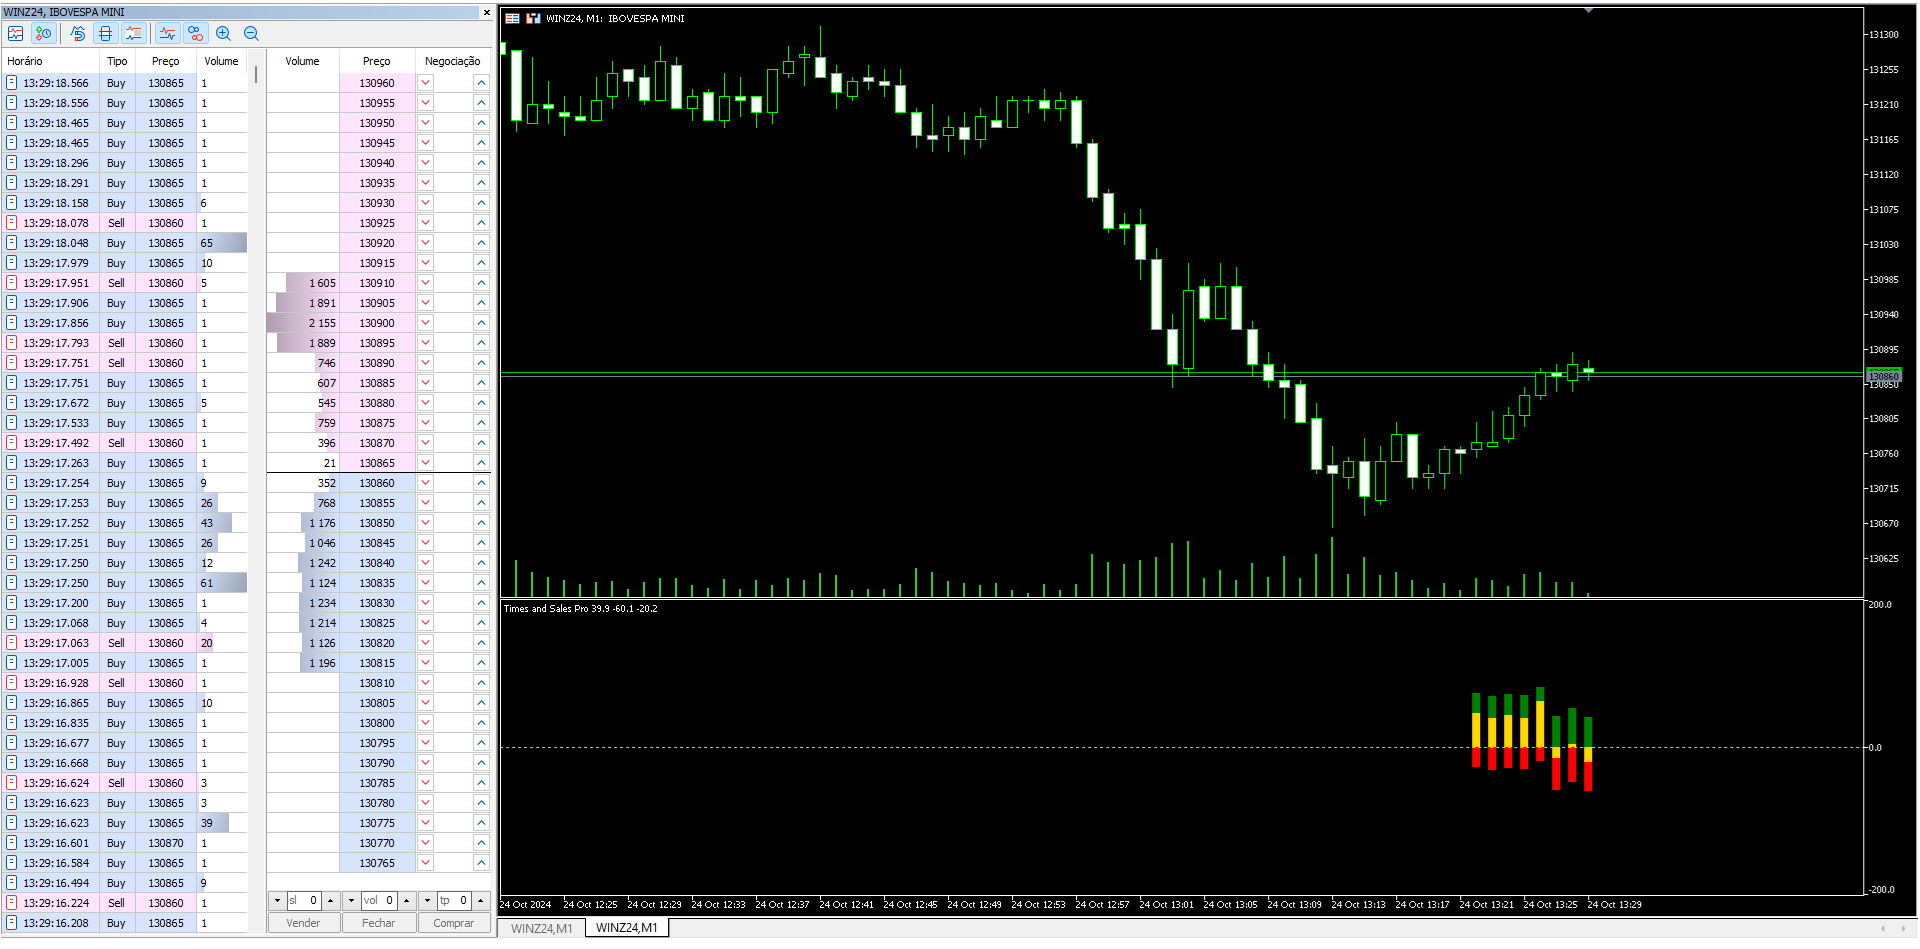
Times and Sales Pro는 Times and Trades를 통해 주문 흐름을 운영하는 분석가들에게 필수적인 도구입니다. 스캘퍼에게 이상적이며, 높은 정확도로 작은 가격 변동을 활용하고자 하는 분들을 위해 설계되었습니다. 고급 계산을 통해 이 지표는 거래의 불균형을 식별하여 빠른 진입 및 퇴출을 위한 귀중한 신호를 제공합니다.
💡 중요: MT5에서의 Times and Trades 이용 가능성
Times and Sales Pro를 사용하기 전에 브로커가 MT5에서 Times and Trades에 대한 접근을 제공하는지 확인하세요. 이 지표는 실시간으로 정확한 계산을 생성하기 위해 이 데이터에 의존하며, MT5는 거래 이력을 저장하지 않습니다. 따라서 이 지표는 실시간에서만 작동하며, 시장에서 실행된 거래에 대한 즉각적인 통찰을 제공합니다.
🚀 Times and Sales Pro의 장점
-
명확한 색상으로 고급 거래 흐름 분석
Times and Sales Pro는 특정 색상 코드로 거래의 불균형을 시각화하는 것을 간소화합니다:- 녹색: 매수 주문을 나타냅니다.
- 빨간색: 매도 주문을 나타냅니다.
- 금색: 매수와 매도 주문 간의 불균형을 나타냅니다.
이 색상들은 거래 흐름을 빠르고 명확하게 읽을 수 있게 하여, 특히 단기 거래(스캘핑)에 적합합니다.
-
실시간 매수 및 매도 신호
차트에서 명확하고 빠른 신호를 얻을 수 있어, 실시간으로 거래 흐름의 변화에 신속하게 반응할 수 있습니다. -
거래 흐름 거래자에게 이상적
실행된 주문의 흐름에 따라 거래하는 경우, 이는 효율성을 극대화하기 위한 완벽한 지표입니다. 매수 및 매도 주문 간의 불균형에 대한 명확한 시각을 제공하여, 결정의 정확성을 높입니다. -
강력한 전문가 상담사(EA) 생성과 호환 가능
Times and Sales Pro는 EA(Expert Advisors)와의 통합을 위한 버퍼를 제공합니다. 버퍼를 설정하여 강력한 전문가를 구축하세요:- 버퍼 0: 매수 신호
- 버퍼 1: 매도 신호
- 버퍼 2: 불균형 (금색)
이 기능들은 거래 흐름의 불균형에 기반한 전략을 자동화하고 운영을 최적화할 수 있도록 합니다.
- 사용 및 구성 용이
직관적인 인터페이스와 정확한 거래 흐름 분석을 통해 Times and Sales Pro는 운영을 간소화하며, 복잡함 없이 실시간의 상세한 분석을 제공합니다.
사용자가 평가에 대한 코멘트를 남기지 않았습니다