Cvd Divergence

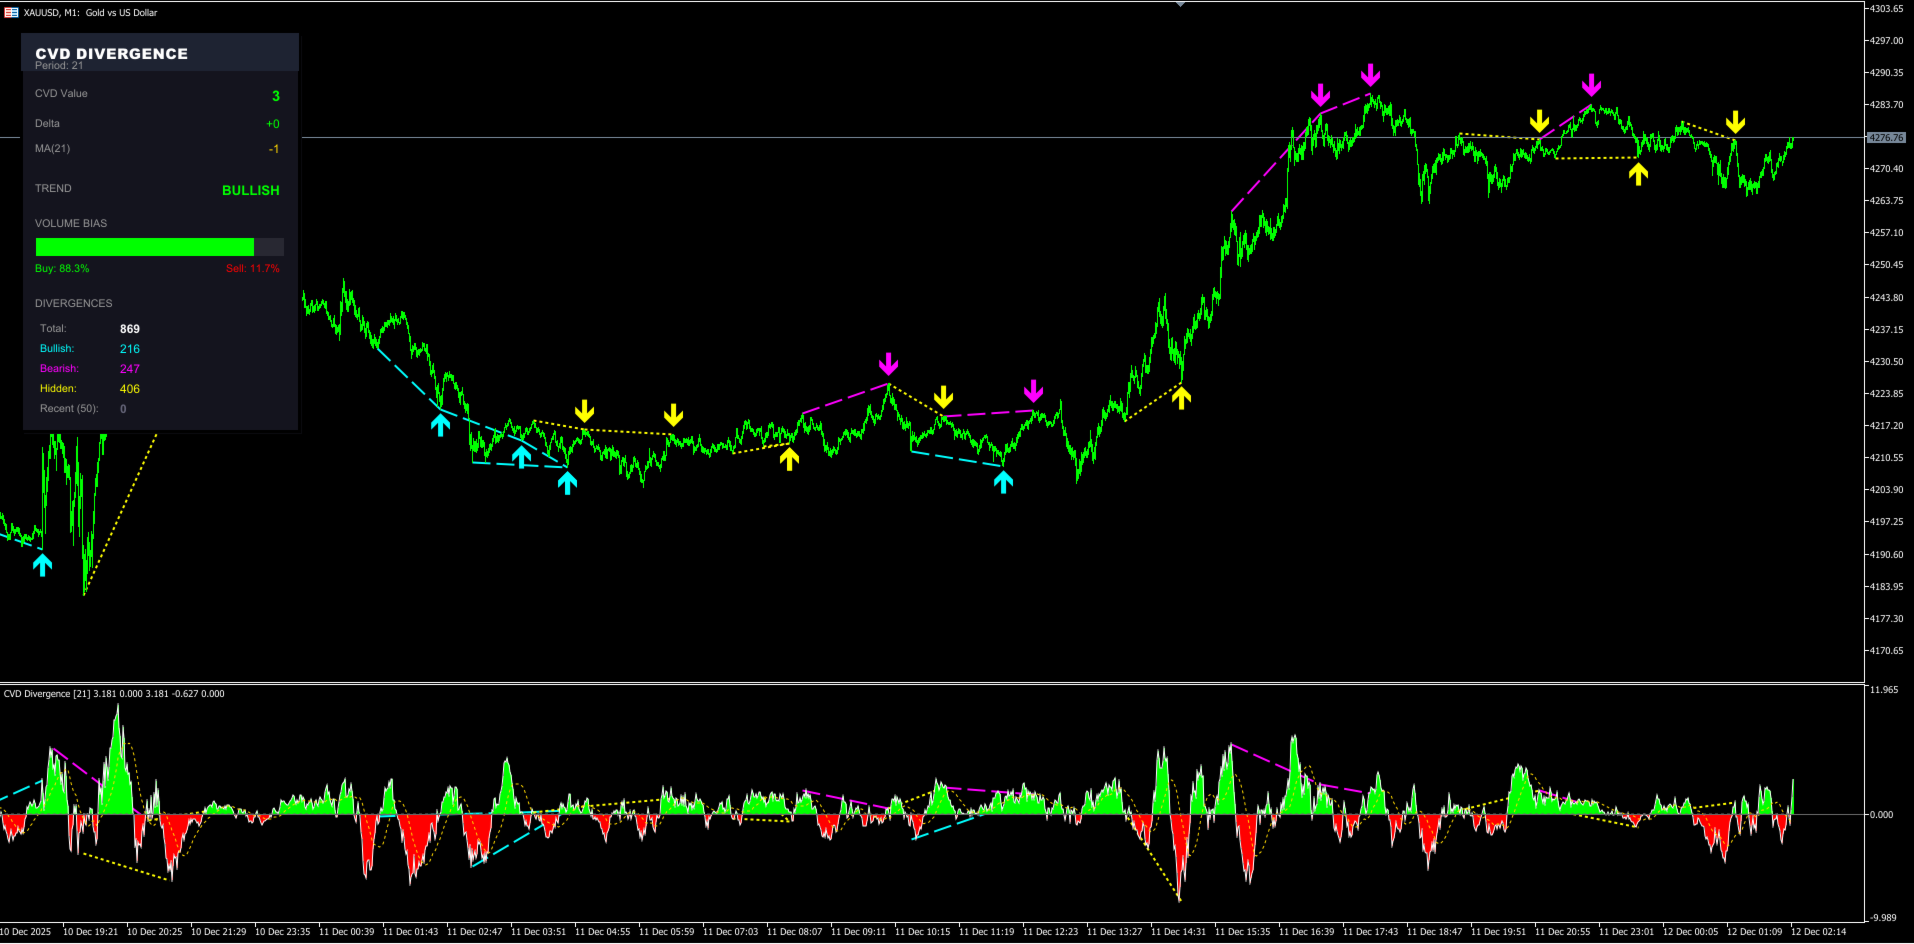
CVD Divergence – Analyse Professionnelle du Flux d’Ordres et des Divergences

CVD Divergence est un indicateur technique conçu pour détecter des divergences fiables entre le prix et le Cumulative Delta Volume (CVD). Il identifie avec précision les moments où le flux réel d’ordres ne confirme pas le mouvement du prix, révélant ainsi de possibles retournements, des phases d’essoufflement et des manipulations institutionnelles.

L’indicateur combine l’analyse du volume agressif avec l’étude structurelle du prix, offrant des signaux clairs, objectifs et anticipés.

Fonctionnement de l’indicateur

CVD Divergence utilise le Cumulative Delta Volume pour comparer la direction du flux d’ordres à celle du prix. Lorsque les deux s’écartent de manière significative, l’indicateur marque ce point sur le graphique et indique visuellement la direction de la divergence.

Il détecte :

  • Divergences haussières (flux positif alors que le prix baisse)

  • Divergences baissières (flux négatif alors que le prix monte)

  • Essoufflement des acheteurs et des vendeurs

  • Faux mouvements causés par des déséquilibres institutionnels

  • Situations où le prix peut être artificiellement manipulé

Pourquoi le Cumulative Delta Volume est si puissant

Le CVD révèle l’intention réelle des acteurs du marché.
Exemples typiques :

  • Prix en hausse avec CVD en baisse → ventes institutionnelles agressives malgré une apparence haussière

  • Prix en baisse avec CVD en hausse → accumulation discrète et augmentation de la demande réelle

  • Divergences marquées entre prix et CVD annoncent souvent des retournements ou des faux cassures

Le graphique de prix peut être trompeur, mais le delta cumulé l’est rarement.
L’indicateur transforme ces informations en signaux pratiques, directs et fiables.

Caractéristiques principales

  • Détection automatique des divergences entre prix et delta cumulé

  • Mise en évidence visuelle grâce à des flèches indiquant la direction attendue

  • Calcul précis du CVD basé sur le volume agressif

  • Interface claire, épurée et facile à interpréter

  • Alertes optionnelles : pop-up, notifications push et signaux sonores

  • Faible utilisation du CPU, même sur plusieurs actifs

  • Particulièrement efficace sur Forex, indices, actions et crypto

Pour qui l’indicateur est-il conçu ?

  • Traders souhaitant anticiper les retournements grâce au flux d’ordres

  • Professionnels utilisant l’analyse institutionnelle et le volume delta

  • Scalpers, day traders et swing traders

  • Opérateurs recherchant une confirmation solide avant d’entrer ou sortir d’une position

  • Utilisateurs qui veulent des signaux clairs, sans repaint et sans subjectivité

Version MQL5

CVD Divergence a été développé exclusivement pour MetaTrader 5, garantissant :

  • Haute performance et stabilité

  • Compatibilité totale avec les EAs et autres indicateurs

  • Exécution rapide et fiable

  • Signaux stables et sans repaint


Produits recommandés
The Optimized MACD Divergence indicator is a powerful tool designed to identify potential trading opportunities by detecting divergences between price action and the MACD indicator. It combines classic divergence analysis with candlestick pattern recognition and volume filtering to provide more accurate and reliable signals. How it Works The indicator operates on the following principles: MACD Calculation:   It calculates the MACD indicator using user-defined parameters for fast EMA, slow EMA,
FXC iMACD-DivergencE MT5 Indicator This is an advanced MACD indicator that finds trend-turn divergences on the current symbol. The indicator detects divergence between the MACD and the price movements as a strong trend-turn pattern. Main features: Advanced divergence settings Price based on Close, Open or High/Low prices Give Buy/Sell open signals PUSH notifications E-mail sending Pop-up alert Customizeable Information panel Input parameters: MACD Fast-EMA: The Fast-EMA variable of the MACD indi
FXC iDeM-DivergencE MT5 Indicator This is an advanced DeMarker indicator that finds trend-turn divergences on the current symbol. The indicator detects divergence between the DeMarker and the price movements as a strong trend-turn pattern. Main features: Advanced divergence settings Price based on Close, Open or High/Low prices Give Buy/Sell open signals PUSH notifications E-mail sending Pop-up alert Customizeable Information panel Input parameters: DeM Period: The Period size of the DeMarker in
The Trend Duration Forecast MT5 indicator is designed to estimate the probable lifespan of a bullish or bearish trend. Using a Hull Moving Average (HMA) to detect directional shifts, it tracks the duration of each historical trend and calculates an average to forecast how long the current trend is statistically likely to continue. This allows traders to visualize both real-time trend strength and potential exhaustion zones with exceptional clarity. KEY FEATURES Dynamic Trend Detection:   Utiliz
Heiken Ashi Smoothed Strategy is a very simple but powerful system to get forex market trend direction. This indicator is actually 2 indicators in 1 pack, Heiken Ashi and Heiken Ashi Smoothed Moving Average both included. Because HA (Heiken Ashi) and HAS (Heiken Ashi Smoothed) are calculated in the same one system event with necessary buffers and loop only, so it is the FAST, OPTIMIZED and EFFICIENT HA having the combined indicator of MetaTrader 5. You can choose to display HA and HAS in the sam
RBreaker
Zhong Long Wu
RBreaker Gold Indicators est une stratégie de trading intraday à court terme pour les contrats à terme sur l'or, qui combine deux approches : le suivi de tendance et le retournement intraday. Elle permet non seulement de capturer les profits dans les marchés en tendance, mais aussi de prendre des bénéfices en temps opportun lors des retournements de marché et d'ouvrir une position en sens inverse. Cette stratégie a été classée pendant 15 années consécutives parmi les dix stratégies de trading l
Gekko MACD Plus
Rodrigo Galeote
3 (3)
Type: Oscillator This is Gekko's Cutomized Moving Average Convergence/Divergence (MACD), a customized version of the famous MACD indicator. Use the regular MACD and take advantage of several entry signals calculations and different ways of being alerted whenever there is potential entry point. Inputs Fast MA Period: Period for the MACD's Fast Moving Average (default 12); Slow MA Period: Period for the MACD's Slow Moving Average (default 26); Signal Average Offset Period: Period for the Signal A
Noize Absorption Index - is the manual trading system that measures the difference of pressure between bears forces and bulls forces. Green line - is a noize free index that showing curent situation. Zero value of index shows totally choppy/flat market.Values above zero level shows how powerfull bullish wave is and values below zero measures bearish forces.Up arrow appears on bearish market when it's ready to reverse, dn arrow appears on weak bullish market, as a result of reverse expectation.
Caicai L&S Yield Histogram Important Notice: This indicator is an integral tool of the automated EA Caicai Long and Short Pair Trading . This indicator visually displays the percentage deviation (Yield %) of a pair's current spread relative to its own historical mean. It is an excellent tool for quickly visualizing the gross financial potential of a market distortion in Long & Short operations. Main Features: Percentage Visualization: Understand the size of the distortion in palpable percentage
MACDivergence MTF MT5
Pavel Zamoshnikov
4 (5)
Advanced ideas of the popular MACD indicator: It detects and displays classic and reverse divergences (two methods of detecting divergences). It uses different color to highlight an uptrend and a downtrend. Two methods of determining a trend: а) MACD crosses the 0 level (classic signal); б) MACD crosses its own average (early signal). This is a multi-timeframe indicator: it can display MACD data from other timeframes. Two methods of drawing: classic histogram and line. It generates sound and vis
Fractals
Mikhail Nazarenko
The Fractals indicator displays on the chart only fractals with the specified parameters in the indicator settings. This allows you to more accurately record a trend reversal, excluding false reversals. According to the classical definition of a fractal, it is a candlestick - an extremum on the chart, which was not crossed by the price of 2 candles before and 2 candles after the appearance of a fractal candle. This indicator provides the ability to adjust the number of candles before and after t
Stochastic Divergen MT5
Komang Putra Riswanjaya
2 (1)
Overview The Stochastic Divergence Indicator is a tool designed to help identify potential market turning points by analyzing divergences between price and the Stochastic Oscillator. It highlights divergence signals visually on the chart, assisting traders in observing possible trend changes. Key Features No Repaint: Once a signal is formed, it remains on the chart. Adjustable Parameters: Settings can be modified to fit different trading preferences and timeframes. Visual Display: Arrows are plo
MFI Divergence for MetaTrader 5 MFI Divergence is a practical and easy-to-use MT5 indicator that detects regular and hidden divergences using the Money Flow Index (MFI) . It is built for traders who want a cleaner way to spot possible reversals , continuation setups , and momentum weakness directly from chart structure. The indicator runs in a separate window and automatically analyzes MFI pivot highs and lows against price highs and lows . When divergence conditions are found, it draws cle
ALIEN Dashboard
Youssef Esseghaiar
ALIEN DASHBOARD FULL EDITION – Professional ICT & Precision Trading Dashboard for MT5 ( HYBRID ENGINE ) Overview The   Alien Dashboard Full Edition   is a comprehensive, all‑in‑one technical indicator for MetaTrader 5 that merges the most powerful concepts from Inner Circle Trader (ICT) methodology with advanced precision‑entry logic, multi‑timeframe analysis, and an intuitive on‑chart dashboard. Designed for serious traders who want to visualise institutional order flow, identify high‑probabili
The RSI Divergence + FVG Signal indicator combines Relative Strength Index (RSI) Divergence with Fair Value Gap (FVG) detection to generate high-probability buy and sell signals based on both momentum shifts and institutional imbalance zones. Core Features: RSI Divergence Detection : Identifies both regular and hidden bullish/bearish divergences between price and RSI. Divergences indicate potential trend reversals or continuation. FVG Zone Recognition : Detects Fair Value Gaps (imbalances caused
##   ONLY GOLD ##   Тiльки Золото ## **Mercaria Professional Trading Zones - Complete Guide** ## **Mercaria Professional Trading Zones - Повний посібник** ### **How Mercaria Zones Work / Як працюють зони Mercaria** **English:** Mercaria Zones is an advanced trading indicator that identifies high-probability support and resistance areas using ZigZag extremes combined with mathematical zone calculations. The indicator works on multiple timeframes simultaneously, providing a comprehensive view
Terra Infinity is a flat indicator. This improved version of the CalcFlat indicator has three additional lines that significantly increase its effectiveness. Unlike its predecessor with two static levels, Terra Infinity adds three dynamic lines above the main histogram, which are interpreted as follows: base signal line, minimum signal line, maximum signal line. These lines are formed using the additional parameter Avg, which is the average value of the histogram. Averaging produces a line cl
Master Edition
Peter Ofunda Fischer
Harvester Pro Universal Master The Ultimate Volatility Breakout & Trend-Following Solution for XAUUSD and Major Pairs. Harvester Pro Universal Master is a professional-grade Expert Advisor (EA) engineered for high-performance trading on the MetaTrader 5 (MT5) platform. Optimized specifically for XAUUSD (Gold) and major currency pairs like EURUSD , this EA combines a sophisticated Volatility Breakout engine with a robust EMA/TEMA Trend-Following filter to capture explosive market moves with surg
MACD Intraday Trend PRO est un indicateur développé grâce à une adaptation du MACD original créé par Gerald Appel dans les années 1960. Au fil des années de négociation, il a été observé qu'en modifiant les paramètres du MACD avec les proportions de Fibonacci, nous obtenons une meilleure présentation de la continuité des mouvements de tendance, ce qui permet de détecter plus efficacement le début et la fin d'une tendance de prix. En raison de son efficacité à détecter les tendances de prix, i
Vortex MT5
KEENBASE SOFTWARE SOLUTIONS
The Vortex Indicator was first presented by Douglas Siepman and Etienne Botes in January 2010 edition of Technical Analysis of Stocks & Commodities. Despite its based on a complex implosion phenomenon, the vortex is quite simple to interpret. A bullish signal is generated when +VI line cross above the -VI line and vice versa. The indicator is mostly used as a confirmation for trend trading strategies. The Vortex was inspired by the work of Viktor Schauberger, who studied the flow of water in tur
Unlock hidden profits: accurate divergence trading for all markets Tricky to find and scarce in frequency, divergences are one of the most reliable trading scenarios. This indicator finds and scans for regular and hidden divergences automatically using your favourite oscillator. [ Installation Guide | Update Guide | Troubleshooting | FAQ | All Products  ] Easy to trade Finds regular and hidden divergences Supports many well known oscillators Implements trading signals based on breakouts Displays
The   Fibonacci Confluence Toolkit   is a technical analysis tool designed to help traders identify potential price reversal zones by combining key market signals and patterns. It highlights areas of interest where significant price action or reactions are anticipated, automatically applies Fibonacci retracement levels to outline potential pullback zones, and detects engulfing candle patterns. Its unique strength lies in its reliance solely on price patterns, eliminating the need for user-define
Smart Stochastic Divergence Detector Description: The Smart Stochastic Divergence Detector is a professional tool that automatically identifies Bullish & Bearish Divergences on your chart using the Stochastic Oscillator . It helps traders detect early reversals , hidden momentum changes , and trend continuation signals without the need for manual analysis. Whether you trade Forex, Indices, Stocks, or Crypto , this tool provides clear divergence signals with arrows and trendlines – allowin
Schaff Trend Cycle STC
Mohammad Taher Halimi Tabrizi
The Schaff Trend Cycle indicator is the product of combining Slow Stochastics and the moving average convergence/divergence (MACD). The MACD has a reputation as a trend indicator, but it's also notorious for lagging due to its slow responsive signal line. The improved signal line gives the STC its relevance as an early warning sign to detect currency trends. this indicator is converted from Trading View code of STC Indicator - A Better MACD [SHK]
Технический индикатор Universal Oscillator является комбинацией торговых сигналов самых популярных и широко используемых осцилляторов. Индикатор представлен гистограммами, а также линиями fast и slow MA, что позволяет расширить список получаемых торговых рекомендаций и работать как по тренду, так и в боковом движении рынка. Таким образом, гистограммы позволяют определить момент пробоя ценовых значений и движение в новой фазе рынка, а линии указывают на зоны перекупленности и перепроданности.  Ос
Rainbow EA MT5
Jamal El Alama
Description : Rainbow EA MT5 is a simple Expert advisor based on   Rainbow MT5 indicator witch is based on Moving average with period 34. The indicator is incorporated in the EA, therefore, it is not required for the EA to operate, but if you wish, you can download it from   my product page . The Expert Advisor settings are as follows : Suitable for Timeframes up to H1 The parameters below can be set according to your trading rules. StopLoss ( Stop Loss in pips) TakeProfit ( Take Profit in pips
TRI Visualizer
Yoshimi Mon 三 Ura
TRI Visualizer MT5 – Thermodynamic Market Analysis Overview The TRI (Thermal Range Indicator) Visualizer Enhanced is a rare market analysis indicator that goes beyond conventional technical analysis, applying principles of thermodynamics from physics. It interprets market price fluctuations as “thermodynamic energy,” enabling the highly accurate detection of subtle market changes that are often overlooked. Innovative Mechanisms 1. Dual Calculation Engines Classic TRI Mode Formula: |Close
Stochastic R
Antony Augustine
Stochastic  Reversal  allows you to recognize reversals professionally. Stochastic Indicator: This technical indicator was developed by George Lane more than 50 years ago. The reason why this indicator survived for so many years is because it continues to show consistent signals even in these current times. The Stochastic indicator is a momentum indicator that shows you how strong or weak the current trend is. It helps you identify overbought and oversold market conditions within a trend.  Rules
Weis Wave Scouter
Jean Carlos Martins Roso
Découvrez la puissance de l'analyse avancée du volume avec le Weis Wave Scouter, un indicateur révolutionnaire pour MetaTrader 5 combinant les principes éprouvés de la méthode Wyckoff et de l'analyse VSA (Volume Spread Analysis). Conçu pour les traders recherchant précision et profondeur, cet indicateur fournit une lecture tactique du marché via l'analyse des vagues de volume cumulatif, aidant à identifier les points clés de retournement et de continuation de tendance. Le Weis Wave Scouter propo
SMC Order Blocks + FVG — Professional Smart Money Concept Indicator Unlock institutional trading insights with this professional-grade Smart Money Concept indicator. Automatically detect Order Blocks and Fair Value Gaps used by banks and hedge funds. KEY FEATURES: ORDER BLOCKS DETECTION • Automatic bullish and bearish Order Block identification • Based on price action and impulse strength analysis • Real-time mitigation tracking • Customizable imp
Les acheteurs de ce produit ont également acheté
SignalTech MT5 is a trading system for EURUSD, USDCHF, USDJPY, AUDUSD, NZDUSD, EURJPY, AUDJPY, NZDJPY, CADJPY H2 and H3 Timeframe.  All the winning trades with chart setups are published on the comments page. 2025-12 1174 Pips 2026-01 2624 Pips 2026-02 2937 Pips 2026-03 2165 Pips 2026-04 2243 Pips It can generate signals with Buy/Sell Arrows and Pop-Up/Sound Alerts. Each signal has clear Entry and Stop Loss levels, which should be automatically flagged on the chart, as well as potential Targets
Azimuth Pro
Ottaviano De Cicco
5 (7)
Azimuth Pro V2: Synthetic Fractal Structure and Confirmed Entries for MT5 Overview Azimuth Pro is a multi-level swing structure indicator by Merkava Labs . Four nested swing layers, swing-anchored VWAP, ABC pattern detection, three-timeframe structural filtering, and closed-bar confirmed entries — one chart, one workflow from micro-swings to macro-cycles. This is not a blind signal product. It is a structure-first workflow for traders who care about location, context, and timing. V2 Launch Offe
Tout d'abord, il convient de souligner que cet outil de trading est un indicateur non repeint, non redessiné et non retardé, ce qui le rend idéal pour le trading professionnel. Cours en ligne, manuel utilisateur et démonstration. L'indicateur Smart Price Action Concepts est un outil très puissant à la fois pour les nouveaux et les traders expérimentés. Il regroupe plus de 20 indicateurs utiles en un seul, combinant des idées de trading avancées telles que l'analyse du trader Inner Circle et le
OmniSync Projection
Antonio-alin Teculescu
5 (1)
Chronos Fractal Engine is an innovative price projection indicator for MetaTrader 5, designed to transform your technical analysis by intelligently identifying and projecting historical price patterns. Built upon an advanced correlation algorithm and the fractal principles of the market, this powerful tool visualizes potential future price movements, giving you a unique edge in your trading decisions. What is Chronos Fractal Engine? At its core, the Chronos Fractal Engine employs a sophisticat
KT Alpha Hunter Arrows MT5
KEENBASE SOFTWARE SOLUTIONS
La plupart des indicateurs à flèches vous donnent un signal, puis vous laissent gérer tout le reste seul. KT Alpha Hunter Arrows vous fournit un plan de trading complet. Chaque flèche de signal apparaît avec un plan complet déjà tracé : ligne d’entrée, stop loss, quatre niveaux de take profit et un verdict d’edge en temps réel qui vous indique si ce symbole et cette unité de temps valent la peine d’être tradés maintenant. Le Trade Manager EA inclus prend en charge l’exécution après votre entrée,
ARICoins
Temirlan Kdyrkhan
ARICoin is a powerful trading companion designed to generate high-probability entry signals with dynamic TP/SL/DP levels based on volatility. Built-in performance tracking shows win/loss stats, PP1/PP2 hits, and success rates all updated live. Key Features: Buy/Sell signals with adaptive volatility bands Real-time TP/SL/DP levels based on ATR Built-in MA Filter with optional ATR/StdDev volatility Performance stats panel (Success, Profit/Loss, PP1/PP2) Alerts via popup, sound, push, or email Cust
Meravith MT5
Ivan Stefanov
5 (1)
Outil des market makers. Meravith va : Analyser toutes les unités de temps et afficher la tendance actuellement en vigueur. Mettre en évidence les zones de liquidité (équilibre des volumes) où le volume haussier et baissier est égal. Afficher tous les niveaux de liquidité provenant de différentes unités de temps directement sur votre graphique. Générer et présenter une analyse de marché sous forme de texte pour votre référence. Calculer les objectifs, les niveaux de support et les points de stop
RelicusRoad Pro : Système d'Exploitation Quantitatif du Marché 70% DE RÉDUCTION ACCÈS À VIE (DURÉE LIMITÉE) - REJOIGNEZ 2 000+ TRADERS Pourquoi la plupart des traders échouent-ils même avec des indicateurs "parfaits" ? Parce qu'ils tradent des concepts isolés dans le vide. Un signal sans contexte est un pari. Pour gagner, il faut de la CONFLUENCE . RelicusRoad Pro est un Écosystème Quantitatif complet . Il cartographie la "Fair Value Road", distinguant le bruit des cassures structurelles. Arrête
Fusion Monthly Levels + PinBar + Marubozu Description Cet indicateur unique combine trois outils puissants de l’analyse technique en un seul : Niveaux mensuels (High, Low, Open, Close) – pour repérer les zones clés de support et de résistance. Détection des PinBars – figure de retournement fiable signalant des rejets de prix. Détection des Marubozu – bougies de tendance fortes indiquant un momentum directionnel. Grâce à cette fusion, vous obtenez un outil visuel, complet et réactif pour an
CGE Trading Suite
Carl Gustav Johan Ekstrom
5 (2)
Institutional-Grade Analytics for MT5 C GE Trading Suite delivers the analytical edge typically reserved for professional trading desks. The platform integrates a full suite of analytical tools into one seamless workflow: dynamic grid mapping, liquidity behavior analysis, ECM, trend lines, MIDAS, trade cycles, and directional channel projections. Together, these provide a unified view of market structure and momentum. Directional clarity is further enhanced by the capital flow index, which meas
AriX
Temirlan Kdyrkhan
1 (4)
AriX Indicator for MT5 A powerful trend-following and signal-evaluation tool AriX is a custom MT5 indicator that combines Moving Averages and ATR-based risk/reward logic to generate clear buy/sell signals. It visualizes dynamic SL/TP levels, evaluates past trade outcomes, and displays win/loss statistics in a clean on-chart panel. Key features include: Buy/Sell signals based on MA crossovers ATR-based SL/TP1/TP2/TP3 levels with visual lines and labels Signal outcome tracking with real-time stat
Ziva LSE System
Hassan Abdullah Hassan Al Balushi
ZIVA LSE System A Professional Liquidity & Structure Execution Framework Executive Overview ZIVA LSE System is a professionally engineered analytical framework designed to interpret market behavior through structural logic and liquidity dynamics. It is not positioned as a conventional indicator. Rather, it functions as a structured execution environment that organizes price action into a clear, disciplined decision-making model. The system is built to deliver consistency, clarity, and controlled
TPA True Price Action indicator reveals the true price action of the market makers through 100% non-repainting signals strictly at the close of a candle! TPA shows entries and re-entries, every time the bulls are definitely stronger than the bears and vice versa. Not to confuse with red/green candles. The shift of power gets confirmed at the earliest stage and is ONE exit strategy of several. There are available now two free parts of the TPA User Guide for our customers. The first "The Basics"
The Propfolio Master Suite is the ultimate all-in-one analytical workstation for professional traders. Combining the power of the Beat The Market Maker (BTMM) methodology, Smart Money Concepts (SND/Liquidity), and Advanced Volume Profile, this suite replaces a dozen different indicators with one heavily optimized, beautifully designed engine. Monitor up to 14 pairs simultaneously from a single chart, instantly identify market cycles, and seamlessly map institutional footprints with the click of
L'indicateur « Dynamic Scalper System MT5 » est conçu pour la méthode de scalping, permettant de trader au sein des vagues de tendance. Testé sur les principales paires de devises et l'or, il est compatible avec d'autres instruments de trading. Fournit des signaux pour l'ouverture de positions à court terme le long de la tendance, avec un support supplémentaire pour les fluctuations de prix. Principe de l'indicateur : De grandes flèches déterminent la direction de la tendance. Un algorithme de
Footprint is an indicator for order flow and volume analysis. It helps identify market structure at the cluster level, find key zones with increased activity, and work with filters directly on the chart without constantly opening the settings window. Footprint Indicator Features cluster-based Bid x Ask and Delta charts; on-chart control panel; sliders for filter adjustments; Absorption; Initiative; Stacked Imbalances; Big Trades; dPOC / Dynamic Point of Control; Delta; side market profile; cumul
Presenting one-of-a-kind Gann Indicator for XAUUSD IQ Gold Gann Levels is a non-repainting, precision tool designed exclusively for XAUUSD/Gold intraday trading. It uses W.D. Gann’s square root method to plot real-time support and resistance levels, helping traders spot high-probability entries with confidence and clarity. William Delbert Gann (W.D. Gann) was an exceptional market analyst whose trading technique was based on a complex blend of mathematics, geometry, astrology, and ancient calcul
Elliott Wave Trend was designed for the scientific wave counting. This tool focuses to get rid of the vagueness of the classic Elliott Wave Counting using the guideline from the template and pattern approach. In doing so, firstly Elliott Wave Trend offers the template for your wave counting. Secondly, it offers Wave Structural Score to assist to identify accurate wave formation. It offers both impulse wave Structural Score and corrective wave Structure Score. Structural Score is the rating to sh
Pantera Indicator
Temirlan Kdyrkhan
5 (1)
A tool for on-chart strategy backtesting and performance analysis. A utility for developing, debugging, and testing custom trading ideas and indicator functions. An indicator designed to quickly test trading concepts and visualize the effectiveness of different input parameters. An all-in-one sandbox for testing everything from simple crossovers to complex, multi-condition trading systems.
L’indicateur met en évidence les zones où un intérêt est déclaré sur le marché , puis montre la zone d’accumulation des ordres . Il fonctionne comme un carnet d’ordres à grande échelle . C’est l’indicateur destiné aux grands capitaux . Ses performances sont exceptionnelles. Quel que soit l’intérêt présent sur le marché, vous le verrez clairement . (Il s’agit d’une version entièrement réécrite et automatisée – l’analyse manuelle n’est plus nécessaire.) La vitesse de transaction est un indicateur
TrendMaestro5
Stefano Frisetti
note: this indicator is for METATRADER4, if you want the version for METATRADER5 this is the link:  https://www.mql5.com/it/market/product/108106 TRENDMAESTRO ver 2.5 TRENDMAESTRO recognizes a new TREND from the start, he never makes mistakes. The certainty of identifying a new TREND is priceless. DESCRIPTION TRENDMAESTRO identifies a new TREND in the bud, this indicator examines the volatility, volumes and momentum to identify the moment in which there is an explosion of one or more of these da
IVISTscalp5
Vadym Zhukovskyi
5 (6)
iVISTscalp5 — Système de prévision du marché basé sur le temps iVISTscalp5 n’est pas un indicateur classique. C’est un système basé sur le timing pour MetaTrader 5, qui identifie quand le marché est le plus susceptible de bouger. ⸻ Fonctionnalités  • Timing précis  • Signaux BUY / SELL  • Potentiel de profit moyen  • Prévisions hebdomadaires  • 120+ instruments ⸻ Idée clé Le marché est influencé par le temps, pas seulement par le prix ⸻ iVISTscalp5 — Votre avantage temporel Nous vous
Le niveau Premium est un indicateur unique avec une précision de plus de 80 % des prédictions correctes ! Cet indicateur a été testé par les meilleurs Trading Specialists depuis plus de deux mois ! L'indicateur de l'auteur que vous ne trouverez nulle part ailleurs ! À partir des captures d'écran, vous pouvez constater par vous-même la précision de cet outil ! 1 est idéal pour le trading d'options binaires avec un délai d'expiration de 1 bougie. 2 fonctionne sur toutes les paires de devises
ZIVA Signal Intelligence
Hassan Abdullah Hassan Al Balushi
ZIVA Signal Intelligence An Adaptive, Modular Market Intelligence System ZIVA Signal Intelligence is not positioned as a conventional trading indicator. It is a fully integrated, proprietary market intelligence system engineered to deliver structured, high-precision interpretation of price behavior within a controlled analytical environment. Developed through an independent architectural approach, ZIVA does not rely on, derive from, or replicate existing indicators. It represents a standalone
FX Analysis is an all-in-one MT5 indicator dashboard that combines eight analytical tools in a single panel, helping traders identify high-probability setups without switching between charts or indicators. Designed for standard forex pairs on MetaTrader 5. Best results on M15 - H4 timeframes when all components are used together as part of the included workflow. Components Volatility Analyzer Displays historical average movement by hour and by day of the week. A real-time Pip Balance shows the
TraderHUD
Justino Porto Neto
TraderHUD — Panneau Complet pour le Trader TraderHUD est un indicateur visuel complet qui regroupe dans un seul fichier tout ce dont un trader a besoin sur le graphique : minuterie de bougie, spread en temps réel, filigrane personnalisable, marquage de l'heure pleine avec prix enregistré et marqueur de début de bougie M5. Tout est hautement configurable, sans encombrer le graphique. Fonctionnalités Minuterie et Spread Compte à rebours du temps restant de la bougie actuelle, mis à jour toutes les
Ultimate SMC Indicator
Hicham Mahmoud Almoustafa
1 (1)
Ultimate SMC Indicator v2.20 — Smart Money Concepts All-in-One Stop switching between 5 different indicators. Ultimate SMC gives you everything Smart Money traders need — in one clean indicator with interactive controls. GUIDE What makes this different? Most SMC indicators show you Order Blocks or FVGs separately. You still have to figure out which zones actually matter. Ultimate SMC does the hard work: it scans for Order Blocks, Fair Value Gaps, Liquidity Sweeps, Supply & Demand zones, Fibo
Introduction to X3 Chart Pattern Scanner X3 Cherart Pattern Scanner is the non-repainting and non-lagging indicator detecting X3 chart patterns including Harmonic pattern, Elliott Wave pattern, X3 patterns, and Japanese Candlestick patterns. Historical patterns match with signal patterns. Hence, you can readily develop the solid trading strategy in your chart. More importantly, this superb pattern scanner can detect the optimal pattern of its kind. In addition, you can switch on and off individu
SunSignal ML — AI Gold Signals with Multi-Timeframe Confluence SunSignal ML is an advanced AI-powered signal indicator purpose-built for XAUUSD gold trading. It combines a proprietary adaptive trend algorithm with six machine learning models trained on confirmed price pivots to produce high-confidence entry signals with multi-timeframe validation. The indicator runs efficiently on M1, M5 and M15 timeframes and is designed for traders who want precision entries guided by data rather than guesswor
Ace Trend
Mikhail Sergeev
5 (3)
Nous vous présentons un indicateur révolutionnaire qui change les règles du jeu dans le monde du trading de tendance. L'indicateur est conçu pour repenser les performances et élever votre expérience de trading à un niveau sans précédent. Notre indicateur dispose d'une combinaison unique de fonctionnalités avancées qui le distinguent de ses concurrents. La technologie de pointe "Real Pricing Factors" offre une durabilité inégalée, même dans les conditions de marché les plus difficiles et les plus
Plus de l'auteur
Tape Hunter
Thalles Nascimento De Carvalho
Tape Hunter – Votre radar Effort vs Résultat sur MT5 Tape Hunter est l’indicateur ultime pour les traders souhaitant voir le véritable jeu des prix sur MetaTrader 5. Il affiche de manière claire et intuitive les volumes agressifs d’achat et de vente basés sur le POC (Point of Control), vous permettant de visualiser l’effort du marché et le résultat réel de chaque chandelier. ️ Pourquoi est-ce important ? Tout volume ne fait pas bouger le prix ! Tape Hunter met en évidence si l’effort (vo
Big Player Range
Thalles Nascimento De Carvalho
5 (3)
BigPlayerRange – Meilleur indicateur pour MT5 BigPlayerRange est considéré comme le meilleur indicateur pour le Mini Indice et le Mini Dollar sur MetaTrader 5. Cet outil met en évidence les zones stratégiques d’action des gros acteurs du marché, offrant une analyse technique institutionnelle d’une grande précision. Comment utiliser BigPlayerRange : Cet indicateur trace des zones d’achat (ligne verte) et de vente (ligne rouge). Lorsque le prix clôture en dehors de ces zones, une tendance
VWAP FanMaster
Thalles Nascimento De Carvalho
3.5 (2)
VWAP FanMaster : Maîtrisez la stratégie de pullback avec précision ! VWAP FanMaster est l'indicateur ultime pour les traders à la recherche de points d'entrée précis et de pullbacks efficaces . Il combine la puissance de VWAP (Prix Moyen Pondéré par le Volume) et des lignes Fibonacci Fan , offrant une carte claire des zones d'intérêt du marché. Caractéristiques principales Simple mais puissant : Déplacez simplement les lignes verticales et l'indicateur trace automatiquement VWAP et les
FREE
Volume Flow Binance
Thalles Nascimento De Carvalho
Volume Flow Binance! Avez-vous déjà imaginé avoir accès aux times and trades de votre cryptomonnaie préférée, avec des détails sur les flux de volumes et l'analyse des mouvements de prix, même si votre courtier ne fournit pas un accès complet à l'historique des transactions ? Avec Volume Flow Binance , c'est désormais possible ! Ce script en MQL5 a été conçu pour les traders de cryptomonnaies qui recherchent une vue détaillée de la dynamique du marché en temps réel. Caractéristiqu
FREE
Book Data Binance
Thalles Nascimento De Carvalho
Book Data Binance! Avez-vous déjà imaginé avoir accès au carnet de commandes de votre cryptomonnaie préférée, avec des détails sur les prix, les volumes et l'analyse des déséquilibres, même si votre plateforme d'échange ne propose pas d'accès au DOM ? Avec Book Data Binance, cela devient réalité ! Ce script en MQL5 a été spécialement développé pour les traders de cryptomonnaies qui cherchent à approfondir leur compréhension des dynamiques du marché. Caractéristiques principales :
FREE
Cumulative Volume Bands
Thalles Nascimento De Carvalho
CVB Cumulative Volume Bands : Optimisez vos opérations avec le volume cumulé ! CVB Cumulative Volume Bands est un indicateur avancé conçu pour les traders qui recherchent des signaux précis basés sur le volume cumulé. En utilisant des bandes de volume cumulé, cet indicateur fournit des lectures claires des pressions d'achat et de vente sur le marché, aidant ainsi à identifier les retournements et les mouvements de prix importants. Cumulative Volume Bands for MT5 ! Caractéristique
Footprint Hunter
Thalles Nascimento De Carvalho
Footprint Hunter – Votre radar Effort vs Résultat sur MT4 Tape Hunter est l’indicateur ultime pour les traders souhaitant voir le véritable jeu des prix sur MetaTrader 4. Il affiche de manière claire et intuitive les volumes agressifs d’achat et de vente basés sur le POC (Point of Control), vous permettant de visualiser l’effort du marché et le résultat réel de chaque chandelier. ️ Pourquoi est-ce important ? Tout volume ne fait pas bouger le prix ! Footprint Hunter met en évidence si l’
Swing Point Volume
Thalles Nascimento De Carvalho
Swing Point Volume, the indicator that signals weakness and strength at the tops and bottoms. This indicador can be for used the Wyckoff Method. Information provided; - Swing on customized ticks. - Volume and points in each balance sheet. - Percentage of Displacement. - Sound alert option on top and bottom breaks. - Volume in ticks and Real Volume. - Volume HL (extreme) or (opening and closing) - Customized volume shapes.
Atr Projection
Thalles Nascimento De Carvalho
L'indicateur ATR Projeção se distingue comme un outil robuste dans l'analyse technique, conçu pour fournir des informations précises sur les limites potentielles des mouvements de prix sur les marchés financiers. Son approche flexible permet aux utilisateurs de personnaliser de manière intuitive les métriques d'analyse, en s'adaptant aux besoins spécifiques de chaque actif négocié. Fonctionnement personnalisable : Par défaut, l'ATR Projeção fonctionne en considérant 30 % de la moyenne des 100
Box Weis Wave
Thalles Nascimento De Carvalho
5 (1)
Améliorez Votre Analyse avec le Weis Wave Box ! Si vous cherchez précision et clarté dans vos négociations , le Weis Wave Box est l’outil idéal. Cet indicateur avancé d’ondes de volume offre une visualisation claire de la dynamique entre effort et résultat sur le marché, essentiel pour les traders utilisant la lecture du flux et du volume. Fonctionnalités principales : Ondes de volume personnalisables – ajustez en ticks pour s’aligner avec votre stratégie. Historique ajustable – analy
Long Short Pro
Thalles Nascimento De Carvalho
Indicateur Long & Short - Version Pro : Déverrouillez le Potentiel Illimité de Votre Analyse de Marché ! Aucune Limite pour Tous les Actifs La version Pro de l’indicateur Long & Short vous offre une liberté totale pour l’utiliser sur tout actif financier. Plus de limitations – appliquez le même indicateur à tous vos actifs préférés ! Sans Limites Profitez de toutes les fonctionnalités de l’indicateur sans aucune restriction. La version Pro vous offre une expérience complète et illim
AI Channel
Thalles Nascimento De Carvalho
AI Channel | Indicateur MT5 avec intelligence artificielle pour canaux de prix AI Channel : Outil avancé d’analyse technique basé sur l’intelligence artificielle AI Channel est un outil puissant qui utilise l’intelligence artificielle pour analyser les canaux de prix sur les marchés financiers. Dans cette section, nous explorerons comment cet indicateur révolutionnaire peut aider les investisseurs et traders à prendre des décisions plus éclairées et stratégiques. Qu’est-ce que l’ind
Didi Index Volume
Thalles Nascimento De Carvalho
Nous vous présentons le Didi Index Volume, un indicateur d'analyse technique développé par le trader brésilien Odir Aguiar, qui se distingue par son approche avancée et puissante dans l'identification des opportunités sur les marchés financiers. Disponible sur différentes plateformes, le Didi Index Volume est devenu un outil essentiel pour les traders à la recherche d'informations précises et précieuses pour leurs stratégies de trading. Cet indicateur combine le célèbre Didi Index, créé par Odi
TimeChannel
Thalles Nascimento De Carvalho
The "Timechannel" is a powerful technical analysis tool designed specifically for traders who want to gain deeper and more accurate insights into price movements across multiple timeframes (multi-timeframe). This indicator is an essential addition to the toolbox of any serious trader seeking to make informed and data-driven trading decisions. Key Features: Advanced Multi-Timeframe Analysis : Timechannel allows traders to analyze price movements on different timeframes simultaneously. This is cr
Master OBV
Thalles Nascimento De Carvalho
MasterOBV : Maîtrisez les Tendances du Marché avec Précision ! MasterOBV est un indicateur d'analyse technique qui combine volume , correlation positive et une Moyenne Mobile (MA) pour affiner l'identification des tendances sur les marchés financiers. Fonctionnalités Principales : Volume Intelligent : Analyse le volume des transactions pour identifier les changements significatifs dans la force de la tendance. Correlation Positive : Intègre des actifs corrélés pour obtenir une vue pl
VolaMetrics VSA
Thalles Nascimento De Carvalho
VolaMetrics VSA | Un Puissant Allié dans l'Analyse Technique Le VolaMetrics VSA est un indicateur d'analyse technique qui combine la méthode Volume Spread Analysis (VSA) avec une analyse détaillée du volume des transactions . Conçu pour identifier et suivre les mouvements significatifs des prix , le VolaMetrics VSA utilise l'interaction entre volume et écart de prix pour fournir des insights précieux qui peuvent aider à prendre des décisions de trading. Les Fondements de la Volume Spread Anal
SwingVolumePro
Thalles Nascimento De Carvalho
Vue d'ensemble SwingVolumePro est un indicateur avancé et polyvalent, conçu pour être utilisé sur une large gamme d'actifs financiers et pour supporter différents styles de trading. Basé sur une analyse rigoureuse du volume et du prix, il fournit des signaux clairs et précis permettant aux traders de tous niveaux de prendre des décisions éclairées basées sur des données de haute qualité. SwingVolumePro.PDF Principales caractéristiques Polyvalence: SwingVolumePro peut être appliqué à d
CVD SmoothFlow Pro
Thalles Nascimento De Carvalho
CVD SmoothFlow Pro - Analyse de Volume Illimitée pour Tout Actif ! CVD SmoothFlow Pro est la solution ultime pour les traders recherchant une analyse de volume précise et illimitée. En utilisant le calcul du Cumulative Volume Delta (CVD) avec un filtrage avancé du bruit, la version Pro offre la flexibilité et la précision nécessaires pour trader tout actif financier. Que propose CVD SmoothFlow Pro ? Analyse Claire : Filtre le bruit du marché et met en avant les mouvements de volume signifi
Imbalance DOM Pro
Thalles Nascimento De Carvalho
5 (1)
Imbalance DOM Pro : Optimisez vos trades avec l'imbalance du carnet d'ordres AVEZ-VOUS ACCÈS AU CARNET D'ORDRES SUR MT5 ? SOUHAITEZ-VOUS ÉLEVER VOTRE TRADING À UN NIVEAU SUPÉRIEUR ? Si vous êtes un trader qui utilise le flux d'ordres pour prendre des décisions, Imbalance DOM Pro peut révolutionner votre analyse. Parfait pour les scalpers et les traders à court terme, cet outil identifie les déséquilibres dans le carnet d'ordres et vous offre des opportunités de trading précieuses pour des e
Cumulative Vol Bands
Thalles Nascimento De Carvalho
CVB Cumulative Volume Bands : Optimisez vos opérations avec le volume cumulé ! CVB Cumulative Volume Bands est un indicateur avancé conçu pour les traders qui recherchent des signaux précis basés sur le volume cumulé. En utilisant des bandes de volume cumulé, cet indicateur fournit des lectures claires des pressions d'achat et de vente sur le marché, aidant ainsi à identifier les retournements et les mouvements de prix importants. Caractéristiques principales : Analyse du volume c
ZigWave Oscillator
Thalles Nascimento De Carvalho
ZigWave Oscillator : Optimisez vos transactions avec des oscillateurs et ZigZag ! Le ZigWave Oscillator est l'outil parfait pour les traders recherchant précision et clarté dans l'analyse du marché financier. Cet indicateur combine la puissance des oscillateurs avec la simplicité visuelle du ZigZag, vous aidant à identifier rapidement et efficacement les meilleures opportunités d'achat et de vente. Pourquoi choisir le ZigWave Oscillator ? Analyse précise des oscillateurs : Intégrez RS
Times and Sales Pro
Thalles Nascimento De Carvalho
Times and Sales Pro : Optimisez vos opérations grâce à l'inégalité dans le flux de transactions Opportunités sur de petits mouvements de prix Times and Sales Pro est un outil essentiel pour les analystes qui travaillent avec le flux d'ordres via Times and Trades . Idéal pour les scalpers, il a été conçu pour ceux qui souhaitent tirer parti de petites fluctuations de prix avec une grande précision. Grâce à des calculs avancés, cet indicateur identifie les déséquilibres dans les transacti
Mini Indice Composition
Thalles Nascimento De Carvalho
Mini Índice Composition: A Revolução na Análise do Mini Índice! O Mini Índice Composition é um indicador inovador que monitora em tempo real as principais ações que compõem o mini índice, trazendo uma visão quantitativa poderosa sobre o fluxo de ordens do mercado! Como Funciona? Diferente de outros indicadores que utilizam apenas dados históricos, o Mini Índice Composition faz uma leitura ao vivo das ordens que entram e saem das ações, pesando o impacto direto no mini índice. Com
Radar DI
Thalles Nascimento De Carvalho
Radar DI – Indicador de Taxa de Juros para Mini Índice e Mini Dólar com Exportação CSV e Integração IA Radar DI é um indicador especializado que transforma as variações da taxa de juros DI (Depósitos Interfinanceiros) em sinais operacionais estratégicos para os ativos mini índice (WIN) e mini dólar (WDO) . NOVA FUNCIONALIDADE: Exportação CSV + Integração com IA Agora o Radar DI permite exportar todos os dados em formato CSV , incluindo: Variações dos DIs Variação do Mini Índice (WIN)
LSTM Library
Thalles Nascimento De Carvalho
LSTM Library - Réseaux de Neurones Avancés pour MetaTrader 5 Bibliothèque Professionnelle de Réseaux de Neurones pour le Trading Algorithmique LSTM Library apporte la puissance des réseaux neuronaux récurrents à vos stratégies de trading en MQL5. Cette implémentation de niveau professionnel comprend des réseaux LSTM, BiLSTM et GRU avec des fonctionnalités avancées généralement disponibles uniquement dans des frameworks spécialisés d'apprentissage automatique. "Le secret du succès dans l'apprenti
Filtrer:
Aucun avis
Répondre à l'avis