X3 Chart Pattern Scanner MT5
- 지표
-
Young Ho Seo
 Harmonic Pattern Indicator - Repainting + Japanese Candlestick Pattern Scanner + Automatic Channel + Many more
https://www.mql5.com/en/market/product/4488 - 버전: 8.71
- 업데이트됨: 12 1월 2022
- 활성화: 5
Introduction to X3 Chart Pattern Scanner
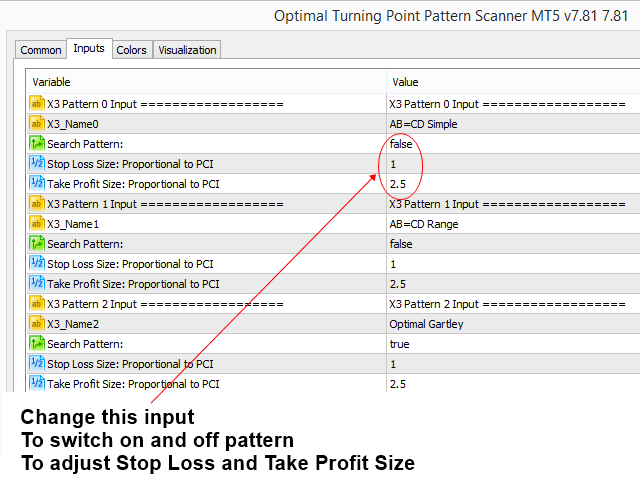
X3 Cherart Pattern Scanner is the non-repainting and non-lagging indicator detecting X3 chart patterns including Harmonic pattern, Elliott Wave pattern, X3 patterns, and Japanese Candlestick patterns. Historical patterns match with signal patterns. Hence, you can readily develop the solid trading strategy in your chart. More importantly, this superb pattern scanner can detect the optimal pattern of its kind. In addition, you can switch on and off individual patterns according to your preferences. For example, if you only want to trade harmonic patterns, then just switch off all Elliott Wave and X3 patterns. Also, note that each pattern is customizable with RECF notation. Japanese candlestick patterns are kind of bonus package added in the indicator. Japanese candlestick patterns can be used as the secondary confirmation for harmonic patterns, Elliott wave and X3 patterns. You can also switch on and off Japanese Candlestick patterns.
Harmonic Pattern Category
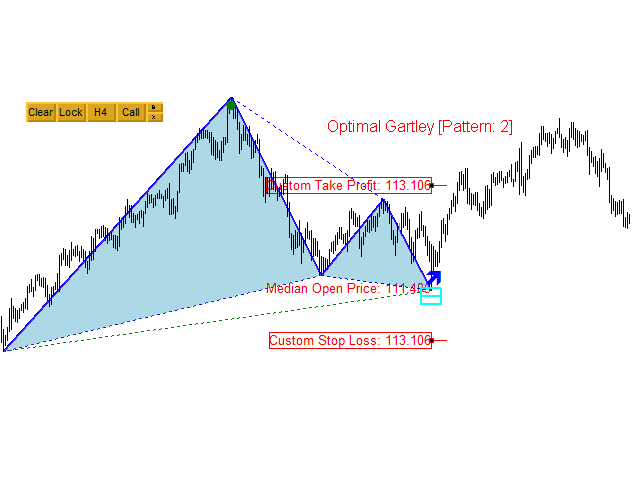
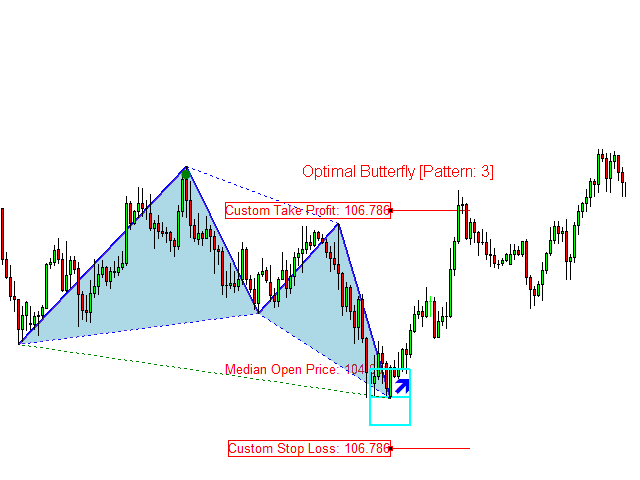
Detectable Harmonic Patterns include Optimal AB=CD, Optimal Butterfly Pattern, Optimal Gartley Pattern, Optimal Bat Pattern, Optimal Alternate Bat Pattern, Optimal Shark Pattern, Optimal Crab Pattern, Optimal Deep Crab Pattern, Optimal Cypher Pattern, Optimal 5-0 Pattern and Optimal 3 Drives Pattern.
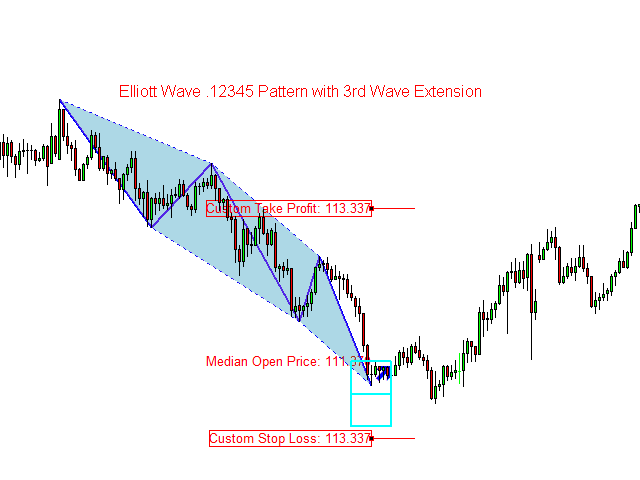
Elliott Wave Pattern Category
Detectable Elliott Wave patterns include Elliott Wave .1234 Pattern, Elliott Wave .12345 Pattern, Elliott Wave .12345AB Pattern and Elliot Wave .12345ABC Pattern. In addition, you can modify the structure of the Elliott Wave patterns as you wish.
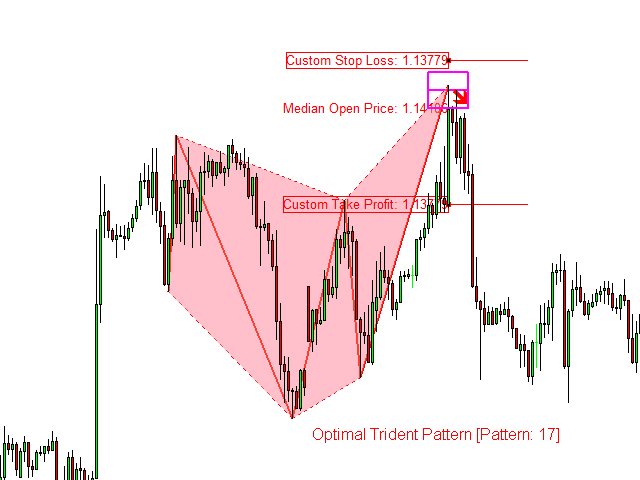
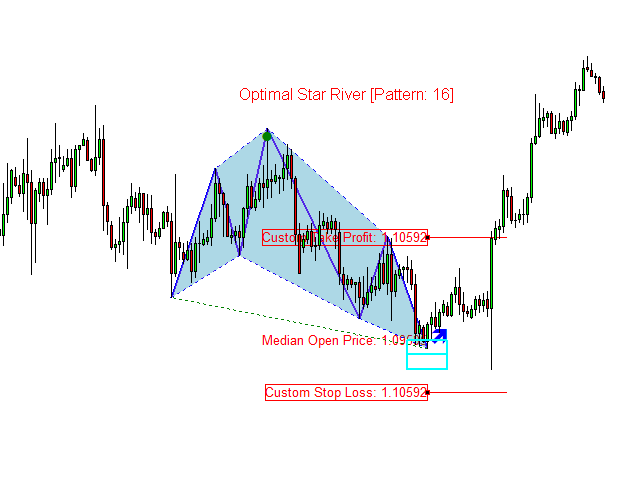
X3 Chart Pattern Category
Detectable X3 Chart Pattern includes Star River Pattern, Trident Pattern, Horse Pattern, Eagle Pattern and Phoenix Pattern.
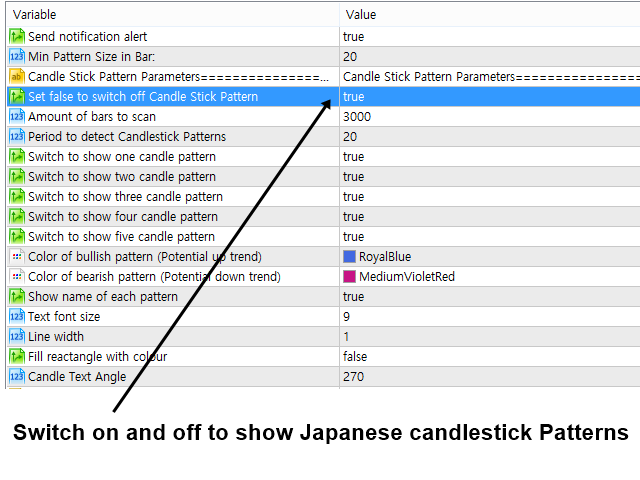
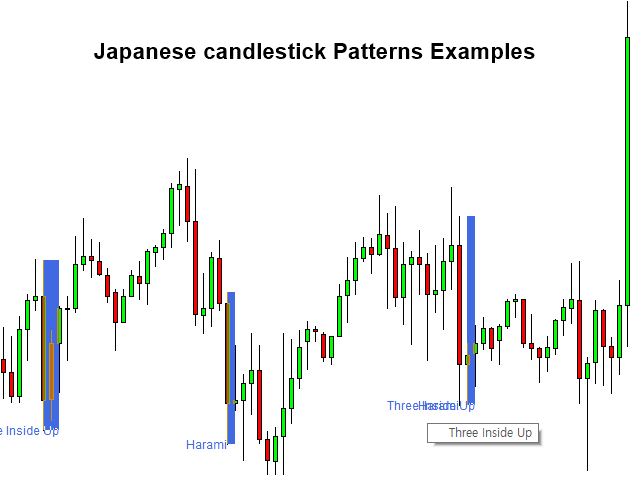
Japanese Candlestick Pattern Category
Detectable Japanese candlestick patterns include Engulfing, Piercing Line, Morning Star, Doji Star, Hammer, Harami and many more Japanese candlestick patterns also detetable.
Product Features
- Non-repainting and non-lagging Harmonic pattern, Elliott Wave pattern and X3 Chart Pattern scanner
- Pattern Completion Interval
- Potential Reversal Zone
- Potential Continuation Zone
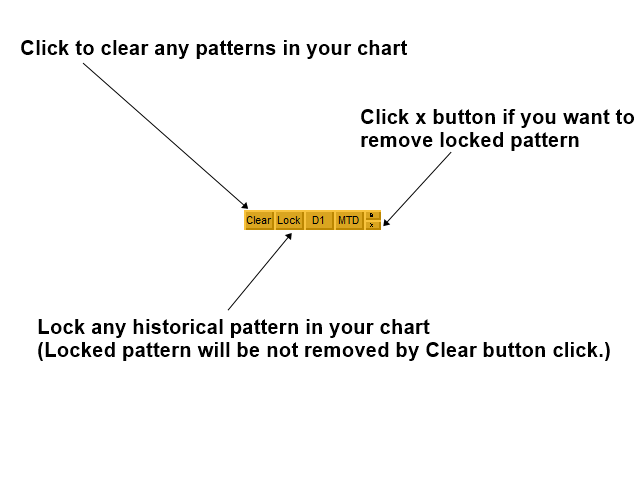
- Pattern Locking and Unlocking Feature
- Interactive Stop Loss and Take Profit according to your Reward/Risk ratio
- Historical Patterns
- Can detect around 52 Japanese candlestick patterns
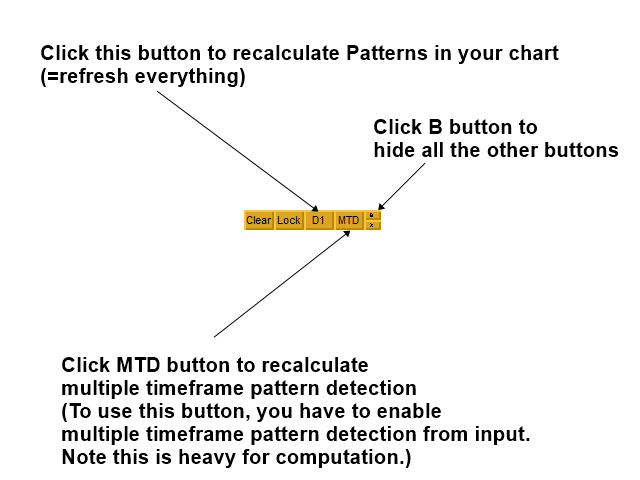
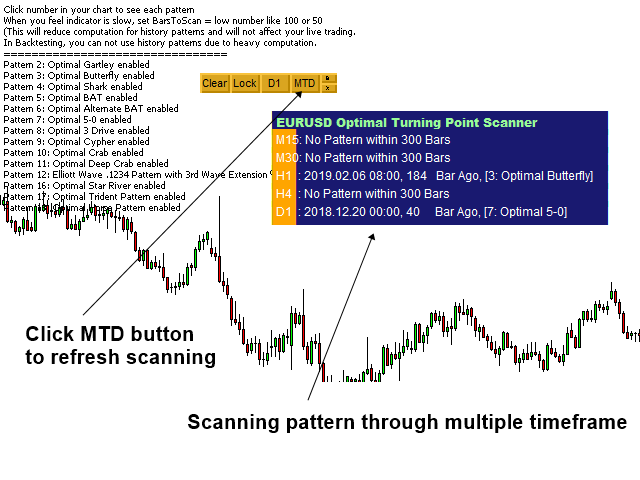
- Multiple Timeframe Pattern Scanning for Harmonic pattern, Elliott Wave pattern, and X3 Pattern
Entry and Exit for Trading
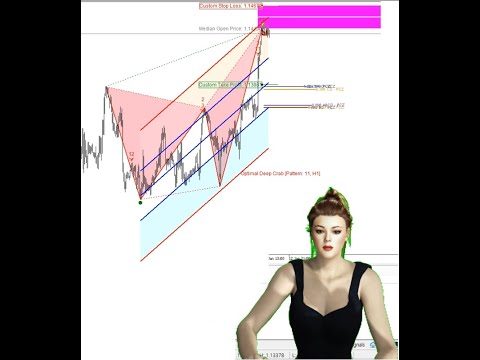
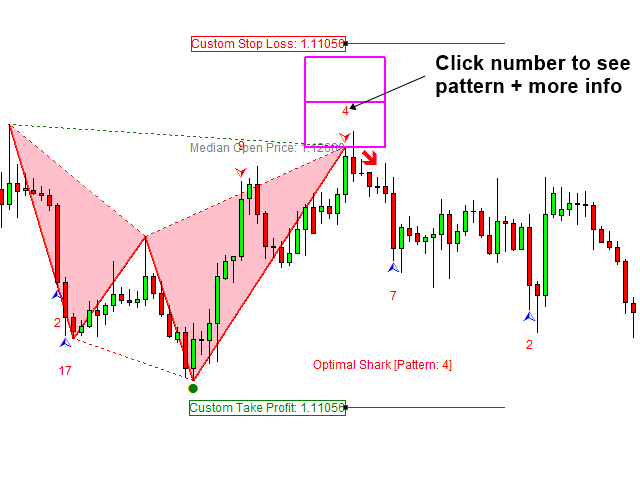
This indicator provides three essential components to trade and manage the trading risk including pattern completion interval, potential reversal zone and potential continuation zone. Provided stop loss and take profit levels are movable and adjustable. Potential reversal zone can be used to identify the location of turning point. Potential continuation zone can be used to predict future price move after turning point detection. Pattern Completion Interval is the tactical place where you can set breakeven, or trail stop your profit or to open new entry according to the market condition.
Secondary confirmation
Any experienced trader will recommend using secondary confirmation together with X3 chart patterns. Depending on your skill, you can combine various secondary confirmation technique with X3 Chart Pattern Scanner.
- Other technical indicators (i.e. RSI, CCI, MACD, etc)
- Supply Demand Analysis
- Fundamental analysis
- Elliott Wave Analysis
- Triangle pattern, rising wedge and falling wedge patterns
Trading Strategy Guide
Detailed trading strategy can be found from the link below. We highly recommend reading this guide before using this indicator.
https://www.mql5.com/en/blogs/post/750344
https://www.mql5.com/en/blogs/post/750343
Important Note
X3 Chart Pattern Scanner provides many good patterns. However, use the patterns you like only as each pattern in the scanner can be switched on and off. This indicator is testable in strategy tester up to 80% of its features. Please test it before purchasing. This is the off the shelf product. Therefore, we do not accept any modification or customization request on this product. In addition, we do not provide any code library or any support for your coding for this product.


I've tried so many pattern but Author pattern scanner is really top notch quality product, deserved more than 5 stars!