Smart Stochastic Divergence Detector
- 지표
- 버전: 2.7
- 활성화: 5
Stochastic Divergence Detection Indicator for MetaTrader 5
Overview
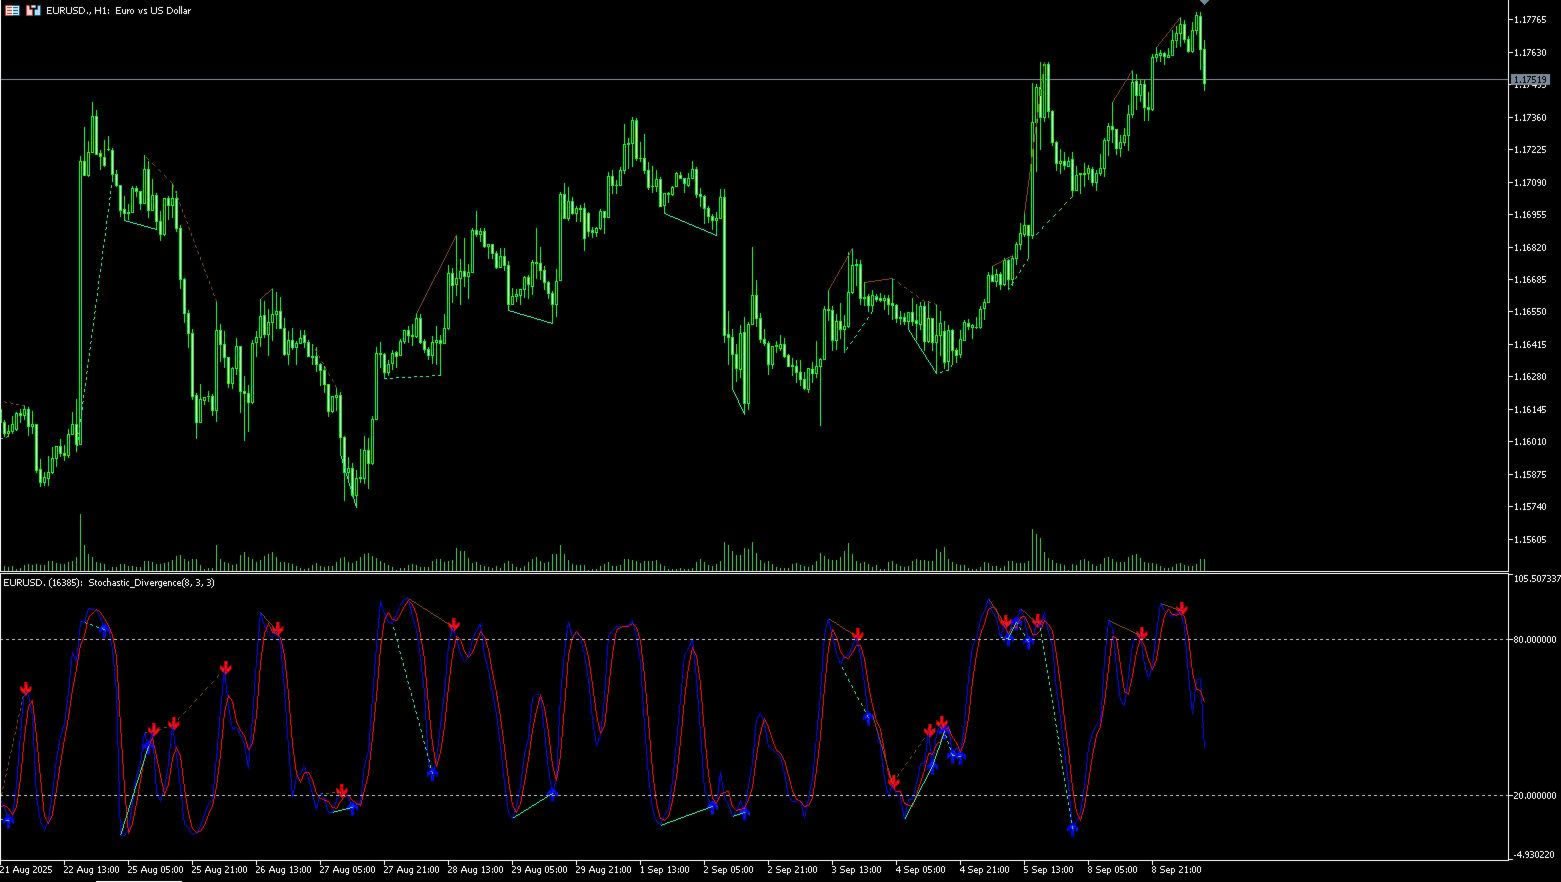
Smart Stochastic Divergence Detector is a technical analysis indicator designed to identify bullish and bearish divergence conditions between price action and the Stochastic oscillator.
The indicator supports:
- Regular divergence detection
- Hidden divergence detection
- Trendline visualization
- Signal marking
- Configurable alerts
- Multi-timeframe operation
It is intended for traders using momentum-based and divergence-based technical analysis workflows.
Main Features
Divergence Detection
The indicator detects:
- Regular bullish divergence
- Regular bearish divergence
- Hidden bullish divergence
- Hidden bearish divergence
Signals are generated based on the relationship between price structure and Stochastic oscillator movement.
Visual Signal Display
Detected divergence conditions are displayed directly on the chart using:
- Directional arrows
- Price trendlines
- Oscillator trendlines
Visualization settings can be customized independently.
Multi-Timeframe Support
The indicator supports:
- Current chart timeframe calculations
- Custom timeframe selection
- Higher timeframe analysis
This allows divergence monitoring across different market structures.
Alert System
Optional notifications are supported for divergence detection events.
Available Alert Types:
- Pop-up alerts
- Sound notifications
Alerts can be enabled or disabled through the input settings.
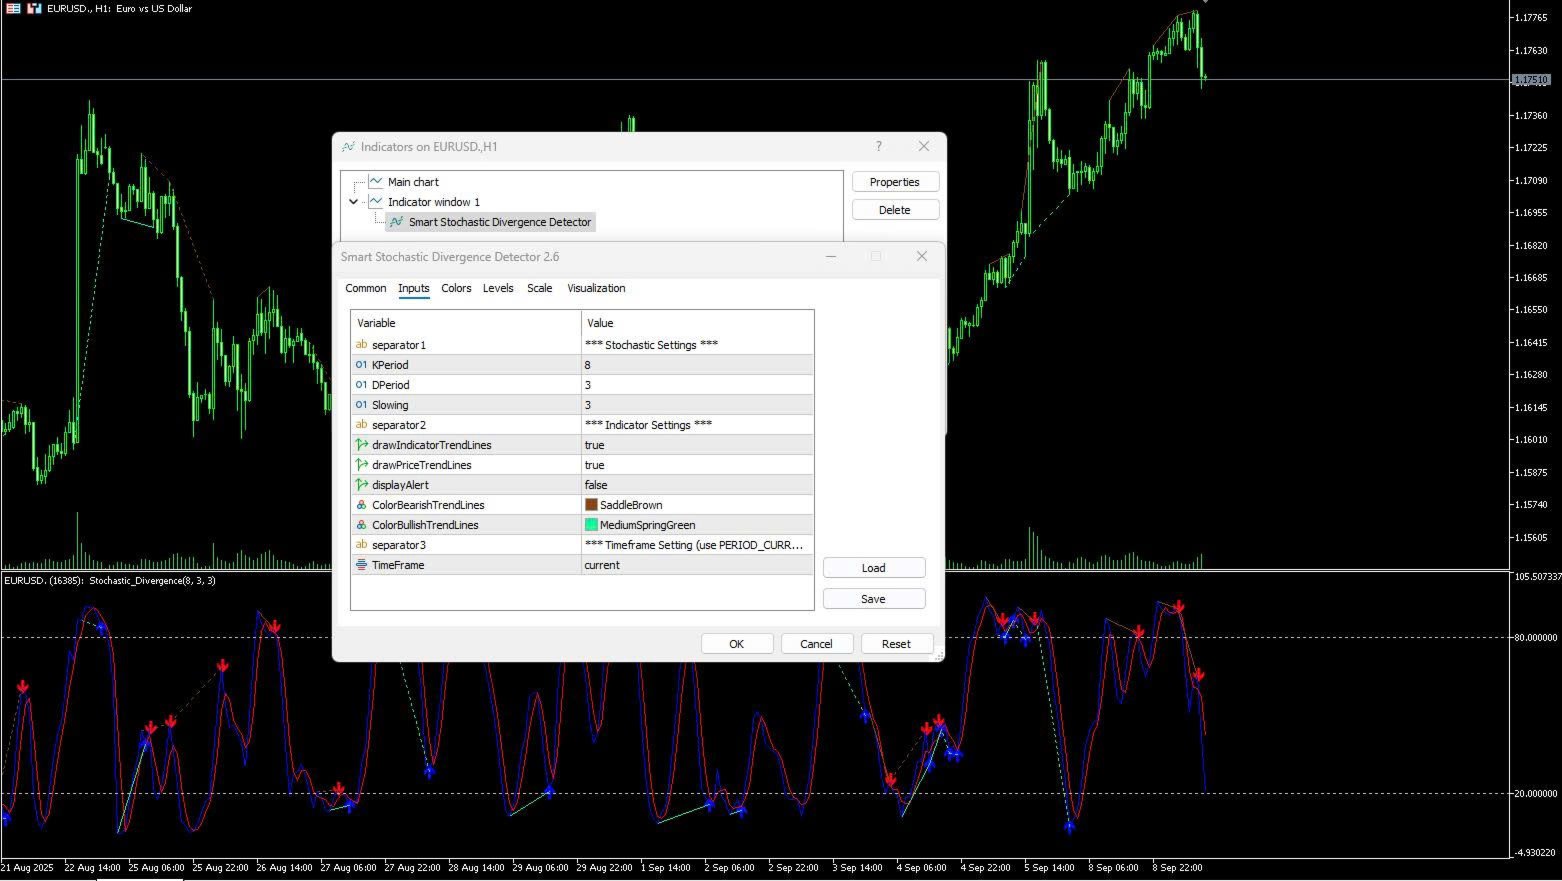
Input Parameters
Stochastic Settings
- KPeriod
- DPeriod
- Slowing
Visualization Settings
- Draw Price Trendlines
- Draw Indicator Trendlines
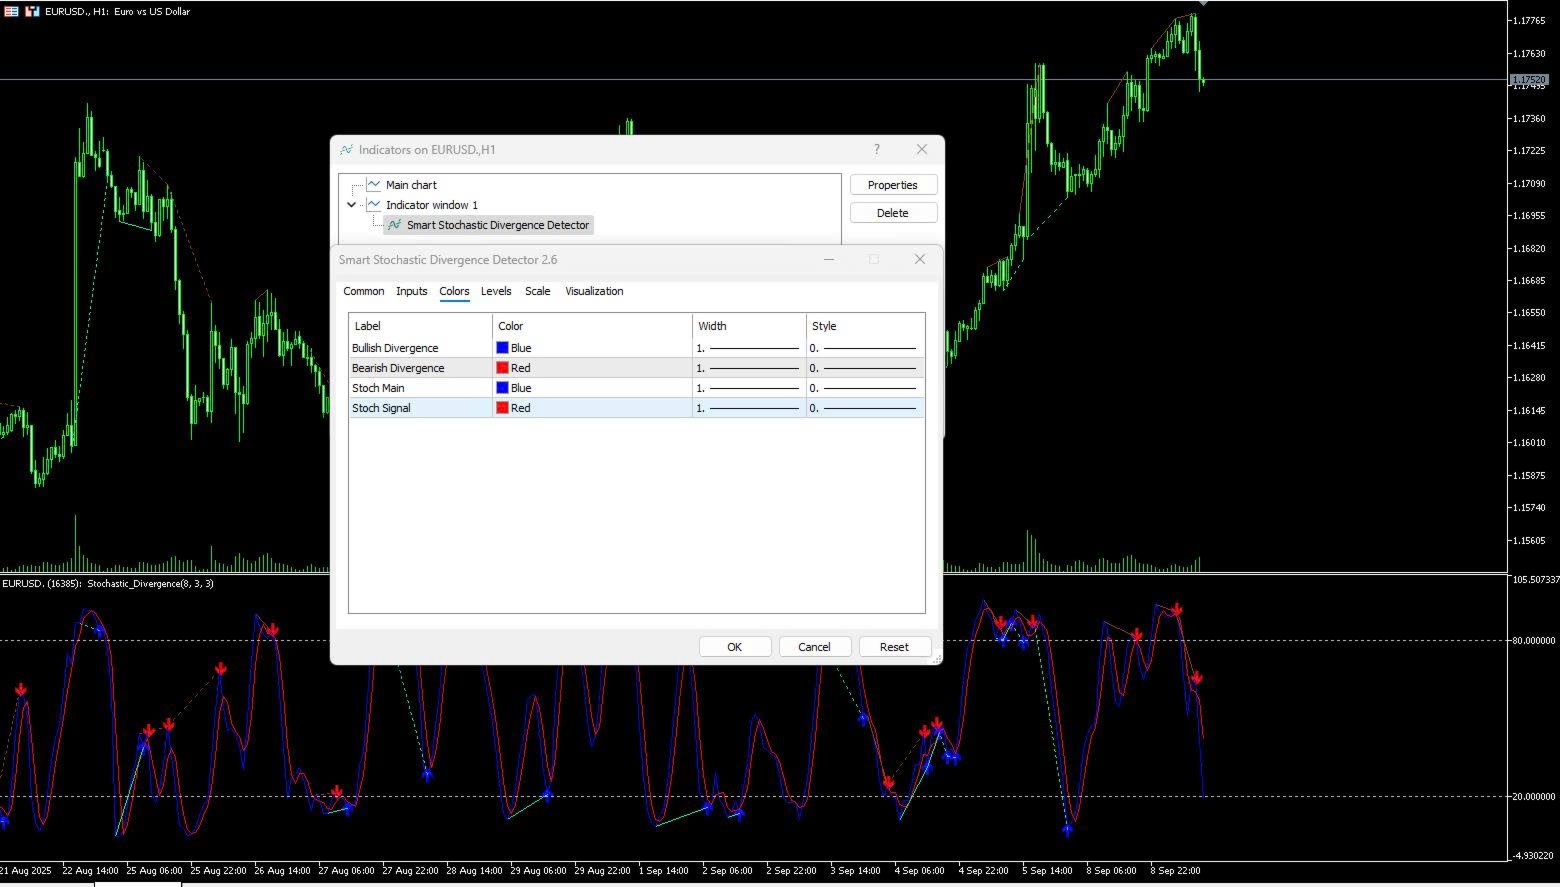
- Bullish/Bearish color configuration
- Alert activation
Timeframe Settings
- PERIOD_CURRENT
- Custom timeframe selection
These parameters allow the indicator to be adjusted according to different trading styles and timeframe preferences.
Usage Applications
The indicator may be used for:
- Momentum analysis
- Divergence monitoring
- Trend continuation observation
- Reversal structure analysis
- Multi-timeframe confirmation workflows
It can also be combined with:
- Support and resistance analysis
- Price action methods
- Trend-following systems
- Oscillator confirmation techniques
Compatibility
Platform:
- MetaTrader 5
Supported Markets:
- Forex
- Indices
- Stocks
- Commodities
- Cryptocurrency
Supported Timeframes:
- M1 to MN1
The indicator is designed for lightweight operation across multiple chart environments.
Operational Notes
General Recommendations:
- Test settings according to instrument volatility
- Use additional confirmation methods where appropriate
- Higher timeframes may produce fewer but structurally larger divergence patterns
Indicator behavior may vary depending on market conditions and parameter configuration.
Conclusion
Smart Stochastic Divergence Detector is a stochastic divergence analysis indicator designed for:
- Divergence visualization
- Momentum analysis
- Multi-timeframe observation
- Technical chart analysis workflows
The indicator provides configurable divergence detection and visual analysis tools for traders using oscillator-based technical analysis.
Suggested Tags
Stochastic Indicator, Divergence Indicator, MT5 Indicator, Momentum Analysis, Hidden Divergence, Technical Analysis, Forex Indicator, Swing Trading, Oscillator, MetaTrader 5