
포인트 앤 피겨 차트 지표
소개
현재 시장 상황에 대한 정보를 제공하는 차트 유형이 많이 있습니다. 점 및 도형 차트와 같은 많은 것들은 먼 과거의 유산입니다.
이 차트 유형은 XIX 세기 말부터 알려졌습니다. 이것은 Charles Dow가 1901년 7월 20일에 쓴 그의 월스트리트 저널 사설에서 처음 언급했으며 그는 그것을 "책" 방식이라고 명명했습니다. 그리고 Dow는 1886년까지 "장부" 방법을 언급했지만 오늘날까지 공식적으로 사용을 중단한 첫 번째 사람입니다.
Dow가 사설에서만 이 방법을 설명했음에도 불구하고 이제 이 방법에 대한 세부 정보를 제공하는 많은 책을 찾을 수 있습니다. 초보 거래자에게 추천하고 싶은 책 중 하나는 Thomas J. Dorsey의 "Point and Figure Charting: Essential Application for Forecasting and Tracking Market Rates"입니다.
설명
점 및 그림 차트는 수직 열 세트입니다. X 열은 상승 가격이고 O 열은 하락 가격입니다. 시간이 아닌 가격 움직임을 기준으로 플롯된다는 점에서 독특합니다. 따라서 차트 데이터(시간)에서 하나의 값을 제거하면 45도 각도로 그려진 추세선이 있는 차트를 얻을 수 있습니다.
점 및 그림 차트는 미리 정의된 두 가지 값을 사용하여 그려집니다.
- 박스 크기는 X 또는 O를 추가하는 데 필요한 가격 변동의 양입니다(원래 값은 주당 달러의 양으로 표시되었지만 시간이 지남에 따라 포인트로 발전하여 우리가 사용할 것입니다. 우리 지표에서).
- 반환 금액은 열을 X에서 O로 또는 그 반대로 변경하는 데 필요한 상자 크기 단위로 표시된 가격 반전 금액입니다(예: 반전 금액 3 및 상자 크기 10포인트는 30포인트에 해당합니다. ).
따라서 가격이 상자 크기에 반전 금액을 곱한 값만큼 가격이 변경된 경우 시작점을 선택하고 가격 인상에 대해 X를, 하락에 대해 O를 표시합니다. 또한 가격이 Box Size에 따라 동일한 방향으로 계속 움직이면 상승을 위해 X 열 상단에 X를 추가하고 하락을 위해 O 열 하단에 O를 각각 추가합니다. 가격이 상자 크기에 반전 금액을 곱한 값만큼 반대 방향으로 움직인 경우 가격 상승에 대해 X를 표시하거나 가격 하락에 대해 O를 표시하여 X의 새 열을 시작하거나 각각 O의 새 열입니다.
편의상 Point and Figure 차트는 일반적으로 체크 무늬 종이에 그려집니다. 더 나은 이해를 위해 점 및 그림 차트의 작은 예를 검토해 보겠습니다. 다음 데이터가 있다고 가정합니다.
| 날짜 | 높은 가격 | 저렴한 가격 |
|---|---|---|
| 07.03.2013 12:00 - 07.03.2013 20:00 | 1.3117 | 1.2989 |
| 07.03.2013 20:00 - 08.03.2013 04:00 | 1.3118 | 1.3093 |
| 08.03.2013 04:00 - 08.03.2013 12:00 | 1.3101 | 1.3080 |
| 08.03.2013 12:00 - 08.03.2013 20:00 | 1.3134 | 1.2955 |
Box Size가 10이고 Reversal Amount가 3인 경우 Point and Figure 차트를 플로팅합니다.
- 처음에는 가격이 1.2989에서 1.3117로 128포인트 증가하여 12개의 X를 그립니다.
- 그런 다음 가격은 1.3118에서 1.3093으로 25포인트 떨어집니다. 이는 반전에 충분하지 않으므로 그대로 둡니다.
- 또한 가격이 1.3080까지 계속 떨어지는 것을 볼 수 있습니다. 이전 값인 1.3118이 주어지면 이제 38포인트만큼 변경되었으므로 두 개의 O를 추가하여 새 열을 시작할 수 있습니다. 항상 한 상자 크기를 작게 시작합니다).
- 그런 다음 가격은 1.3080에서 1.3134로 54포인트 상승한 후 179포인트인 1.2955로 떨어집니다. 따라서 다음 열은 4개의 X로 구성되고 16개의 O로 구성된 O 열이 뒤따릅니다.
아래에 묘사된 것을 봅시다.

그림 1. 일본 촛대 차트(왼쪽) 및 점 및 그림 차트(오른쪽).
위의 점 및 그림 차트 예제는 매우 대략적이며 초보자가 개념을 더 잘 이해할 수 있도록 여기에 제공됩니다.
차팅 원리
몇 가지 Point and Figure 차트 기술이 있으며 그 중 하나는 이미 위에서 설명했습니다. 이러한 차트 작성 기술은 사용하는 데이터가 다릅니다. 예를 들어, 일중 움직임을 고려하지 않고 일일 데이터를 사용하여 대략적인 플롯을 얻을 수 있습니다. 또는 더 상세하고 부드러운 플롯을 얻기 위해 일중 가격 변동 데이터를 고려할 수 있습니다.
보다 부드럽고 정확한 Point and Figure 차트 작성을 위해 1분 동안의 가격 변동은 그다지 중요하지 않고 일반적으로 최대 6포인트이며 2~3포인트는 그닥 특이하지 때문에 계산 및 차트 작성을 위해 분 데이터를 사용하기로 결정했습니다. 따라서 매분 바의 시가 데이터를 사용합니다.
차트 작성 원칙 자체는 매우 간단합니다.
- 우리는 시작점, 즉 첫 번째 분 바의 시작가를 취합니다.
- 또한 가격이 상자 크기에 반전 금액을 곱한 거리만큼 이동하는 경우 각각의 기호를 그립니다(하향 이동은 O, 상승 이동은 X). 마지막 기호 가격에 대한 데이터는 추가 차트 작성을 위해 저장됩니다.
- 같은 방향으로 Box Size만큼 가격이 움직일 경우 해당 심볼이 그려집니다.
- 또한 가격 반전의 경우 해당 쌍의 최고 가격이 아닌 마지막 기호의 가격을 기준으로 계산됩니다. 즉, 가격 변동이 Box Size의 50%를 넘지 않으면 그냥 무시됩니다.
이제 Point and Figure 차트 스타일을 결정합시다. MQL5 언어는 선, 섹션(세그먼트), 히스토그램, 화살표(기호), 채워진 영역(채워진 채널), 바 및 일본 촛대와 같은 7가지 지표 플로팅 스타일을 지원합니다.
화살표(기호)는 이상적인 시각적 표현에 완벽하지만 이 스타일에는 모든 단일 X 또는 열의 O에는 별도의 지표 버퍼가 필요합니다. 즉, 이 스타일을 사용하기로 결정했다면 변동성을 정의하고 메모리 리소스가 충분해야 합니다.
그래서 우리는 일본 촛대를 차트 스타일, 정확히는 색깔의 일본 촛대로 결정했습니다. X의 열과 O의 열을 구별하기 위해 다른 색상을 사용해야 합니다. 따라서 지표는 5개의 버퍼만 필요하므로 사용 가능한 리소스를 효율적으로 사용할 수 있습니다.
열은 수평선을 사용하여 상자 크기로 나뉩니다. 결과는 꽤 괜찮습니다.
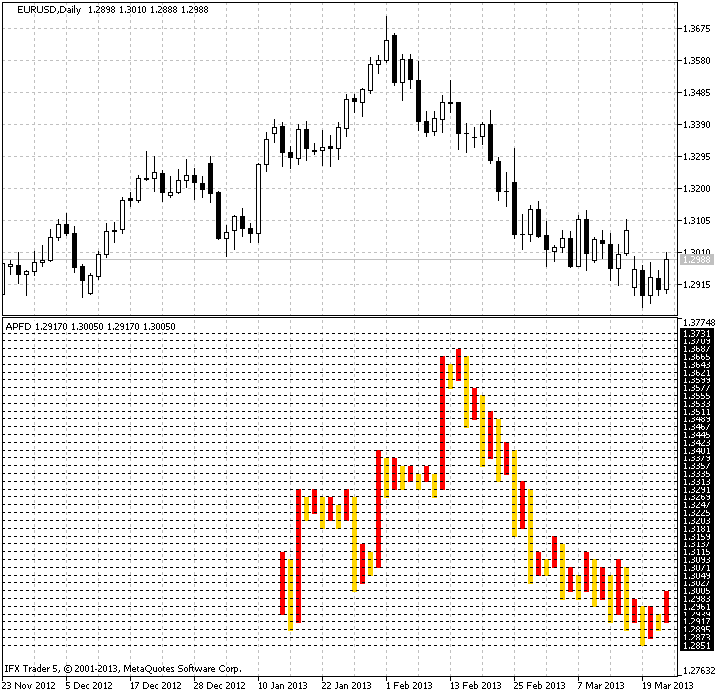
그림 2. 일일 시간대의 EURUSD 표시를 사용하여 차트를 작성합니다.
지표의 알고리즘
먼저 지표의 입력 매개변수를 결정해야 합니다. Point and Figure 차트는 시간을 고려하지 않고 분 바부터 표시하는 데이터를 사용하므로 시스템 리소스를 불필요하게 사용하지 않도록 처리할 데이터의 양을 결정해야 합니다. 또한 전체 이력을 사용하여 점 및 그림 차트를 그리는 것은 의미가 없습니다. 그래서 첫 번째 매개변수인 History를 소개합니다. 계산을 위해 분 바의 수를 고려합니다.
또한 Box Size와 Reversal Amount를 결정해야 합니다. 이를 위해 Cell 및 CellForChange 변수를 각각 소개합니다. 또한 X의 경우 ColorUp 및 O의 경우 ColorDown에 대한 색상 매개변수를 가져올 것입니다. 마지막으로 마지막 매개변수는 라인 색상 - LineColor입니다.
// +++ Program start +++
//+------------------------------------------------------------------+
//|                                                         APFD.mq5 |
//|                                            Aktiniy ICQ:695710750 |
//|                                                    ICQ:695710750 |
//+------------------------------------------------------------------+
#property copyright "Aktiniy ICQ:695710750"
#property link      "ICQ:695710750"
#property version   "1.00"
//--- Indicator plotting in a separate window
#property indicator_separate_window
#property indicator_buffers 5
#property indicator_plots   1
//--- plot Label1
#property indicator_label1  "APFD"
#property indicator_type1   DRAW_COLOR_CANDLES
#property indicator_style1  STYLE_SOLID
#property indicator_color1  clrRed,clrGold
#property indicator_width1  1
//--- Set the input parameters
input int   History=10000;
input int   Cell=5;
input int   CellForChange=3;
input color ColorUp=clrRed;
input color ColorDown=clrGold;
input color LineColor=clrAqua;
//--- Declare indicator buffers
double CandlesBufferOpen[];
double CandlesBufferHigh[];
double CandlesBufferLow[];
double CandlesBufferClose[];
double CandlesBufferColor[];
//--- Array for copying calculation data from the minute bars
double OpenPrice[];
// Variables for calculations
double PriceNow=0;
double PriceBefore=0;
//--- Introduce auxiliary variables
char   Trend=0;      // Direction of the price trend
double BeginPrice=0; // Starting price for the calculation
char   FirstTrend=0; // Direction of the initial market trend
int    Columns=0;    // Variable for the calculation of columns
double InterimOpenPrice=0;
double InterimClosePrice=0;
double NumberCell=0; // Variable for the calculation of cells
double Tick=0;       // Tick size
double OldPrice=0;   // Value of the last calculation price
//--- Create arrays to temporary store data on column opening and closing prices
double InterimOpen[];
double InterimClose[];
// +++ Program start +++
이제 OnInit() 함수를 살펴보겠습니다. 이제 OnInit() 함수를 살펴보겠습니다. 우리는 또한 더 정확한 표시를 위해 렌더링하지 않고 지표의 값을 설정하고
계산을 위한 보조 변수 Tick(한 틱의 크기)의 값을 계산합니다. 또한 지표 버퍼의 색 구성표와 인덱싱 순서를 시계열로 설정합니다. 이는 지표의 값을 편리하게 계산하기 위해 필요합니다.
// +++ The OnInit function +++
//+------------------------------------------------------------------+
//| Custom indicator initialization function                         |
//+------------------------------------------------------------------+
int OnInit()
  {
//--- indicator buffers mapping
   SetIndexBuffer(0,CandlesBufferOpen,INDICATOR_DATA);
   SetIndexBuffer(1,CandlesBufferHigh,INDICATOR_DATA);
   SetIndexBuffer(2,CandlesBufferLow,INDICATOR_DATA);
   SetIndexBuffer(3,CandlesBufferClose,INDICATOR_DATA);
   SetIndexBuffer(4,CandlesBufferColor,INDICATOR_COLOR_INDEX);
//--- Set the value of the indicator without rendering
   PlotIndexSetDouble(0,PLOT_EMPTY_VALUE,0);
//--- Calculate the size of one tick
   Tick=SymbolInfoDouble(Symbol(),SYMBOL_TRADE_TICK_SIZE);
//--- Set the color scheme
   PlotIndexSetInteger(0,PLOT_LINE_COLOR,0,ColorUp);
   PlotIndexSetInteger(0,PLOT_LINE_COLOR,1,ColorDown);
//--- Set the indexing order in arrays as time series
   ArraySetAsSeries(CandlesBufferClose,true);
   ArraySetAsSeries(CandlesBufferColor,true);
   ArraySetAsSeries(CandlesBufferHigh,true);
   ArraySetAsSeries(CandlesBufferLow,true);
   ArraySetAsSeries(CandlesBufferOpen,true);
//--- Check the input parameter for correctness
   if(CellForChange<2)
      Alert("The CellForChange parameter must be more than 1 due to plotting peculiarities");
//---
   return(0);
  }
// +++ The OnInit function +++
지표의 "핵심"인 OnCalculate() 함수에 도달하여 계산이 이루어집니다. 지표 값 계산은 OnCalculate()에서 호출되는 6개의 기본 함수로 나뉩니다. 그것들을 살펴봅시다:
1. 데이터 복사 기능
이 함수는 계산을 위해 분 바에서 배열로 데이터를 복사합니다. 먼저 수신 배열의 크기를 조정한 다음 CopyOpen() 함수를 사용하여 시작 가격을 복사합니다.
//+------------------------------------------------------------------+
//| Function for copying data for the calculation                    |
//+------------------------------------------------------------------+
int FuncCopy(int HistoryInt)
  {
//--- Resize the array for copying calculation data
   ArrayResize(OpenPrice,(HistoryInt));
//--- Copy data from the minute bars to the array
   int Open=CopyOpen(Symbol(),PERIOD_M1,0,(HistoryInt),OpenPrice);
//---
   return(Open);
  }
2. 컬럼 개수 계산 함수
이 함수는 점 및 그림 차트의 열 수를 계산합니다.
계산은 위의 함수에서 복사된 분 시간 프레임의 바 수를 반복하는 루프에서 수행됩니다. 루프 자체는 다양한 추세 유형에 대한 세 가지 주요 블록으로 구성됩니다.
- 0 - 무기한 추세입니다.
- 1 - 상승세.
- -1 - 하락세.
무한 추세는 초기 가격 움직임을 결정하는 데 한 번만 사용됩니다. 현재 시장과 초기 가격의 차액의 절대값이 Box Size에 Reversal Amount를 곱한 값을 초과할 때 가격 움직임의 방향이 결정됩니다.
하향 돌파가 있는 경우 초기 추세가 하향 추세로 식별되고 해당 항목이 Trend 변수에 만들어집니다. 상승 추세는 정반대의 방식으로 식별됩니다. 또한 열 수에 대한 변수인 ColumnsInt 값이 증가합니다.
현재 추세가 파악되면 각 방향에 대해 두 가지 조건을 설정합니다. 가격이 현재 추세 방향으로 Box Size만큼 계속 움직이면 ColumnsInt 변수 값은 그대로 유지됩니다. 가격이 Box Size에 Reversal Amount를 곱한 만큼 반전되면 새 열이 나타나고 ColumnsInt 변수 값이 1만큼 증가합니다.
모든 열이 식별될 때까지 계속됩니다.
루프의 셀 수를 반올림하기 위해 결과 값을 가장 가까운 정수로 반올림할 수 있는 MathRound() 함수를 사용할 것입니다. 선택적으로 필요한 플롯에 따라 이 함수는 MathFloor() 함수(가장 가까운 정수로 반올림) 또는 MathCeil() 함수(가장 가까운 정수로 반올림)로 대체될 수 있습니다.
//+------------------------------------------------------------------+
//| Function for calculating the number of columns                   |
//+------------------------------------------------------------------+
int FuncCalculate(int HistoryInt)
  {
   int ColumnsInt=0;

//--- Zero out auxiliary variables
   Trend=0;                 // Direction of the price trend
   BeginPrice=OpenPrice[0]; // Starting price for the calculation
   FirstTrend=0;            // Direction of the initial market trend
   Columns=0;               // Variable for the calculation of columns
   InterimOpenPrice=0;
   InterimClosePrice=0;
   NumberCell=0;            // Variable for the calculation of cells
//--- Loop for the calculation of the number of main buffers (column opening and closing prices)
   for(int x=0; x<HistoryInt; x++)
     {
      if(Trend==0 && (Cell*CellForChange)<fabs((BeginPrice-OpenPrice[x])/Tick))
        {
         //--- Downtrend
         if(((BeginPrice-OpenPrice[x])/Tick)>0)
           {
            NumberCell=fabs((BeginPrice-OpenPrice[x])/Tick)/Cell;
            NumberCell=MathRound(NumberCell);
            InterimOpenPrice=BeginPrice;
            InterimClosePrice=BeginPrice-(NumberCell*Cell*Tick);
            InterimClosePrice=NormalizeDouble(InterimClosePrice,Digits());
            Trend=-1;
           }
         //--- Uptrend
         if(((BeginPrice-OpenPrice[x])/Tick)<0)
           {
            NumberCell=fabs((BeginPrice-OpenPrice[x])/Tick)/Cell;
            NumberCell=MathRound(NumberCell);
            InterimOpenPrice=BeginPrice;
            InterimClosePrice=BeginPrice+(NumberCell*Cell*Tick);
            InterimClosePrice=NormalizeDouble(InterimClosePrice,Digits());
            Trend=1;
           }
         BeginPrice=InterimClosePrice;
         ColumnsInt++;
         FirstTrend=Trend;
        }
      //--- Determine further actions in case of the downtrend
      if(Trend==-1)
        {
         if(((BeginPrice-OpenPrice[x])/Tick)>0 && (Cell)<fabs((BeginPrice-OpenPrice[x])/Tick))
           {
            NumberCell=fabs((BeginPrice-OpenPrice[x])/Tick)/Cell;
            NumberCell=MathRound(NumberCell);
            InterimClosePrice=BeginPrice-(NumberCell*Cell*Tick);
            InterimClosePrice=NormalizeDouble(InterimClosePrice,Digits());
            Trend=-1;
            BeginPrice=InterimClosePrice;
           }
         if(((BeginPrice-OpenPrice[x])/Tick)<0 && (Cell*CellForChange)<fabs((BeginPrice-OpenPrice[x])/Tick))
           {
            ColumnsInt++;
            NumberCell=fabs((BeginPrice-OpenPrice[x])/Tick)/Cell;
            NumberCell=MathRound(NumberCell);
            InterimOpenPrice=BeginPrice+(Cell*Tick);
            InterimClosePrice=BeginPrice+(NumberCell*Cell*Tick);
            InterimClosePrice=NormalizeDouble(InterimClosePrice,Digits());
            Trend=1;
            BeginPrice=InterimClosePrice;
           }
        }
      //--- Determine further actions in case of the uptrend
      if(Trend==1)
        {
         if(((BeginPrice-OpenPrice[x])/Tick)>0 && (Cell*CellForChange)<fabs((BeginPrice-OpenPrice[x])/Tick))
           {
            ColumnsInt++;
            NumberCell=fabs((BeginPrice-OpenPrice[x])/Tick)/Cell;
            NumberCell=MathRound(NumberCell);
            InterimOpenPrice=BeginPrice-(Cell*Tick);
            InterimClosePrice=BeginPrice-(NumberCell*Cell*Tick);
            InterimClosePrice=NormalizeDouble(InterimClosePrice,Digits());
            Trend=-1;
            BeginPrice=InterimClosePrice;
           }
         if(((BeginPrice-OpenPrice[x])/Tick)<0 && (Cell)<fabs((BeginPrice-OpenPrice[x])/Tick))
           {
            NumberCell=fabs((BeginPrice-OpenPrice[x])/Tick)/Cell;
            NumberCell=MathRound(NumberCell);
            InterimClosePrice=BeginPrice+(NumberCell*Cell*Tick);
            InterimClosePrice=NormalizeDouble(InterimClosePrice,Digits());
            Trend=1;
            BeginPrice=InterimClosePrice;
           }
        }
     }
//---
   return(ColumnsInt);
  }
3. 칼럼 색칠 기능
이 기능은 사전 설정된 색 구성표를 사용하여 필요에 따라 열을 색칠하기 위한 것입니다. 이를 위해 초기 트렌드 값(초기 열)을 고려하여 열 수에 대해 반복하는 루프를 작성하고 적절한 색상을 짝수 및 홀수 열에 설정합니다.
//+------------------------------------------------------------------+
//| Function for coloring columns                                    |
//+------------------------------------------------------------------+
int FuncColor(int ColumnsInt)
  {
   int x;
//--- Fill the buffer of colors for drawing
   for(x=0; x<ColumnsInt; x++)
     {
      if(FirstTrend==-1)
        {
         if(x%2==0) CandlesBufferColor[x]=1; // All even buffers of color 1
         if(x%2>0) CandlesBufferColor[x]=0;  // All odd buffers of color 0
        }
      if(FirstTrend==1)
        {
         if(x%2==0) CandlesBufferColor[x]=0; // All odd buffers of color 0
         if(x%2>0) CandlesBufferColor[x]=1;  // All even buffers of color 1
        }
     }
//---
   return(x);
  }
4. 열 크기를 결정하는 함수
사용할 열의 수를 결정하고 필요한 색상을 설정했으면 열의 높이를 결정해야 합니다. 이를 위해 임시 배열인 InterimOpen[] 및 InterimClose[]를 생성합니다. 이러한 배열의 크기는 열 수와 같습니다.
그런 다음 FuncCalculate() 함수의 루프와 거의 완전히 동일한 루프를 갖게 됩니다. 차이점은 위의 모든 것과 별도로 각 항목의 시가와 종가도 저장한다는 점입니다. 열. 이 분리는 차트의 열 수를 미리 알기 위해 구현됩니다. 이론적으로 우리는 초기에 배열 메모리 할당을 위해 의도적으로 더 많은 수의 열을 설정할 수 있으며 하나의 루프로만 수행할 수 있습니다. 그러나 이 경우 메모리 리소스를 더 많이 사용하게 됩니다.
이제 열 높이를 결정하는 방법에 대해 자세히 살펴보겠습니다. 가격이 필요한 Box Size 수만큼 이동한 후 해당 수를 계산하여 가장 가까운 정수로 반올림합니다. 그런 다음 현재 열의 총 상자 크기 수를 열 시작 가격에 추가하여 열 닫는 가격을 얻습니다. 이 값도 마지막으로 사용한 가격이 됩니다. 모든 추가 조치에 포함될 것입니다.
//+------------------------------------------------------------------+
//| Function for determining the column size                         |
//+------------------------------------------------------------------+
int FuncDraw(int HistoryInt)
  {
//--- Determine the sizes of temporary arrays
   ArrayResize(InterimOpen,Columns);
   ArrayResize(InterimClose,Columns);
//--- Zero out auxiliary variables
   Trend=0;                 // Direction of the price trend
   BeginPrice=OpenPrice[0]; // Starting price for the calculation
   NumberCell=0;            // Variable for the calculation of cells
   int z=0;                 // Variable for indices of temporary arrays
//--- Loop for filling the main buffers (column opening and closing prices)
   for(int x=0; x<HistoryInt; x++)
     {
      if(Trend==0 && (Cell*CellForChange)<fabs((BeginPrice-OpenPrice[x])/Tick))
        {
         //--- Downtrend
         if(((BeginPrice-OpenPrice[x])/Tick)>0)
           {
            NumberCell=fabs((BeginPrice-OpenPrice[x])/Tick)/Cell;
            NumberCell=MathRound(NumberCell);
            InterimOpen[z]=BeginPrice;
            InterimClose[z]=BeginPrice-(NumberCell*Cell*Tick);
            InterimClose[z]=NormalizeDouble(InterimClose[z],Digits());
            Trend=-1;
           }
         //--- Uptrend
         if(((BeginPrice-OpenPrice[x])/Tick)<0)
           {
            NumberCell=fabs((BeginPrice-OpenPrice[x])/Tick)/Cell;
            NumberCell=MathRound(NumberCell);
            InterimOpen[z]=BeginPrice;
            InterimClose[z]=BeginPrice+(NumberCell*Cell*Tick);
            InterimClose[z]=NormalizeDouble(InterimClose[z],Digits()); // Normalize the number of decimal places
            Trend=1;
           }
         BeginPrice=InterimClose[z];
        }
      //--- Determine further actions in case of the downtrend
      if(Trend==-1)
        {
         if(((BeginPrice-OpenPrice[x])/Tick)>0 && (Cell)<fabs((BeginPrice-OpenPrice[x])/Tick))
           {
            NumberCell=fabs((BeginPrice-OpenPrice[x])/Tick)/Cell;
            NumberCell=MathRound(NumberCell);
            InterimClose[z]=BeginPrice-(NumberCell*Cell*Tick);
            InterimClose[z]=NormalizeDouble(InterimClose[z],Digits());
            Trend=-1;
            BeginPrice=InterimClose[z];
           }
         if(((BeginPrice-OpenPrice[x])/Tick)<0 && (Cell*CellForChange)<fabs((BeginPrice-OpenPrice[x])/Tick))
           {
            z++;
            NumberCell=fabs((BeginPrice-OpenPrice[x])/Tick)/Cell;
            NumberCell=MathRound(NumberCell);
            InterimOpen[z]=BeginPrice+(Cell*Tick);
            InterimClose[z]=BeginPrice+(NumberCell*Cell*Tick);
            InterimClose[z]=NormalizeDouble(InterimClose[z],Digits());
            Trend=1;
            BeginPrice=InterimClose[z];
           }
        }
      //--- Determine further actions in case of the uptrend
      if(Trend==1)
        {
         if(((BeginPrice-OpenPrice[x])/Tick)>0 && (Cell*CellForChange)<fabs((BeginPrice-OpenPrice[x])/Tick))
           {
            z++;
            NumberCell=fabs((BeginPrice-OpenPrice[x])/Tick)/Cell;
            NumberCell=MathRound(NumberCell);
            InterimOpen[z]=BeginPrice-(Cell*Tick);
            InterimClose[z]=BeginPrice-(NumberCell*Cell*Tick);
            InterimClose[z]=NormalizeDouble(InterimClose[z],Digits());
            Trend=-1;
            BeginPrice=InterimClose[z];
           }
         if(((BeginPrice-OpenPrice[x])/Tick)<0 && (Cell)<fabs((BeginPrice-OpenPrice[x])/Tick))
           {
            NumberCell=fabs((BeginPrice-OpenPrice[x])/Tick)/Cell;
            NumberCell=MathRound(NumberCell);
            InterimClose[z]=BeginPrice+(NumberCell*Cell*Tick);
            InterimClose[z]=NormalizeDouble(InterimClose[z],Digits());
            Trend=1;
            BeginPrice=InterimClose[z];
           }
        }
     }
//---
   return(z);
  }
5. 배열 반전 기능
이 함수는 얻은 열 배열 데이터를 반전시켜 차트를 프로그래밍 방식으로 오른쪽에서 왼쪽으로 추가로 표시합니다. 배열 반전은 촛대에 할당된 High 및 Low 값과 함께 루프에서 수행됩니다. 배열 반전은 촛대에 할당된 High 및 Low 값과 함께 루프에서 수행됩니다.
//+------------------------------------------------------------------+
//| Function for array reversal                                      |
//+------------------------------------------------------------------+
int FuncTurnArray(int ColumnsInt)
  {
//--- Variable for array reversal
   int d=ColumnsInt;
   for(int x=0; x<ColumnsInt; x++)
     {
      d--;
      CandlesBufferOpen[x]=InterimOpen[d];
      CandlesBufferClose[x]=InterimClose[d];
      if(CandlesBufferClose[x]>CandlesBufferOpen[x])
        {
         CandlesBufferHigh[x]=CandlesBufferClose[x];
         CandlesBufferLow[x]=CandlesBufferOpen[x];
        }
      if(CandlesBufferOpen[x]>CandlesBufferClose[x])
        {
         CandlesBufferHigh[x]=CandlesBufferOpen[x];
         CandlesBufferLow[x]=CandlesBufferClose[x];
        }
     }
//---
   return(d);
  }
6. 가로선 그리기 기능
이 기능은 수평선(개체)을 사용하여 "상자"의 격자를 만듭니다. 함수 시작 시 계산 데이터 배열에서 최대 및 최소 가격 값을 결정합니다. 이 값은 시작점에서 위아래로 점차적으로 선을 그리는 데 사용됩니다.
//+------------------------------------------------------------------+
//| Function for drawing horizontal lines                            |
//+------------------------------------------------------------------+
int FuncDrawHorizontal(bool Draw)
  {
   int Horizontal=0;
   if(Draw==true)
     {
      //--- Create horizontal lines (lines for separation of columns)
      ObjectsDeleteAll(0,ChartWindowFind(),OBJ_HLINE); // Delete all old horizontal lines
      int MaxPriceElement=ArrayMaximum(OpenPrice);     // Determine the maximum price level
      int MinPriceElement=ArrayMinimum(OpenPrice);     // Determine the minimum price level
      for(double x=OpenPrice[0]; x<=OpenPrice[MaxPriceElement]+(Cell*Tick); x=x+(Cell*Tick))
        {
         ObjectCreate(0,DoubleToString(x,Digits()),OBJ_HLINE,ChartWindowFind(),0,NormalizeDouble(x,Digits()));
         ObjectSetInteger(0,DoubleToString(x,Digits()),OBJPROP_COLOR,LineColor);
         ObjectSetInteger(0,DoubleToString(x,Digits()),OBJPROP_STYLE,STYLE_DOT);
         ObjectSetInteger(0,DoubleToString(x,Digits()),OBJPROP_SELECTED,false);
         ObjectSetInteger(0,DoubleToString(x,Digits()),OBJPROP_WIDTH,1);
         Horizontal++;
        }
      for(double x=OpenPrice[0]-(Cell*Tick); x>=OpenPrice[MinPriceElement]; x=x-(Cell*Tick))
        {
         ObjectCreate(0,DoubleToString(x,Digits()),OBJ_HLINE,ChartWindowFind(),0,NormalizeDouble(x,Digits()));
         ObjectSetInteger(0,DoubleToString(x,Digits()),OBJPROP_COLOR,LineColor);
         ObjectSetInteger(0,DoubleToString(x,Digits()),OBJPROP_STYLE,STYLE_DOT);
         ObjectSetInteger(0,DoubleToString(x,Digits()),OBJPROP_SELECTED,false);
         ObjectSetInteger(0,DoubleToString(x,Digits()),OBJPROP_WIDTH,1);
         Horizontal++;
        }
      ChartRedraw();
     }
//---
   return(Horizontal);
  }
이제 모든 기본 함수를 설명했으므로 OnCalculate()에서 호출되는 순서를 살펴보겠습니다.
- 계산을 위한 데이터 복사 기능을 시작합니다(아직 계산된 바가 없는 경우).
- 열 수를 계산하는 함수를 호출합니다.
- 열 색상을 결정합니다.
- 열 크기를 결정합니다.
- 배열에서 데이터 반전을 위한 함수를 호출합니다.
- 열을 "상자"로 나누는 수평선을 그리는 함수를 호출합니다.
// +++ Main calculations and plotting +++
//+------------------------------------------------------------------+
//| Custom indicator iteration function                              |
//+------------------------------------------------------------------+
int OnCalculate(const int rates_total,
                const int prev_calculated,
                const datetime &time[],
                const double &open[],
                const double &high[],
                const double &low[],
                const double &close[],
                const long &tick_volume[],
                const long &volume[],
                const int &spread[])
  {
//--- Reverse the array to conveniently get the last price value
   ArraySetAsSeries(close,true);
//---
   if(prev_calculated==0)
     {
      //--- Start the function for copying data for the calculation
      int ErrorCopy=FuncCopy(History);
      //--- In case of error, print the message
      if(ErrorCopy==-1)
        {
         Alert("Failed to copy. Data is still loading.");
         return(0);
        }
      //--- Call the function for calculating the number of columns
      Columns=FuncCalculate(History);
      //--- Call the function for coloring columns
      int ColorCalculate=FuncColor(Columns);
      //--- Call the function for determining column sizes
      int z=FuncDraw(History);
      //--- Start the function for array reversal
      int Turn=FuncTurnArray(Columns);
      //--- Start the function for drawing horizontal lines
      int Horizontal=FuncDrawHorizontal(true);
      //--- Store the value of the last closing price in the variable
      OldPrice=close[0];
     }
//--- If the price is one box size different from the previous one,
//--- the indicator is recalculated
   if(fabs((OldPrice-close[0])/Tick)>Cell)
      return(0);
//--- return value of prev_calculated for next call
   return(rates_total);
  }
// +++ Main calculations and plotting +++
그것이 지표의 핵심 코드의 끝입니다. 그러나 지표는 복잡한 배열을 포함하는 단점이 있기 때문에 때때로 다시 로드해야 합니다.
이를 구현하기 위해 "С" 키를 누르는 이벤트를 처리하는 OnChartEvent() 함수를 사용합니다. "R" 키 - 다시 그리기. 지우기 위해 지표 버퍼 중 하나에 0 값이 할당됩니다. 차트 다시 그리기 기능은 이전 계산의 반복과 지표 버퍼에 대한 값 할당을 나타냅니다.
// +++ Secondary actions for the "С" key - clear and the "R" key - redraw +++
//+------------------------------------------------------------------+
//| ChartEvent function                                              |
//+------------------------------------------------------------------+
void OnChartEvent(const int id,
                  const long &lparam,
                  const double &dparam,
                  const string &sparam)
  {
//---
   if(id==CHARTEVENT_KEYDOWN)
     {
      //--- 67 - The "C" key code clears the indicator buffer
      if(lparam==67)
        {
         for(int x=0; x<Bars(Symbol(),PERIOD_CURRENT); x++)
            CandlesBufferOpen[x]=0;
         ChartRedraw();
        }
      // 82 - The "R" key code redraws the indicator
      if(lparam==82)
        {
         //--- Start the copying function
         int ErrorCopy=FuncCopy(History);
         //--- In case of error, print the message
         if(ErrorCopy==-1)
            Alert("Failed to copy data.");
         //--- Call the function for calculating the number of columns
         Columns=FuncCalculate(History);
         //--- Call the function for coloring columns
         int ColorCalculate=FuncColor(Columns);
         //--- Call the function for determining column sizes
         int z=FuncDraw(History);
         //--- Start the function for array reversal
         int Turn=FuncTurnArray(Columns);
         //--- Start the function for drawing horizontal lines
         int Horizontal=FuncDrawHorizontal(true);
        }
     }
  }
//+------------------------------------------------------------------+
// +++ Secondary actions for the "С" key - clear and the "R" key - redraw +++
이제 알고리즘 및 지표 코드에 대한 설명을 마치면서 심호흡을 할 수 있으며 거래 실행을 위한 신호를 생성하는 몇 가지 포인트 및 그림 차트 패턴을 살펴볼 수 있습니다.
표준 신호
포인트 및 피겨 차트를 거래하고 분석하는 데에는 패턴 기반과 지지선 및 저항선 기반의 두 가지 접근 방식이 있습니다. 후자는 지지선과 저항선이 45도의 각도로 표시된다는 점에서 특이합니다 (이것은 주 차트의 크기에 따라 크기가 달라지는 일본어 촛대를 사용하여 도표화되기 때문에 각도가 왜곡될 수 있으므로 설계된 지표에서 항상 그렇지는 않습니다).
이제 다음과 같은 패턴을 고려해 보겠습니다.
-
"이중 상단" 및 "이중 하단" 패턴.
"Double Top"은 가격이 상승한 다음 O의 특정 열을 형성하고 하락하고 다시 상승하여 X의 이전 열보다 하나의 Box Size를 초과할 때 발생합니다. 이 패턴은 매수 신호입니다.
"Double Bottom"은 "Double Top" 패턴의 정반대입니다. 특정 가격 하락(O 열) 다음에 X 열과 O 열의 이전 열보다 한 상자 아래로 떨어지는 또 다른 O 열이 있어 매도 신호를 형성합니다.
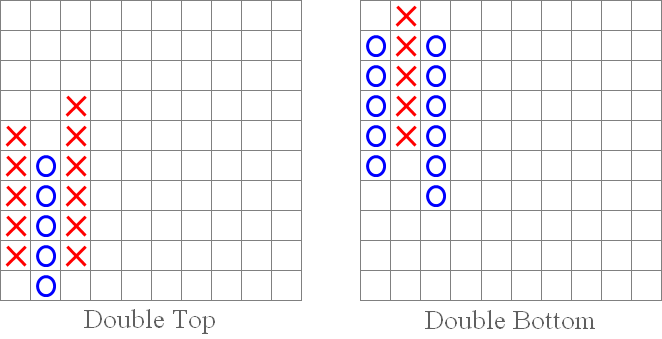
그림 3. "더블 탑" 및 "더블 바텀" 패턴.
-
"Triple Top" 및 "Triple Bottom" 패턴.
이러한 패턴은 덜 빈번하지만 매우 강력한 신호를 나타냅니다. 기본적으로 "Double Top" 및 "Double Bottom" 패턴과 유사하며 계속됩니다. 신호를 전달하기 전에 위의 두 패턴의 움직임을 반복합니다.
"트리플 탑"은 가격이 동일한 가격 수준에 두 번 도달한 다음 해당 수준 이상으로 돌파하여 매수 신호를 나타내는 경우 발생합니다.
"Triple Bottom" 패턴은 "Triple Top"과 반대이며 가격이 같은 수준으로 두 번 하락한 다음 해당 수준 아래로 돌파하여 매도 신호를 전달할 때 발생합니다.
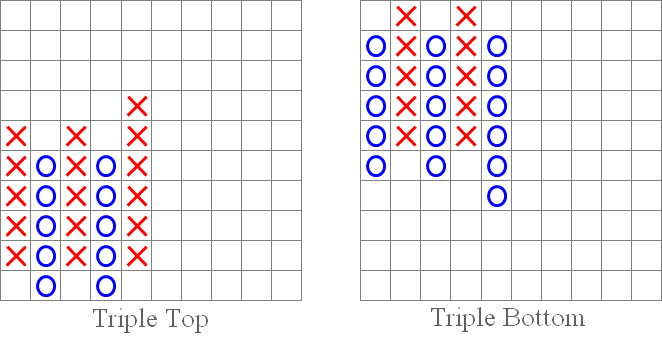
그림 4. "Triple Top" 및 "Triple Bottom" 패턴.
-
"대칭 삼각형 이탈" 패턴: 위아래.
우리 모두는 기술적 분석 패턴을 기억합니다. "Symmetrical Triangle Breakout" 패턴은 기술적 분석에서 "Symmetrical Triangle"과 유사합니다. 상향 돌파(아래 왼쪽 그림 참조)는 매수 신호입니다. 반대로, 하락 분석은 매도 신호입니다(오른쪽 그림).
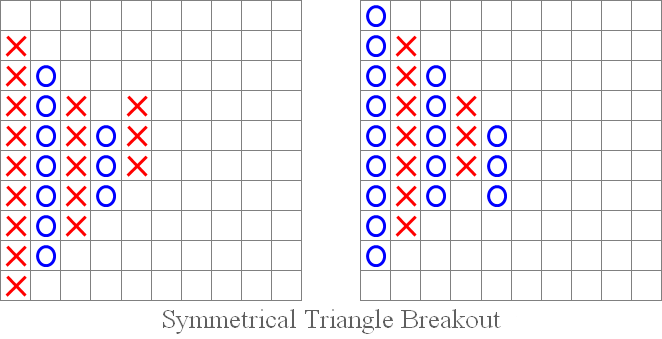
그림 5. "대칭 삼각형 탈주": 위아래.
-
"강세 투석기" 및 "약세 투석기" 패턴.
"투석기"는 기술적 분석의 "상승 삼각형" 및 "하강 삼각형" 패턴과 어떤 면에서 유사합니다. 그들의 신호는 본질적으로 유사합니다. 가격이 삼각형의 평행선 위 또는 아래로 떨어지면 각각 매수 또는 매도 신호가 발생합니다. "Bullish Catapult"의 경우 가격이 위에서 이탈하여 매수 신호(왼쪽 그림)이고, "Bearish Catapult"의 경우 가격이 아래에서 이탈하여 매도 신호( 오른쪽 그림).
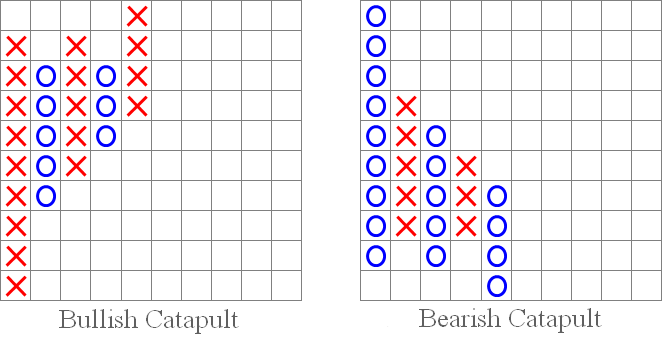
그림 6. "약세 투석기" 및 "약세 투석기" 패턴.
-
"45도 추세선" 패턴입니다.
"45도 추세선" 패턴은 지지선 또는 저항선을 만듭니다. 해당 라인이 이탈하면 매도 신호(오른쪽 그림 참조) 또는 매수 신호(왼쪽 그림 참조)가 발생합니다.
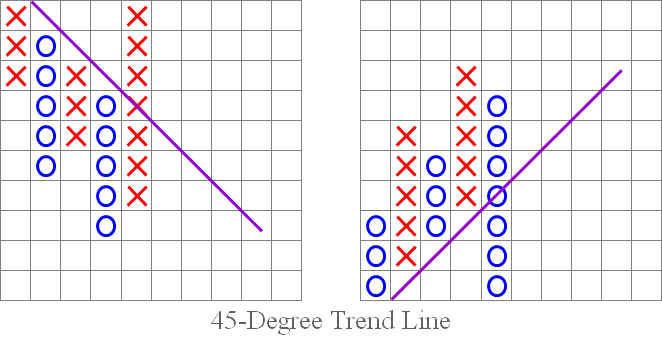
그림 7. "45도 추세선" 패턴입니다.
우리는 표준 점 및 그림 차트 패턴과 신호를 검토했습니다. 이제 글 시작 부분에 제공된 지표 차트에서 그 중 일부를 찾아보겠습니다.
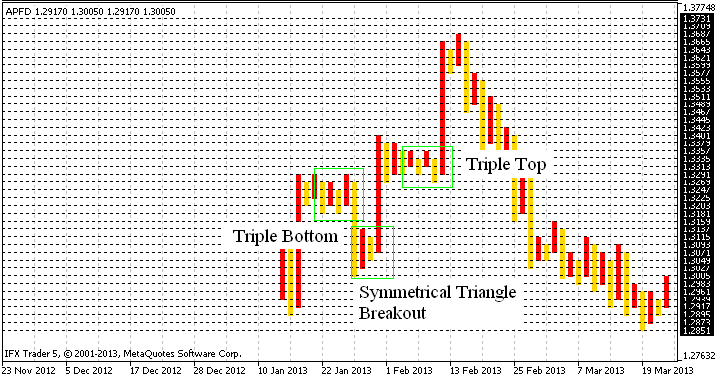
그림 8. 점 및 그림 차트에서 패턴 식별.
결론
우리는 글의 마지막 단계에 도달했습니다. Point and Figure 차트는 시간이 지나도 사라지지 않고 여전히 활발히 사용되고 있다는 점에서 그 가치를 다시 한 번 증명하고 있습니다.
개발된 지표는 일반적인 X 및 O 대신 블록 차트 작성 및 전략 테스터에서 테스트할 수 없음(또는 오히려 잘못된 작동)과 같은 단점이 없지만 매우 정확한 차트 결과를 산출합니다.
또한 이 알고리즘은 약간 수정된 버전으로 Renko 차트 작성과 메뉴 옵션이 있는 단일 코드의 두 차트 유형 통합에 잠재적으로 사용될 수 있습니다. 적절하게 선택합니다. 나는 메인 창에서 직접 차트를 그릴 가능성을 배제하지 않습니다. 다시 약간의 코드 수정이 필요할 것입니다.
일반적으로 이 글의 목적은 지표 개발에 대한 제 생각을 공유하는 것이었습니다. 이것이 내 첫 번째 글이므로 모든 의견이나 피드백에 감사드립니다. 제 글에 관심을 가져 주셔서 감사합니다!
MetaQuotes 소프트웨어 사를 통해 러시아어가 번역됨.
원본 기고글: https://www.mql5.com/ru/articles/656
경고: 이 자료들에 대한 모든 권한은 MetaQuotes(MetaQuotes Ltd.)에 있습니다. 이 자료들의 전부 또는 일부에 대한 복제 및 재출력은 금지됩니다.
이 글은 사이트 사용자가 작성했으며 개인의 견해를 반영합니다. Metaquotes Ltd는 제시된 정보의 정확성 또는 설명 된 솔루션, 전략 또는 권장 사항의 사용으로 인한 결과에 대해 책임을 지지 않습니다.
 MQL5 Coobook: 일반적인 차트 이벤트 처리
MT5에 대한 다른 P&F 지표를 알고 있습니까 (물론 무료!!) ??
https://www.mql5.com/ko/code/954
https://www.mql5.com/ko/articles/368
트레이딩, 자동매매 시스템 및 트레이딩 전략 테스트 포럼
보조지표 포인트 및 수치
뉴디지털, 2013.09.12 16:29
포인트 & 피겨 차트
포인트 & 피겨 차트는 차트에서 시간의 중요성을 줄이고 대신 가격 움직임에 초점을 맞춥니다. 포인트 & 피겨 차트는 X와 O로 구성되며, X는 새로운 고점이고 O는 새로운 저점입니다. 꺾은선형 차트에는 두 가지 입력값이 있습니다:
포인트 및 그림 차트의 주요 용도 중 하나이자 이 섹션에서 강조하는 것은 포인트 및 그림 차트를 사용하면 트레이더가 고전적인 차트 패턴을 더 쉽게 볼 수 있다는 것입니다. 아래 E-mini S&P 500 선물 차트에서 포인트 & 피겨 차트는 지지선과 저항선, 가격 돌파 구간을 강조했습니다:
다시 말하지만, 포인트 & 피겨 차트를 통해 트레이더는 E-mini S&P 500 선물 계약 차트에서 아래 이중 바닥 패턴을 쉽게 볼 수 있습니다:
위의 전자 미니 차트는 이중 바닥 패턴의 두 바닥과 뚫린 확인선을 보여줘 매수 기회를 포착할 수 있습니다.
포인트 앤 피겨는 시장 움직임을 그리는 매우 독특한 방법입니다. 포인트 & 피겨 차트의 장점은 시간 요소를 제거하고 정말 중요한 요소인 가격에 집중할 수 있다는 점입니다.열의 색상 오류는 열의 정의와 관련이 있다는 것을 시도하고 이해했습니다.
하나의 단일 열 대신 연속 블록으로 열을 분리하고 모든 열이 서로 붙어있는 것이 좋습니다 (약세열이 다음 강세 열에붙어있는등).
열의 색상 오류는 열의 정의와 관련이 있다는 것을 시도하고 이해했습니다.