
Renko 차트 표시
소개
포인트 앤 피규어 차트용 지표 및 카기 차트용 표시기 글에서는 포인트 앤 피규어 및 "카기" 표시기 차트를 설명했습니다. 원칙. Renko 차트를 작성하는 프로그래밍 방법 중 하나를 공부해 봅시다.
Renko라는 이름은 벽돌을 뜻하는 일본어 "renga"에서 파생되었습니다. Renko 차트는 가격 변동에 따라 생성이 결정되는 일련의 벽돌로 구성됩니다. 가격이 상승하면 상승 벽돌이 차트에 배치되고 가격이 하락하면 하락 벽돌이 추가됩니다. Renko는 일본어로 "느린 속도"를 의미합니다. Renko 차트는 아마도 19세기 어딘가에 일본에 나타났습니다. 미국과 유럽은 Steeve Nison이 1994년 그의 저서 Beyond Candlesticks: New Japanese Charting Techniques Revealed에서 이를 출판한 후 처음으로 이에 대해 들었습니다.
위에서 언급한 차트와 같이 Renko 차트는 타임라인을 무시하고 가격 움직임에만 관심이 있습니다. 점 및 그림 차트와 달리 Renko는 각 "벽돌"을 새 열(새로운 수직 평면에서)에 배치하고 나머지는 "벽돌"("점", "그림"의 크기)과 같은 공통 생성 방법을 사용합니다. ")가 고정되어 있고, 가격 분석과 수치 안감이 유사한 방식으로 이루어진다.
따라서 Renko 차트는 수직 바("벽돌")의 집합입니다. 흰색(중공) 벽돌은 추세 방향이 상승할 때 사용되며 검은색(채워진) 벽돌은 추세가 하락할 때 사용됩니다. 건설은 가격 행동으로 규제됩니다. 촬영 기간의 현재 가격을 이전 벽돌(흰색 또는 검은색)의 최소값 및 최대값과 비교합니다. 주식이 시가보다 높게 마감되면 몸체의 하단이 시가를 나타내고 몸체의 상단이 종가를 나타내는 속이 빈(흰색) 벽돌이 그려집니다. 주식이 시가보다 낮게 마감되는 경우, 채워진(검은색) 벽돌은 시가를 나타내는 본체의 상단과 종가를 나타내는 본체의 하단으로 그려집니다.
차트의 맨 처음 벽돌은 가격 행동에 따라 그려지며, 바 시작 가격은 이전 벽돌의 최대값과 최소값에 적용됩니다.
표준 Renko 차트 예, 그림 1:
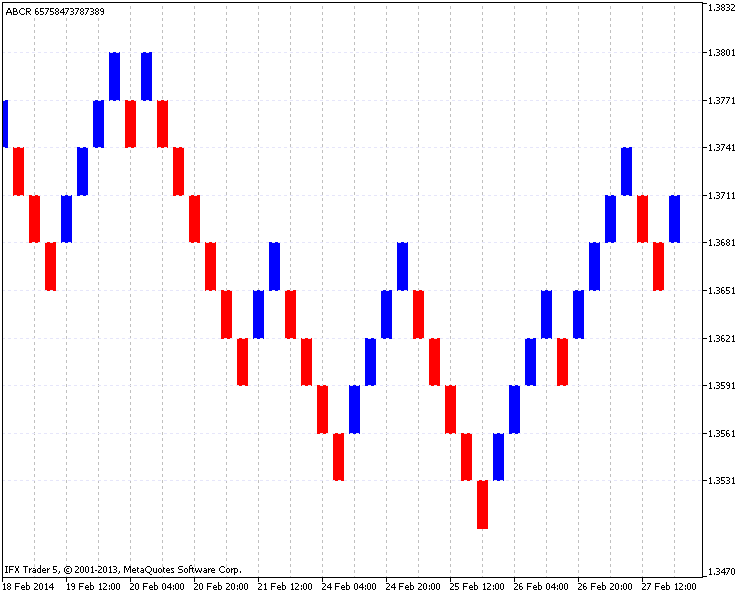
그림 1. 표준 Renko 차트 예
1. 차트 예시
표준 Renko 차트는 종가를 기준으로 작성됩니다. 먼저 기간과 상자 크기를 선택합니다.
이 예에서는 30포인트 상자 크기와 함께 EURUSD(H4 기간)가 사용됩니다. 2014년 3월 1일부터 2014년 1월 31일까지(약 1개월) Renko 차트의 결과는 그림 2에 나와 있습니다. 왼쪽에는 주어진 기간의 차트가 있습니다(여기에서 벽돌의 수평 확장을 볼 수 있음). 오른쪽, Renko 차트의 결과가 있습니다.
그림 2. Renko의 EURUSD 차트 결과(H4, 상자는 30포인트)
차트의 원리에 대해 자세히 살펴보겠습니다. 그림 2에서 빨간색 가로선은 가격 변화에 따른 각 벽돌의 크기(30포인트)를 나타내며 파란색은 가장 관심 있는 날짜를 나타냅니다.
2014년 1월 3일 말 차트에서 볼 수 있듯이 촛대는 1.3591 이전에 정의된 가격 범위(빨간색 수평선) 아래에서 1.3589(가격으로 표시됨)에서 마감되어 차트에 하향 벽돌을 만듭니다.
그 후 가격은 평평하며(1.3561 이하 또는 1.3651 이상에서 마감되지 않음), 20:00 10.01.2014(16:00에 생성된 촛대가 마감됨)까지 열리고 1.3663(가격으로 표시)에서 마감됩니다 (표시된 1.3651 가격 표시 이상). 그런 다음 가격은 2014년 1월 14일 20:00(촛대는 16:00 마감에 열림)까지 다시 고정되어 가격 범위를 극복하고 새 벽돌을 생성하고 1.3684에서 마감됩니다.
그런 다음 가격이 차트에서 하락하는 범위를 4배 돌파하는 하락세를 목격합니다. 2014년 1월 23일 12:00(촛대가 08:00 마감에 열림)에 두 가격대의 상승 돌파구가 있으며, 이는 차례로 1.3639에서 마감하여 두 개의 벽돌을 엽니다. 첫 번째 벽돌은 명확하게 보이고 두 번째 벽돌은 긴 수직선으로 당겨집니다(첫 번째 벽돌과 동시에 열리기 때문에). 동일한 원칙에 따라 추가적인 건설이 계속됩니다.
2. Renko 차트 작성 원리
이 표시기를 개발하는 동안 모든 기능은 가능한 한 독립적으로 구현되었습니다. 주요 목표 중 하나는 시장 분석을 보다 쉽게 수행할 수 있도록 지표의 잠재력을 극대화하는 것이었습니다.
계산은 현재 시간 범위 내에서 이루어지지 않습니다. 즉, 시간 범위는 설정에서 선택되며 시간 범위에 관계없이 표시기가 시작된 위치에 설정 데이터가 표시됩니다. 이는 취한 기간의 데이터를 별도의 버퍼 배열에 복사하여 달성할 수 있으며, 나중에 계산이 이루어지고 출력 버퍼 표시기가 채워집니다.
표준 Renko 차트는 종가에 따라 구성되지만 분석을 개선하기 위해 시가, 고가, 저가 값이 사용됩니다.
Renko 차트의 벽돌은 크기가 비슷하기 때문에 강한 가격 행동(몇몇 벽돌)에 의해 주도되는 가장 역동적인 시장 포인트를 아는 것이 유용합니다. 이를 위해 벽돌의 작은 수직 그림자(예: 일본 촛대)로 표시되는 (비활성화된) 표시가 있으며, 선택한 시간 표시줄의 마지막 벽돌 수준에서 올리거나 내립니다.
메인 차트에 지그재그를 구성할 수 있는 가능성은 그래픽 분석을 확장합니다.
그림 3은 전체 기능의 표시기를 나타냅니다.

그림 3. EURUSD 차트 표시(일일, 단계는 25포인트)
3. 표시기의 코드 및 알고리즘
표시기 코드는 900줄로 구성되어 다소 큽니다. 앞서 언급했듯이 최대 분리 기능은 알고리즘의 이해를 복잡하게 만들 수 있습니다. 이전 글의 일부 기능을 기반으로 사용할 것입니다. 일부 측면에서 오해가 있는 경우 가기 차트 구성 지표를 참조하거나 제게 이메일을 보내셔도 됩니다.
코드의 각 기능은 글에서 설명합니다. 기능은 그 자리에서 설명합니다.
3.1. 표시기 입력 매개변수
Renko 차트는 서로 다른 색상의 위아래 벽돌의 범위입니다. 이러한 유형의 구성에는 하나의 "색상 촛대" 그래픽 구성에 결합된 5개의 버퍼만 필요합니다. 나머지 4개의 버퍼는 지표를 계산하는 데 필요한 데이터를 수집합니다.
그룹으로 나누어 입력 매개변수(25)를 가져옵니다.
- step - 벽돌 크기 또는 계단;
- type_step - 단계 유형, 포인트 또는 백분율(후자는 현재 가격에 따라 계산됨);
- magic_numb - 그래픽 개체를 구별하는 데 필요하고 차트에서 제거하는 데 사용되는 매직 번호입니다;
- levels_number - 표시기 창에서 벽돌을 나누는 레벨(0- 레벨 없음);
- levels_color - 표시기 창의 레벨 색상;
- time_frame - 차트 구성 기간(분석 기간)을 설정하는 데 사용됩니다.
- time_redraw - 차트의 업데이트 시간;
- first_date_start - 차트 작성을 시작할 날짜;
- type_price - 건설 가격 유형: 마감 - 마감 가격을 기반으로 하는 표준 방법. 시가 - 시가 높음 - 최고 가격 및 낮음 - 최저 가격;
- shadow_print - true 옵션을 설정하면 그림자가 여러 벽돌을 열 수 있는 최대 또는 최소 가격을 나타냅니다;
- filter_number - 차트 반전에 사용되는 벽돌 값(차트를 뒤집는 데 필요한 벽돌 수를 담당하는 추가 옵션);
- zig_zag - 기본 차트에 지그재그를 그리는 데 사용됩니다(분석을 용이하게 하거나 차트 업데이트에 사용되는 기본 차트의 추가 그림);
- zig_zag_shadow - 최대 및 최소 가격에 따라 지그재그를 그리는 데 사용됩니다(가장 가까운 최대 및 최소 가격을 사용하여 끝점에 지그재그를 구성);
- zig_zag_width - 지그재그 선 너비;
- zig_zag_color_up - 지그재그 위쪽 선 색상;
- zig_zag_color_down - 지그재그 아래쪽 선 색상;
- square_draw - 메인 차트에 벽돌을 그리는 데 사용됩니다(이 모드에서는 벽돌을 여는 가격 움직임을 볼 수 있음);
- square_color_up - 메인 위쪽 차트의 벽돌 색상;
- square_color_down - 주요 하향 차트의 벽돌 색상;
- square_fill - 기본 차트의 벽돌 색상;
- square_width - 기본 차트의 벽돌 선 너비;
- frame_draw - 벽돌 프레임을 그리는 데 사용됩니다(벽돌 테두리를 나타내며 거의 사용되지 않는 추가 옵션입니다).
- frame_width - 벽돌 선 너비;
- frame_color_up - 위쪽 벽돌 테두리의 색상;
- frame_color_down - 다운 벽돌 테두리의 색상입니다.
그런 다음 코드는 버퍼를 선언합니다. 5개의 기본 버퍼는 그래픽 그리기에 사용되는 반면 4개는 설계 및 계산 데이터를 저장하는 데 사용됩니다. Price[] - 시공에 사용된 복사된 가격을 저장하는 버퍼, Date[] - 메인 차트, Price_high[] 및 Price_low[]에 그림에 사용된 복사된 데이터를 저장하는 버퍼 - 지그재그s 도면에 적용된 최대값과 최소값을 메인 차트에 저장하는 버퍼.
그 후 계산 버퍼 배열 및 보조 기능 변수가 선언됩니다: func_draw_renko, func_draw_zig_zag, func_draw_renko_main_chart. 이는 나중에 설명하겠습니다.
//+------------------------------------------------------------------+
//|                                                         ABCR.mq5 |
//|                                   Azotskiy Aktiniy ICQ:695710750 |
//|                          https://www.mql5.com/ru/users/Aktiniy |
//+------------------------------------------------------------------+
//--- Auto Build Chart Renko
#property copyright "Azotskiy Aktiniy ICQ:695710750"
#property link      "https://www.mql5.com/ru/users/Aktiniy"
#property version   "1.00"
#property description "Auto Build Chart Renko"
#property description "   "
#property description "This indicator used to draw Renko chart in the indicator window, and in the main chart window"
#property indicator_separate_window
#property indicator_buffers 9
#property indicator_plots   1
//--- plot RENKO
#property indicator_label1  "RENKO"
#property indicator_type1   DRAW_COLOR_CANDLES
#property indicator_color1  clrRed,clrBlue,C'0,0,0',C'0,0,0',C'0,0,0',C'0,0,0',C'0,0,0',C'0,0,0'
#property indicator_style1  STYLE_SOLID
#property indicator_width1  1
//--- construction method
enum type_step_renko
  {
   point=0,   // Point
   percent=1, // Percent
  };
//--- type of price
enum type_price_renko
  {
   close=0, // Close
   open=1,  // Open
   high=2,  // High
   low=3,   // Low
  };
//--- input parameters
input double           step=10;                                 // Step
input type_step_renko  type_step=point;                         // Type of step
input long             magic_numb=65758473787389;               // Magic number
input int              levels_number=1000;                      // Number of levels (0-no levels)
input color            levels_color=clrLavender;                // Color of levels
input ENUM_TIMEFRAMES  time_frame=PERIOD_CURRENT;               // Calculation period
input ENUM_TIMEFRAMES  time_redraw=PERIOD_M1;                   // Chart redraw period
input datetime         first_date_start=D'2013.09.13 00:00:00'; // Start date
input type_price_renko type_price=close;                        // Price for construction
input bool             shadow_print=true;                       // Show shadows
input int              filter_number=0;                         // Bricks number needed to reversal
input bool             zig_zag=true;                            // Whether ZigZag should be drawn on the main chart
input bool             zig_zag_shadow=true;                     // Draw ZigZag at highs and lows of the price
input int              zig_zag_width=2;                         // ZigZag line width
input color            zig_zag_color_up=clrBlue;                // ZigZag up line color
input color            zig_zag_color_down=clrRed;               // ZigZag down line color
input bool             square_draw=true;                        // Whether bricks should be drawn on the main chart
input color            square_color_up=clrBlue;                 // Up brick color on the main chart
input color            square_color_down=clrRed;                // Down brick color on the main chart
input bool             square_fill=true;                        // Brick filling on the main chart
input int              square_width=2;                          // Brick line width on the main chart
input bool             frame_draw=true;                         // Whether to draw frames of the bricks
input int              frame_width=2;                           // Brick frame line width
input color            frame_color_up=clrBlue;                  // Up brick frames color
input color            frame_color_down=clrRed;                 // Down brick frames color
//--- indicator buffers
double         RENKO_open[];
double         RENKO_high[];
double         RENKO_low[];
double         RENKO_close[];
double         RENKO_color[];

double         Price[];      // copy price data to the buffer
double         Date[];       // copy data to the buffer
double         Price_high[]; // copy high prices to the buffer
double         Price_low[];  // copy low prices to the buffer
//--- calculation buffer arrays
double         up_price[];    // up brick price
double         down_price[];  // down brick price
char           type_box[];    // brick type (up, down)
datetime       time_box[];    // brick copy time
double         shadow_up[];   // up high price
double         shadow_down[]; // down low price
int            number_id[];   // Index of Price_high and Price_low arrays
//--- calculation global variables
int obj=0;           //variable for storing number of graphics objects
int a=0;             // variable to count bricks
int bars;            // number of bars
datetime date_stop;  // current data
datetime date_start; // start date variable, for calculations
bool date_change;    // variable for storing details about time changes
-->
3.2. 표시기 이니셜라이저
표시기 버퍼는 1차원 동적 배열로 바인딩되며 시계열뿐만 아니라 주소 지정도 INDICATOR_DATA 및 INDICATOR_COLOR_INDEX 버퍼에 설정됩니다. 나머지 동적 배열(Price[], Date[], Price_high[], Price_low[])의 주소 지정은 데이터를 저장하는 데만 사용되므로 변경되지 않고 그대로 유지됩니다.
차트에 표시되지 않는 값이 설정됩니다. 그런 다음 표시기에 이름이 할당되고 표시 정확도가 설정되고 표시기 창에서 현재 숫자 값의 표시가 금지됩니다.
그 후 date_start 변수 값(계산 시작 날짜)이 할당됩니다. 변수에 값이 할당되고 차트가 표시기 버퍼에 비해 너무 무거울 수 있으므로 입력 값을 사용하지 않습니다. 시작 날짜가 수정되고 관습이 발표됩니다. 분석 시작 날짜 또는 "func_calc_date_start"의 기능은 시간 수정을 수행합니다.
//+------------------------------------------------------------------+
//| Custom indicator initialization function                         |
//+------------------------------------------------------------------+
int OnInit()
  {
//--- indicator buffers mapping
   SetIndexBuffer(0,RENKO_open,INDICATOR_DATA);
   ArraySetAsSeries(RENKO_open,true);
   SetIndexBuffer(1,RENKO_high,INDICATOR_DATA);
   ArraySetAsSeries(RENKO_high,true);
   SetIndexBuffer(2,RENKO_low,INDICATOR_DATA);
   ArraySetAsSeries(RENKO_low,true);
   SetIndexBuffer(3,RENKO_close,INDICATOR_DATA);
   ArraySetAsSeries(RENKO_close,true);
   SetIndexBuffer(4,RENKO_color,INDICATOR_COLOR_INDEX);
   ArraySetAsSeries(RENKO_color,true);
//---
   SetIndexBuffer(5,Price,INDICATOR_CALCULATIONS);      // initialize price buffer
   SetIndexBuffer(6,Date,INDICATOR_CALCULATIONS);       // initialize data buffer
   SetIndexBuffer(7,Price_high,INDICATOR_CALCULATIONS); // initialize high price
   SetIndexBuffer(8,Price_low,INDICATOR_CALCULATIONS);  // initialize low price
//--- set data which will not be drawn
   PlotIndexSetDouble(0,PLOT_EMPTY_VALUE,0);
//--- set the indicator appearance
   IndicatorSetString(INDICATOR_SHORTNAME,"ABCR "+IntegerToString(magic_numb)); // indicator name
//--- display accuracy
   IndicatorSetInteger(INDICATOR_DIGITS,_Digits);
//--- prohibit display of the results of the indicator current values
   PlotIndexSetInteger(0,PLOT_SHOW_DATA,false);
//--- assign start date variable value
   date_start=first_date_start;
//---
   return(INIT_SUCCEEDED);
  }
-->
3.3. 분석 시작일 계산 기능
함수는 작고 주로 루프로 구성됩니다. 초기 설정 시작 날짜와 계산 종료 날짜(현재 날짜)의 두 가지 입력 매개변수만 있습니다. 함수에서 시작일이 변경되어 답변으로 표시됩니다.
함수 본문은 수신 버퍼 배열을 측정하는 것부터 시작합니다(모든 버퍼는 선택한 시간 프레임 바의 수와 동일한 크기를 가짐). 그런 다음 선택한 시간 프레임에서 바 수를 측정합니다.
루프 조건에서 선택한 시간 프레임의 바 수와 버퍼 배열 크기를 비교합니다. 더 많은 바가 있는 경우(즉, 버퍼 배열에 모두 배치할 수 없는 경우) 소요 시간이 10일로 단축되어 분석 시작 날짜에 10일이 추가됩니다. 이것은 버퍼 배열이 모든 바 데이터를 포함할 수 없을 때까지 계속됩니다. 함수는 계산된 날짜를 반환합니다.
//+------------------------------------------------------------------+
//| Func Calculate Date Start                                        |
//+------------------------------------------------------------------+
datetime func_calc_date_start(datetime input_data_start,// initially start date set
                              datetime data_stop)       // calculation end date (current date)
//---
  {
   int Array_Size=ArraySize(Price);
   int Bars_Size=Bars(_Symbol,time_frame,input_data_start,data_stop);
   for(;Bars_Size>Array_Size;input_data_start+=864000) // 864000 = 10 days
     {
      Bars_Size=Bars(_Symbol,time_frame,input_data_start,data_stop);
     }
   return(input_data_start);
//---
  }
-->
3.4. 데이터 복사 기능
먼저 데이터 복사 기능(func_copy_price, func_copy_date)으로 데이터를 복사합니다.
가격 복사 기능 또는 func_copy_price를 고려하여 설정된 기간 및 시간대의 Open, Close, High 및 Low 가격 배열에 복사할 수 있습니다. 복사가 성공하면 함수는 "true"를 반환합니다.
함수 호출 시작 시 false 값이 초기화되고 복사된 데이터의 결과 변수가 초기화되고 음수 값이 할당됩니다. 임시로 복사된 데이터를 저장하기 위한 공통 배열 price_interim[]과 복사된 데이터가 저장되지 않도록 bar_to_copy 변수를 선언합니다.
또한 이 함수는 복사된 데이터를 저장하기 위해 이전에 선언된 변수를 재설정하고 시간대의 바 수를 계산하며 선택한 가격(0-종가, 1-시가, 2-고가 및 3-하한) 및 a switch 문은 이전에 복사한 데이터의 값을 bars_copyed 변수 가격에 할당합니다. 그런 다음 복사할 데이터 수가 계산됩니다. 이전에 데이터를 복사한 경우 차트의 변경을 방지하기 위해 마지막으로 복사한 바 정보가 삭제됩니다.
스위치는 필요한 가격 데이터를 price_interim[] 시간 배열에 복사합니다. 그런 다음 복사 결과를 확인하고 스위치이 복사된 데이터 변수를 채웁니다.
//+------------------------------------------------------------------+
//| Func Copy Price                                                  |
//+------------------------------------------------------------------+
bool func_copy_price(double &result_array[],
                     ENUM_TIMEFRAMES period,// Timeframe
                     datetime data_start,
                     datetime data_stop,
                     char price_type) // 0-Close, 1-Open, 2-High, 3-Low
  {
//---
   int x=false;        // Variable for answering
   int result_copy=-1; // copied data number
//---
   static double price_interim[]; // Temporal dynamic array for storing copied data
   static int bars_to_copy;       // number of bars to copy
   static int bars_copied_0;      // number of copied bars from Close start date
   static int bars_copied_1;      // number of copied bars from Open start date
   static int bars_copied_2;      // number of copied bars from High start date
   static int bars_copied_3;      // number of copied bars from Low start date
   static int bars_copied;        // number of copied bars from the common variable start date
//--- variables reset due to changes in a start date
   if(date_change==true)
     {
      ZeroMemory(price_interim);
      ZeroMemory(bars_to_copy);
      ZeroMemory(bars_copied_0);
      ZeroMemory(bars_copied_1);
      ZeroMemory(bars_copied_2);
      ZeroMemory(bars_copied_3);
      ZeroMemory(bars_copied);
     }
//--- get an information about the current bars number on the timeframe
   bars_to_copy=Bars(_Symbol,period,data_start,data_stop);
//--- assign a copied function value to a common variable
   switch(price_type)
     {
      case 0:
         //--- Close
         bars_copied=bars_copied_0;
         break;
      case 1:
         //--- Open
         bars_copied=bars_copied_1;
         break;
      case 2:
         //--- High
         bars_copied=bars_copied_2;
         break;
      case 3:
         //--- Low
         bars_copied=bars_copied_3;
         break;
     }
//--- calculate number of bars required to be copied
   bars_to_copy-=bars_copied;
//--- if it is not the first time the data has been copied
   if(bars_copied!=0)
     {
      bars_copied--;
      bars_to_copy++;
     }
//--- change the size of the recieving array
   ArrayResize(price_interim,bars_to_copy);
//--- copy data to the recieving array
   switch(price_type)
     {
      case 0:
         //--- Close
        {
         result_copy=CopyClose(_Symbol,period,0,bars_to_copy,price_interim);
        }
      break;
      case 1:
         //--- Open
        {
         result_copy=CopyOpen(_Symbol,period,0,bars_to_copy,price_interim);
        }
      break;
      case 2:
         //--- High
        {
         result_copy=CopyHigh(_Symbol,period,0,bars_to_copy,price_interim);
        }
      break;
      case 3:
         //--- Low
        {
         result_copy=CopyLow(_Symbol,period,0,bars_to_copy,price_interim);
        }
      break;
     }
//--- check the result of data copying
   if(result_copy!=-1) // if copying to the intermediate array is successful
     {
      ArrayCopy(result_array,price_interim,bars_copied,0,WHOLE_ARRAY); // copy the data from the temporary array to the main one
      x=true;                   // assign the positive answer to the function
      bars_copied+=result_copy; // increase the value of the processed data
     }
//--- return the information about the processed data with one of the copied variables
   switch(price_type)
     {
      case 0:
         //--- Close
         bars_copied_0=bars_copied;
         break;
      case 1:
         //--- Open
         bars_copied_1=bars_copied;
         break;
      case 2:
         //--- High
         bars_copied_2=bars_copied;
         break;
      case 3:
         //--- Low
         bars_copied_3=bars_copied;
         break;
     }
//---
   return(x);
  }
-->
"func_copy_date" 또는 날짜 복사 기능. 함수의 코드는 위에서 언급한 단위와 유사하지만 차이점은 복사된 데이터의 유형입니다.
//+------------------------------------------------------------------+
//| Func Copy Date                                                   |
//+------------------------------------------------------------------+
bool func_copy_date(double &result_array[],
                    ENUM_TIMEFRAMES period,// timeframe
                    datetime data_start,
                    datetime data_stop)
  {
//---
   int x=false;                    // variable for answer
   int result_copy=-1;             // number of copied data
   static datetime time_interim[]; // temporaty dynamic array for storing the copied data
   static int bars_to_copy;        // bars number required to be copied
   static int bars_copied;         // copied bars with start date
//--- variables reset due to the start date change
   if(date_change==true)
     {
      ZeroMemory(time_interim);
      ZeroMemory(bars_to_copy);
      ZeroMemory(bars_copied);
     }
//---
   bars_to_copy=Bars(_Symbol,period,data_start,data_stop); // Find out the current number of bars on the time interval
   bars_to_copy-=bars_copied; // Calculate the number of bars to be copied
//---
   if(bars_copied!=0) // If it is not the first time the data has been copied
     {
      bars_copied--;
      bars_to_copy++;
     }
//---
   ArrayResize(time_interim,bars_to_copy); // Change the size of the receiving array
   result_copy=CopyTime(_Symbol,period,0,bars_to_copy,time_interim);
//---
   if(result_copy!=-1) // If copying to the intermediate array is successful
     {
      ArrayCopy(result_array,time_interim,bars_copied,0,WHOLE_ARRAY); // Copy the data from the temporary array to the main one
      x=true; // assign the positive answer to the function
      bars_copied+=result_copy; // Increase the value of the processed data
     }
//---
   return(x);
  }
-->
3.5. 벽돌 계산
지표 매개변수에서 볼 수 있듯이 벽돌 크기는 현재 가격의 포인트와 백분율로 설정할 수 있습니다. 포인트는 고정된 값이지만 백분율로 계산하는 방법은 무엇입니까? 이를 위해 "func_calc_dorstep" 벽돌 계산 기능이 있습니다.
세 가지 입력 매개변수가 있습니다. 현재 가격(벽돌 크기가 백분율로 표시되는 경우 가격의 백분율을 계산하기 위해), 계산 방법(포인트 또는 백분율) 및 단계 크기(백분율 또는 점).
함수의 시작 부분에서 답에 대한 변수는 이중형으로 초기화되며 if-else 조건문에 의해 선택된 계산 방식에 따라 포인트가 할당됩니다. 그런 다음 계산 결과 비적분 값이 발생하더라도 값 정수를 유지하기 위해 응답 변수가 int 유형으로 변환됩니다.
//+------------------------------------------------------------------+
//| Func Calculate Doorstep                                          |
//+------------------------------------------------------------------+
int func_calc_dorstep(double price,      // price
                      char type_doorstep,// step type
                      double doorstep)   // step
  {
   double x=0;          // variable for answer

   if(type_doorstep==0) // If the calculation is to be performed in points
     {
      x=doorstep;
     }

   if(type_doorstep==1) // If the calculation is to be performed in percentage
     {
      x=price/_Point*doorstep/100;
     }

   return((int)x);
  }
-->
3.6. 주요 기능 - Renko 차트 졸업
Renko 차트 졸업의 주요 기능 - "func_draw_renko". 이 기능은 그래픽 버퍼(지시자 버퍼) 및 계산 버퍼 배열 채우기를 담당합니다. 계산 버퍼는 각 벽돌의 정보를 저장합니다.
함수의 입력 매개변수는 가격과 바 건설 날짜의 데이터 배열입니다. 여기에서 단계 유형 및 해당 매개변수, 역 필터 및 그림자 그리기 매개변수에 대한 정보를 찾을 수 있습니다.
이 기능은 벽돌 계산 번호가 있는 부분과 계산 및 그래픽 버퍼가 채워지는 부분의 두 부분으로 나눌 수 있습니다.
함수의 시작 부분에서 버퍼는 빈 상자를 끄기 위해 재설정됩니다. 나중에 보조 변수가 다음과 같이 입력됩니다: "doorstep_now" 변수는 단계(백분율 단계에서 크기를 변경하는 데 사용됨), "point_go"는 마지막으로 빌드된 벽돌로부터의 거리에 대한 정보를 저장하며, "a" 변수는 벽돌 계산, "up_price_buit", "down_price_buit"에 사용됩니다 - 마지막으로 분석한 고/저 가격은 "type_box_black" - 마지막으로 분석한 벽돌 종류(위 아니면 아래).
두 기능 부분 모두 루프로 구성되며 두 번째 부분이 첫 번째 부분을 완료합니다. 프로세스를 자세히 분석합니다.
첫 번째 루프는 복사된 모든 값을 통해 처리되며 "bars" 값은 복사된 데이터의 수를 담당합니다(나중에 고려할 "func_concolidation" 함수에서 계산됨). 루프에서 더 나아가 이 함수는 벽돌 크기 계산을 시작합니다. 바마다 종가가 다르기 때문에 백분율 단계를 사용하는 경우 바별로 별도로 계산해야 합니다.
조건부 if 문은 가격 방향을 확인하는 반면 가격은 하나 이상의 단계 거리를 통과해야 합니다. 가격 이동 방향이 결정된 후 이전 이동(마지막 벽돌)의 상태를 확인합니다. 이는 표시기 매개변수에 필터 매개변수(반전을 위해 필요한 벽돌 수)가 포함되어 있기 때문에 수행됩니다. 모든 조건을 확인한 후 루프가 시작된 후 현재 가격 움직임을 나타내는 블록만큼 처리됩니다.
표시 바가 계산되고 계산 버퍼 배열의 크기가 변경되고 재설정됩니다. 그 후 처음 몇 개(첫 번째 비교 중에 사용됨) 계산 배열에 기본 값이 할당됩니다.
표시 가능한 최대 바 수가 가능한 벽돌 수보다 적으면 추가 벽돌이 계산되고 낮은 값에 대한 메시지가 표시됩니다. 이것은 차트의 잘못된 표시를 방지하기 위해 수행됩니다.
벽돌 수 계산 변수가 재설정되고 메인 루프가 시작됩니다. 이전 루프와 달리 메인 루프는 계산 버퍼 배열과 벽돌 카운터 리셋을 채우는 역할도 합니다.
함수가 끝나면 그래픽 버퍼가 채워집니다.
//+------------------------------------------------------------------+
//| Func Draw Renko                                                  |
//+------------------------------------------------------------------+
void func_draw_renko(double &price[],   // prices array
                     double &date[],    // date array
                     int number_filter, // bricks number for reversal
                     bool draw_shadow,  // draw shadow
                     char type_doorstep,// step type
                     double doorstep)   // step
  {
//--- arrays reset
//--- drawing buffer arrays
   ZeroMemory(RENKO_close);
   ZeroMemory(RENKO_color);
   ZeroMemory(RENKO_high);
   ZeroMemory(RENKO_low);
   ZeroMemory(RENKO_open);
//--- additional variables
   int doorstep_now; // current step
   int point_go;     // passed points
//--- additional variables for bricks number calculating
   a=0;
   double up_price_calc=price[0];
   double down_price_calc=price[0];
   char type_box_calc=0;

   for(int z=0; z<bars; z++) //---> bricks calculating loop
     {
      //--- calculate step according to the current price
      doorstep_now=func_calc_dorstep(price[z],type_doorstep,doorstep);
      //--- if price rises
      if((price[z]-up_price_calc)/_Point>=doorstep_now)
        {
         //--- calculate points passed
         point_go=int((price[z]-up_price_calc)/_Point);
         //--- prices was rising or unknown price behavour
         if(type_box_calc==1 || type_box_calc==0)
           {
            for(int y=point_go; y>=doorstep_now; y-=doorstep_now)
              {
               //--- add the next brick
               a++;
               //--- add value of the next brick low price
               down_price_calc=up_price_calc;
               //--- add value of the next brick up price
               up_price_calc=down_price_calc+(doorstep_now*_Point);
               //--- set the brick type (up)
               type_box_calc=1;
              }
           }
         //--- price went down
         if(type_box_calc==-1)
           {
            if((point_go/doorstep_now)>=number_filter)
              {
               for(int y=point_go; y>=doorstep_now; y-=doorstep_now)
                 {
                  //--- add the next brick
                  a++;
                  //--- set the next brick down price
                  down_price_calc=up_price_calc;
                  //--- set the next brick up price
                  up_price_calc=down_price_calc+(doorstep_now*_Point);
                  //--- set the brick type (up)
                  type_box_calc=1;
                 }
              }
           }
        }
      //--- if the price moves downwards
      if((down_price_calc-price[z])/_Point>=doorstep_now)
        {
         //--- calculate the points passed
         point_go=int((down_price_calc-price[z])/_Point);
         //--- if the price went downwards or the direction is unknown
         if(type_box_calc==-1 || type_box_calc==0)
           {
            for(int y=point_go; y>=doorstep_now; y-=doorstep_now)
              {
               //--- add the next brick
               a++;
               //--- set the next brick low price value
               up_price_calc=down_price_calc;
               //--- set the next brick up price value
               down_price_calc=up_price_calc-(doorstep_now*_Point);
               //--- set the britck type (up)
               type_box_calc=-1;
              }
           }
         //--- the price moved upwards
         if(type_box_calc==1)
           {
            if((point_go/doorstep_now)>=number_filter)
              {
               for(int y=point_go; y>=doorstep_now; y-=doorstep_now)
                 {
                  //--- add the next brick
                  a++;
                  //--- set the next brick down price value
                  up_price_calc=down_price_calc;
                  //--- set the next brick up price value
                  down_price_calc=up_price_calc-(doorstep_now*_Point);
                  //--- set the brick type (up)
                  type_box_calc=-1;
                 }
              }
           }
        }
     } //---< bricks calculate loop
//--- calculate the number of display bars
   int b=Bars(_Symbol,PERIOD_CURRENT);
//--- resize arrays
   ArrayResize(up_price,b);
   ArrayResize(down_price,b);
   ArrayResize(type_box,b);
   ArrayResize(time_box,b);
   ArrayResize(shadow_up,b);
   ArrayResize(shadow_down,b);
   ArrayResize(number_id,b);
//--- resize calculation buffers array
   ZeroMemory(up_price);
   ZeroMemory(down_price);
   ZeroMemory(type_box);
   ZeroMemory(time_box);
   ZeroMemory(shadow_up);
   ZeroMemory(shadow_down);
   ZeroMemory(number_id);
//--- fill arrays with the initial values
   up_price[0]=price[0];
   down_price[0]=price[0];
   type_box[0]=0;
//--- calculate odd bricks number
   int l=a-b;
   int turn_cycle=l/(b-1);
   int turn_rest=(int)MathMod(l,(b-1))+2;
   int turn_var=0;
//--- message of partially displayed bricks
   if(a>b)Alert("More bricks than can be placed on the chart, the step is small");

   a=0; //--- reset bricks claculating variable
   for(int z=0; z<bars; z++) //---> Main loop
     {
      //--- calculate the step according to the price
      doorstep_now=func_calc_dorstep(price[z],type_doorstep,doorstep);
      //---if the price moves upwards
      if((price[z]-up_price[a])/_Point>=doorstep_now)
        {
         //--- calculate the points passed
 point_go=int((price[z]-up_price[a])/_Point);
         //--- price moved upwards or its behavour is unknown
         if(type_box[a]==1 || type_box[a]==0)
           {
            for(int y=point_go; y>=doorstep_now; y-=doorstep_now)
              {
               a++; //--- add the next brick
               if((a==b && turn_var<turn_cycle) || (turn_var==turn_cycle && turn_rest==a))
                 {
                  up_price[0]=up_price[a-1];
                  a=1;        // bricks calculator reset
                  turn_var++; // calculator of loops reset
                 }
               //--- the next brick low price value
               down_price[a]=up_price[a-1];
               //--- set the brick up price
               up_price[a]=down_price[a]+(doorstep_now*_Point);

               //--- set the up shadow value
               if(shadow_print==true) shadow_up[a]=price[z]; //to the upper price level
               else shadow_up[a]=up_price[a];                // to the up price level

               //--- set the low price value(to the brick price level)
               shadow_down[a]=down_price[a];
               //--- value of the brick closing time
               time_box[a]=(datetime)Date[z];
               //--- set the brick type (up)
               type_box[a]=1;
               //--- set the index
               number_id[a]=z;
              }
           }
         //--- the price moved downwards
         if(type_box[a]==-1)
           {
            if((point_go/doorstep_now)>=number_filter)
              {
               for(int y=point_go; y>=doorstep_now; y-=doorstep_now)
                 {
                  a++; //--- add the next brick

                  if((a==b && turn_var<turn_cycle) || (turn_var==turn_cycle && turn_rest==a))
                    {
                     up_price[0]=up_price[a-1];
                     a=1;        // bricks counter reset
                     turn_var++; // loops reset cycle
                    }
                  //--- set the next brick low price value
                  down_price[a]=up_price[a-1];
                  //--- set the next brick up price
                  up_price[a]=down_price[a]+(doorstep_now*_Point);

                  //--- set the up shadow value
                  if(shadow_print==true) shadow_up[a]=price[z]; // at the up price level
                  else shadow_up[a]=up_price[a];                // the brick up price level

                  //--- set of the down price value (the brick price level)
                  shadow_down[a]=down_price[a];
                  //--- set the close time
                  time_box[a]=(datetime)Date[z];
                  //--- set the up brick
                  type_box[a]=1;
                  //--- set index
                  number_id[a]=z;
                 }
              }
           }
        }

      //--- if price moves upwards
      if((down_price[a]-price[z])/_Point>=doorstep_now)
        {
         //--- calculate the points passed
         point_go=int((down_price[a]-price[z])/_Point);
         //--- price moved downwards or the direction is unknown
         if(type_box[a]==-1 || type_box[a]==0)
           {
            for(int y=point_go; y>=doorstep_now; y-=doorstep_now)
              {
               a++; //--- add the next brick
               if((a==b && turn_var<turn_cycle) || (turn_var==turn_cycle && turn_rest==a))
                 {
                  down_price[0]=down_price[a-1];
                  a=1;        // set the bricks counter to zero
                  turn_var++; // reset loop counter
                 }
               //--- set the next brick down price
               up_price[a]=down_price[a-1];
               //--- set the next brick up price
               down_price[a]=up_price[a]-(doorstep_now*_Point);

               //--- set the down shadow value
               if(shadow_print==true) shadow_down[a]=price[z]; //--- the last lowest price level
               else shadow_down[a]=down_price[a];              //--- low price level

               //--- set the up price value
               shadow_up[a]=up_price[a];
               //--- set the brick close time
               time_box[a]=set the down shadow value];
               //--- set the brick type (down)
               type_box[a]=-1;
               //--- set index
               number_id[a]=z;
              }
           }
         //--- price moved upwards
         if(type_box[a]==1)
           {
            if((point_go/doorstep_now)>=number_filter)
              {
               for(int y=point_go; y>=doorstep_now; y-=doorstep_now)
                 {
                  a++; //--- add the next brick
                  if((a==b && turn_var<turn_cycle) || (turn_var==turn_cycle && turn_rest==a))
                    {
                     down_price[0]=down_price[a-1];
                     a=1;        // reset bricks counter
                     turn_var++; // reset loop counter
                    }

                  up_price[a]=down_price[a-1]; //--- set the next brick down price
                  down_price[a]=up_price[a]-(doorstep_now*_Point); //--- set the up price value

                  //--- set the down shadow value
                  if(shadow_print==true) shadow_down[a]=price[z]; // at the lowest price level
                  else shadow_down[a]=down_price[a];              // at the down price level

                  //--- set the up price level
                  shadow_up[a]=up_price[a];
                  //--- set the brick close time
                  time_box[a]=(datetime)Date[z];
                  //--- set the brick type (down)
                  type_box[a]=-1;
                  //--- index set
                  number_id[a]=z;
                 }
              }
           }
        }
     } //---< Main loop

//--- fill the draw buffer
   int y=a;
   for(int z=0; z<a; z++)
     {
      if(type_box[y]==1)RENKO_color[z]=0;
      else RENKO_color[z]=1;
      RENKO_open[z]=down_price[y];
      RENKO_close[z]=up_price[y];
      RENKO_high[z]=shadow_up[y];
      RENKO_low[z]=shadow_down[y];
      y--;
     }
  }
-->
3.7. "추세선" 및 "사각형" 그래픽 개체 생성 기능
"추세선" 그래픽 개체 또는 "func_create_trend_line"을 생성하기 위한 함수 및 "사각형" 그래픽 개체 또는 "func_create_square_or_rectangle"을 생성하기 위한 함수는 OBJ_RECTANGLE 및 OBJ_TREND 참조에 언급된 데이터를 기반으로 합니다. 그들은 "Renko" 차트에서 그래픽 개체를 생성하고 메인 차트에서 "지그재그"를 구성하는 데 사용됩니다.
//+------------------------------------------------------------------+
//| Func Create Trend Line                                           |
//+------------------------------------------------------------------+
void func_create_trend_line(string name,
                            double price1,
                            double price2,
                            datetime time1,
                            datetime time2,
                            int width,
                            color color_line)
  {
   ObjectCreate(0,name,OBJ_TREND,0,time1,price1,time2,price2);
//--- set the line color
   ObjectSetInteger(0,name,OBJPROP_COLOR,color_line);
//--- set the line display style
   ObjectSetInteger(0,name,OBJPROP_STYLE,STYLE_SOLID);
//--- set the width of the line
   ObjectSetInteger(0,name,OBJPROP_WIDTH,width);
//--- display in the foreground (false) or in the (true) background
   ObjectSetInteger(0,name,OBJPROP_BACK,false);
//--- enable (true) or disable (false) the mode of the left line display
   ObjectSetInteger(0,name,OBJPROP_RAY_LEFT,false);
//--- enable (true) or disable (false) the right line display
   ObjectSetInteger(0,name,OBJPROP_RAY_RIGHT,false);
  }
-->
//+------------------------------------------------------------------+
//| Func Create Square or Rectangle                                  |
//+------------------------------------------------------------------+
void func_create_square_or_rectangle(string name,
                                     double price1,
                                     double price2,
                                     datetime time1,
                                     datetime time2,
                                     int width,
                                     color color_square,
                                     bool fill)
  {
//--- create rectangle according to the setpoints
   ObjectCreate(0,name,OBJ_RECTANGLE,0,time1,price1,time2,price2);
//--- set the rectangle color
   ObjectSetInteger(0,name,OBJPROP_COLOR,color_square);
//--- set style of rectangle color
   ObjectSetInteger(0,name,OBJPROP_STYLE,STYLE_SOLID);
//--- set lines width
   ObjectSetInteger(0,name,OBJPROP_WIDTH,width);
//--- activate (true) or disactivate (false) mode of rectangle colouring
   ObjectSetInteger(0,name,OBJPROP_FILL,fill);
//--- display in the foreground (false) or in the background (true)
   ObjectSetInteger(0,name,OBJPROP_BACK,false);
  }
-->
3.8. 메인 차트의 "Renko" 건설
계산 공통 버퍼 배열의 사용으로 인해 Renko 차트 또는 "func_draw_renko_main_chart" 기능은 다소 컴팩트합니다.
입력 매개변수에는 프레임이 있는 위쪽 및 아래쪽 벽돌, 두 가지 유형의 프레임 너비(첫 번째는 벽돌에 사용, 두 번째는 프레임에 사용), 세 가지 표시 옵션("벽돌", 색상 및 프레임)이 포함됩니다.
먼저 객체의 이름을 가진 변수를 선언한 다음 생성된 각 객체의 이름을 가진 루프가 열리고 이전 벽돌 유형에 따라 "추세선" 및 "사각형" 그래픽 객체의 기능이 시작됩니다. 매개변수는 계산 버퍼 배열에서 가져옵니다.
//+------------------------------------------------------------------+
//| Func Draw Renko Main Chart                                       |
//+------------------------------------------------------------------+
void func_draw_renko_main_chart(color color_square_up,
                                color color_square_down,
                                color color_frame_up,
                                color color_frame_down,
                                int width_square,
                                int width_frame,
                                bool square,
                                bool fill,
                                bool frame)
  {
   string name_square;
   string name_frame;

   for(int z=2; z<=a; z++)
     {
      name_square=IntegerToString(magic_numb)+"_Square_"+IntegerToString(z);
      name_frame=IntegerToString(magic_numb)+"_Frame_"+IntegerToString(z);
      if(type_box[z]==1)
        {
         if(square==true)func_create_square_or_rectangle(name_square,up_price[z],down_price[z],time_box[z-1],time_box[z],width_square,color_square_up,fill);
         if(frame==true)func_create_square_or_rectangle(name_frame,up_price[z],down_price[z],time_box[z-1],time_box[z],width_frame,color_frame_up,false);
        }
      if(type_box[z]==-1)
        {
         if(square==true)func_create_square_or_rectangle(name_square,up_price[z],down_price[z],time_box[z-1],time_box[z],width_square,color_square_down,fill);
         if(frame==true)func_create_square_or_rectangle(name_frame,up_price[z],down_price[z],time_box[z-1],time_box[z],width_frame,color_frame_down,false);
        }
     }
  }
-->
3.9. 메인 차트의 "지그재그" 시공
표시기에 대한 다음 종류의 보완은 "지그재그" 차트 기능 또는 "func_draw_zig_zag"입니다.
입력 매개변수: 그리기 방식(최대 또는 최소 가격 또는 차트 포인트), 선 너비, 위 또는 아래 선 색상.
4개의 그림에서 "zig_zag_shadow" 파라미터 변경을 볼 수 있습니다. "true"가 켜져 있으면 표시기가 그림자 점에 "지그재그"선을 그립니다 (최소 및 최대 가격), "false"옵션에서 "지그재그"선이 "Renko"최대 및 최소 지점에 그려집니다 .
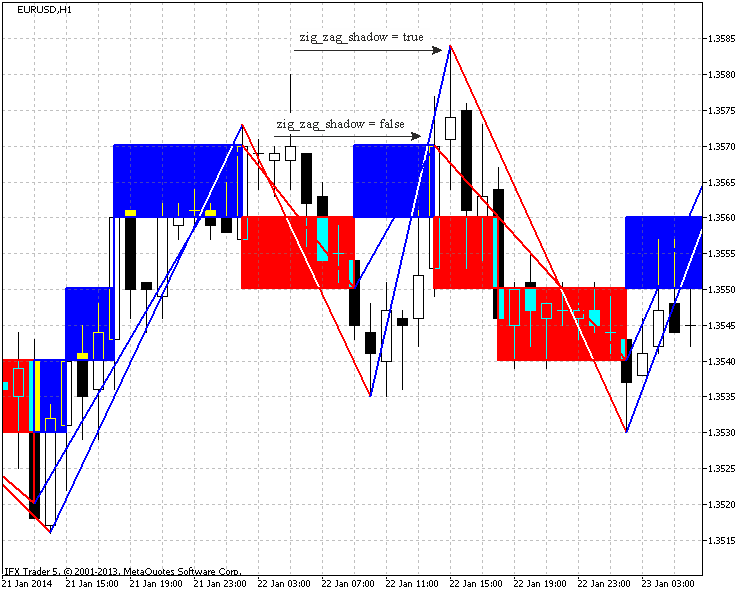
그림 4. EURUSD, H1, 10 포인트에 대한 "zig_zag_shadow" 매개변수의 영향.
"추세선" 개체를 구성하려면 두 지점(시작 및 끝)이 필요합니다. 가격 매개변수에 두 개의 변수를 입력하고 날짜 매개변수에 두 개의 변수를 입력합니다. If 조건문은 초기 벽돌 유형에 따라 첫 번째 점을 설정합니다.
모든 객체를 구성하는 루프가 시작됩니다. 보시다시피 루프는 첫 번째 포인트가 이미 설정되어 있으므로 두 번째 벽돌 분석에서 시작됩니다. 그런 다음 if 조건문은 벽돌의 유형(가격 행동)을 확인합니다. 오브젝트 이름의 변수가 채워지고 이동 변경에 따라 루프가 분할됩니다. 차례로 그리기 방법에 따라 두 가지 변형으로 나뉩니다.
최소 및 최대 가격에 표시되는 경우 Price_high[] 및 Price_low[] 데이터 배열은 가까운 최소 및 최대 포인트를 검색합니다. 가까운 바로 검색이 제한됩니다.
차트 포인트에서 눈금이 매겨지면 버퍼 배열에서 데이터가 할당됩니다.
"추세선" 구성 함수가 호출됩니다. 기능은 "지그재그"의 분석 및 차트 작성을 완료합니다.
//+------------------------------------------------------------------+
//| Func Draw Zig Zag                                                |
//+------------------------------------------------------------------+
void func_draw_zig_zag(bool price_shadow,
                       int line_width,
                       color line_color_up,
                       color line_color_down)
  {
   double price_1=0;
   double price_2=0;
   datetime date_1=0;
   datetime date_2=0;

   if(type_box[1]==1)price_1=down_price[1];
   if(type_box[1]==-1)price_1=up_price[1];
   date_1=time_box[1];
   int id=0; //  Low & High array storing variable
   int n=0;  // variable for name forming

   string name_line; //--- variable responsible for the "trend line" name

   for(int z=2; z<=a; z++)
     {
      if(type_box[z]!=type_box[z-1])
        {
         n++;
         name_line=IntegerToString(magic_numb)+"_Line_"+IntegerToString(n);
         if(type_box[z]==1)
           {
            if(price_shadow==true)
              {
               id=number_id[z-1];
               if((id-1)>0 && Price_low[id-1]<Price_low[id])id--;
               if(Price_low[id+1]<Price_low[id])id++;
               price_2=Price_low[id];
               date_2=(datetime)Date[id];
              }
            else
              {
               price_2=down_price[z-1];
               date_2=time_box[z-1];
              }
            func_create_trend_line(name_line,price_1,price_2,date_1,date_2,line_width,line_color_down);
            price_1=price_2;
            date_1=date_2;
           }
         if(type_box[z]==-1)
           {
            if(price_shadow==true)
              {
               id=number_id[z-1];
               if((id-1)>0 && Price_high[id-1]>Price_high[id])id--;
               if(Price_high[id+1]>Price_high[id])id++;
               price_2=Price_high[id];
               date_2=(datetime)Date[id];
              }
            else
              {
               price_2=up_price[z-1];
               date_2=time_box[z-1];
              }
            func_create_trend_line(name_line,price_1,price_2,date_1,date_2,line_width,line_color_up);
            price_1=price_2;
            date_1=date_2;
           }
        }
     }
  }
-->
3.10. 이전에 생성된 그래픽 개체 삭제
매직 넘버는 표시기의 개체를 결정하는 데 사용됩니다. 하나의 차트 및 개체 삭제 프로세스에서 여러 지표의 시작을 단순화합니다.
다음 함수는 객체 또는 "func_delete_objects"를 삭제하는 함수입니다. 이름(개체에 따라 설정: 추세선 또는 사각형)과 개체 수는 두 개의 입력 매개변수입니다. 이 기능은 객체를 선택하고 이미 지정된 이름을 가진 객체를 삭제합니다.
//+------------------------------------------------------------------+
//| Func Delete Objects                                              |
//+------------------------------------------------------------------+
void func_delete_objects(string name,
                         int number)
  {
   string name_del;
   for(int x=0; x<=number; x++)
     {
      name_del=name+IntegerToString(x);
      ObjectDelete(0,name_del);
     }
  }
-->
모든 지표 객체를 삭제하기 위한 모든 기능을 통합하는 기능이 생성되었습니다.
//+------------------------------------------------------------------+
//| Func All Delete                                                  |
//+------------------------------------------------------------------+
void func_all_delete()
  {
//--- the graphical objects calculating
   obj=ObjectsTotal(0,-1,-1);
//--- all indicator graphical objects deleting
   func_delete_objects(IntegerToString(magic_numb)+"_Line_",obj);
   func_delete_objects(IntegerToString(magic_numb)+"_Square_",obj);
   func_delete_objects(IntegerToString(magic_numb)+"_Frame_",obj);
//--- the chart redrawing
   ChartRedraw(0);
  }
-->
3.11. 레벨 생성 기능
레벨 생성을 위한 "func_create_levels" 기능은 지표 창에서 차트 표시를 단순화합니다. 생성된 레벨 수와 색상의 두 가지 입력 매개변수만 있습니다.
함수 본문에서 IndicatorSetInteger는 표시되는 레벨의 수를 설정하는 데 사용되며 각 레벨에 대한 가격과 색상이 설정됩니다.
//+------------------------------------------------------------------+
//| Func Create Levels                                               |
//+------------------------------------------------------------------+
void func_create_levels(int level_number,
                        color level_color)
  {
//--- set the number of levels in the indicator window
   IndicatorSetInteger(INDICATOR_LEVELS,level_number);
 which brick is taken to draw levels
   int k=0;
   if(a>level_number)k=a-level_number;
//--- set levels prices
   for(int z=0;(z<=level_number && k<=a); z++,k++)
     {
      IndicatorSetDouble(INDICATOR_LEVELVALUE,z,up_price[k]);
      IndicatorSetInteger(INDICATOR_LEVELCOLOR,z,level_color);
     }
  }
-->
3.12. 통합 기능
"func_consolidation" 기능은 모든 기능을 통합하기 위해 생성되었습니다.
함수는 실행된 모든 함수를 호출합니다.
//+------------------------------------------------------------------+
//| Func Consolidation                                               |
//+------------------------------------------------------------------+
void func_concolidation()
  {
//--- deleting all the graphical objects of the indicator
   func_all_delete();
//--- the current date
   date_stop=TimeCurrent();
//--- the initial date changing due to the restricted buffer size
   if((bars=Bars(_Symbol,time_frame,date_start,date_stop))>ArraySize(Price))
     {
      date_start=func_calc_date_start(date_start,date_stop);
      Alert("The initial date was changed due to the lack of the chart size");
      date_change=true;
      //--- calculation of bars on the taken timeframe
      bars=Bars(_Symbol,time_frame,date_start,date_stop);
     }
//---
   bool result_copy_price=func_copy_price(Price,time_frame,date_start,date_stop,type_price);
   bool result_copy_date=func_copy_date(Date,time_frame,date_start,date_stop);
//--- change the date parameter
   if(result_copy_price=true && result_copy_date==true)date_change=false;
//---
   if(zig_zag_shadow==true)
     {
      func_copy_price(Price_high,time_frame,date_start,date_stop,2);
      func_copy_price(Price_low,time_frame,date_start,date_stop,3);
     }
//---
   func_draw_renko(Price,Date,filter_number,shadow_print,type_step,step);
   if(zig_zag==true)func_draw_zig_zag(zig_zag_shadow,zig_zag_width,zig_zag_color_up,zig_zag_color_down);
//---
   func_draw_renko_main_chart(square_color_up,square_color_down,frame_color_up,frame_color_down,square_width,frame_width,square_draw,square_fill,frame_draw);
   func_create_levels(levels_number,levels_color);
//--- redraw the chart
   ChartRedraw(0);
  }
-->
3.13. OnCalculate() 및 OnChartEvent() 함수
OnCalculate() 함수를 진행하기 전에 새로운 바를 분석하는 "func_new_bar" 함수를 살펴보겠습니다.
IsNewBar에 설명된 단순화된 기능입니다.
//+------------------------------------------------------------------+
//| Func New Bar                                                     |
//+------------------------------------------------------------------+
bool func_new_bar(ENUM_TIMEFRAMES period_time)
  {
//---
   static datetime old_times; // array for storing old values
   bool res=false;            // analysis result variable
   datetime new_time[1];      // new bar time
//---
   int copied=CopyTime(_Symbol,period_time,0,1,new_time); // copy the time of the new bar into the new_time box
//---
   if(copied>0) // все ок. data have been copied
     {
      if(old_times!=new_time[0])    // if the bar's old time is not equal to new one
        {
         if(old_times!=0) res=true; // if it is not the first launch, true = new bar
         old_times=new_time[0];     // store the bar's time
        }
     }
//---
   return(res);
  }
-->
OnCalculate() 함수는 차트 업데이트 중에 새로운 바가 생성되는 경우 모든 함수의 통합을 시작합니다.
//+------------------------------------------------------------------+
//| Custom indicator iteration function                              |
//+------------------------------------------------------------------+
int OnCalculate(const int rates_total,
                const int prev_calculated,
                const int begin,
                const double &price[])
  {
//---
   if(func_new_bar(time_redraw)==true)
     {
      func_concolidation();
     }
//--- return value of prev_calculated for next call
   return(rates_total);
  }
-->
OnChartEvent() 함수는 "C"를 눌러 모든 그래픽 개체를 삭제하고 "R"을 누르면 차트 다시 그리기(통합 기능)가 시작됩니다.
//+------------------------------------------------------------------+
//| OnChartEvent                                                     |
//+------------------------------------------------------------------+
void OnChartEvent(const int id,         // event ID
                  const long& lparam,   // long type event parameter
                  const double& dparam, // double type event parameter
                  const string& sparam) // string type event parameter
  {
//--- Keyboard button pressing event
   if(id==CHARTEVENT_KEYDOWN)
     {
      if(lparam==82) //--- "R" key has been pressed
        {
         //--- call of the consolidation function
         func_concolidation();
        }
      if(lparam==67) //--- "C" key has been pressed
        {
         //--- deletion of all objects of the indicator
         func_all_delete();
        }
     }
  }
-->
3.14. OnDeinit() 함수
그리고 마지막으로 OnDeinit() 함수입니다. 이 기능은 표시기의 모든 그래픽 개체를 삭제하는 기능을 시작합니다.
//+------------------------------------------------------------------+
//| Custom indicator deinitialization function                       |
//+------------------------------------------------------------------+
void OnDeinit(const int reason)
  {
//--- delete all graphical objects of the indicator
   func_all_delete();
  }
-->
4. Renko 차트를 실제로 사용하기
Renko 차트는 가격 변동 전략에 따라 작성됩니다.
가장 인기 있는 전략부터 시작해 보겠습니다. 위쪽으로 이동하는 벽돌이 아래쪽으로 이동하기 시작할 때 매도하고 반대의 경우 구매합니다.
이것은 그림 5에 나와 있습니다.
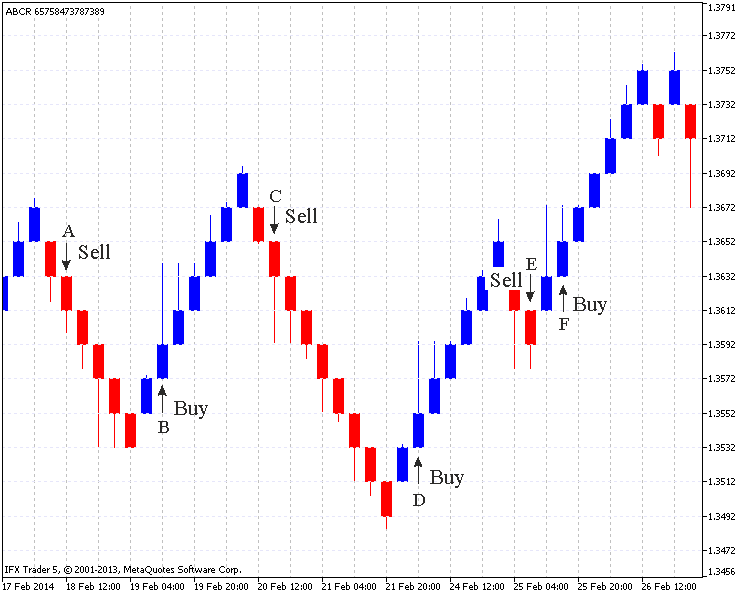
그림 5. 표준 Renko 차트(EURUSD H4, 20포인트)
그림 5는 시장 진입로의 6개 지점(A,B,C,D,E,F)을 보여주고 있습니다.
"A" 지점에서 위쪽 벽돌이 아래쪽 벽돌로 바뀝니다.
(B,C,D)점과 같이 반전된 벽돌이 한 번의 이동으로 생성됩니다. 그러나 "E" 지점에서는 동일한 레벨에서 다운 섀도우가 생성된다는 점에서 한 번의 이동으로 두 개의 벽돌이 생성되었습니다.
이 경우 "E"와 "F" 지점 사이에 진입이 가능합니다. 가격이 반대 방향으로 움직이기 때문에 성공적인 진입이 아닙니다. 유사한 상황은 "F" 지점에 있습니다. 한 번의 움직임으로 두 개의 벽돌이 생성됩니다. 위쪽 그림자는 같은 수준입니다. 강한 움직임에도 불구하고 가격은 방향을 바꾸지 않습니다.
암시하는 바는 시장에 가장 유리한 진입이 하나의 움직임으로 하나의 반전 벽돌(그림자 보기)이 생성될 때라는 것입니다. 한 번에 두 개의 벽돌을 만들면 이 입구가 안전하지 않을 수 있습니다.
이 차트에서 졸업하는 "지그재그"는 그래픽 분석에 사용할 수 있습니다. 그림 6은 "지지" 및 "저항" 선, "머리와 어깨" 모델 설정과 같은 몇 가지 예를 보여줍니다.
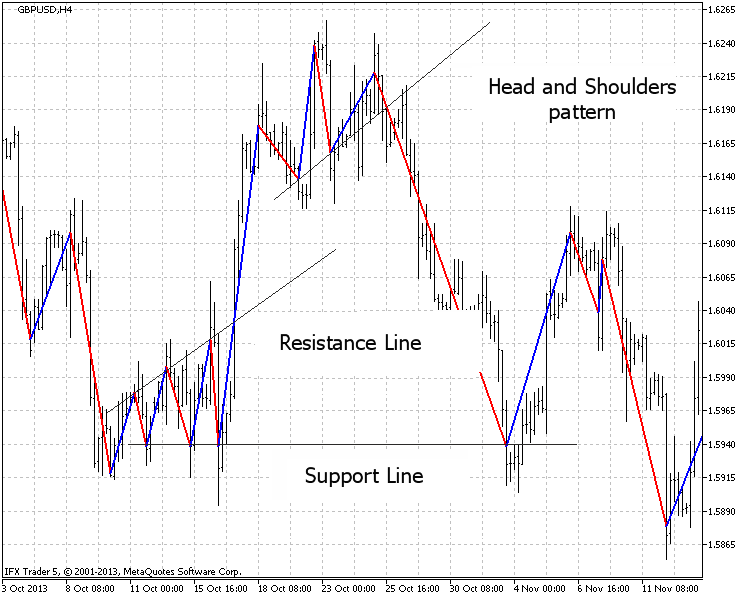
그림 6. 그래픽 분석(GBPUSD H4, 20포인트)
"등거리 채널" 그래픽 분석이 그림 7에 나와 있습니다.
표시기는 시간 프레임을 분석하도록 설정되며 눈금은 4시간 프레임에 표시됩니다.
이러한 설정을 사용하면 사용자가 여러 시간 프레임에서 동시에 신호를 따를 수 있습니다. 즉, 하나의 표시기는 한 시간 프레임에 사용되고 다른 하나는 두 번째 시간 프레임에 사용될 수 있음을 의미합니다.
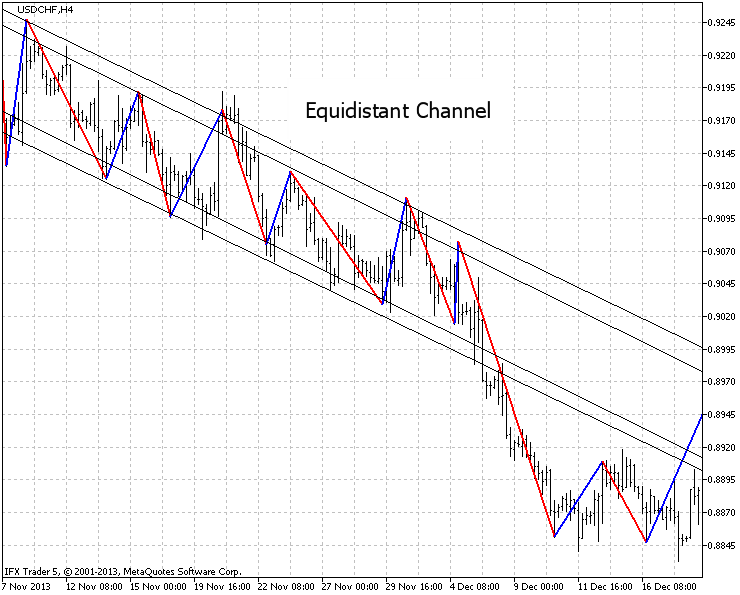
그림 7. "등거리 수로" USDCHF, H4, H1, 20개 설정의 분석.
그림 8은 하나의 차트에서 다른 시간대의 또 다른 예를 나타냅니다.
타임 차트는 가능한 가까운 반전을 보여주고, 4시간 차트는 쓸모없는 신호를 삭제하고, 일간 차트는 추세 움직임의 긴 기간을 승인합니다.
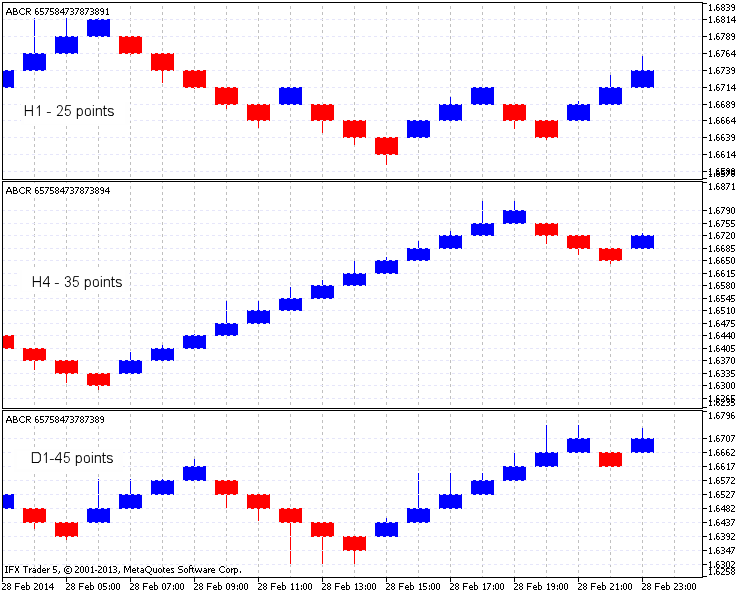
그림 8. GBPUSD, H1, H4 및 D1의 Renko 표시기
지표의 또 다른 예는 그림 9에 있습니다. 규칙은 다음과 같습니다. 가장 가까운 붉은 벽돌 사이에 최소한 하나의 파란색 벽돌이 있는 위쪽 선을 만들고 선 아래에 벽돌을 만든 후 판매합니다.
그리고 그 반대: 가장 가까운 파란색 벽돌 사이에 최소 하나의 빨간색 벽돌을 사이에 두고 아래쪽 선을 만들고 선 위에 벽돌을 만든 후 판매합니다.
색상은 그림 9에 따라 언급됩니다. 그림 9. 파란색과 빨간색 화살표는 선을 그리는 곳을 표시하고 큰 화살표는 판매 및 구매 신호를 표시합니다.
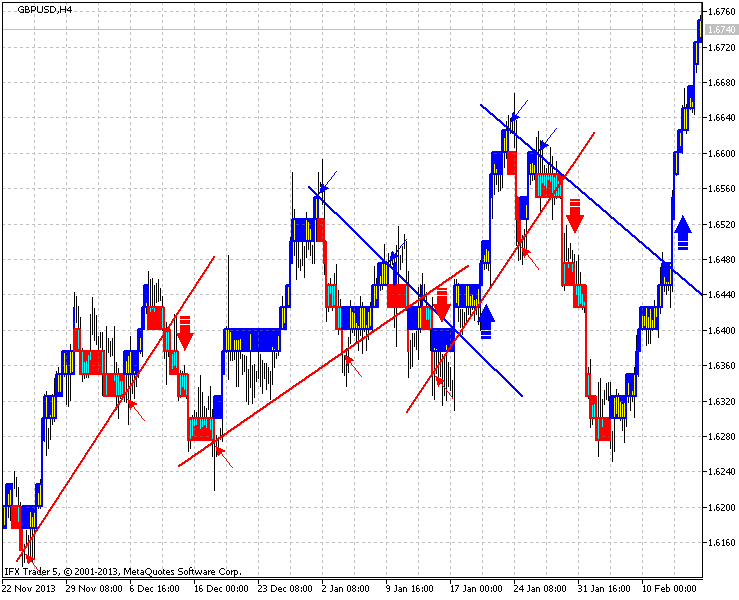
Fig.9. GBPUSD, H4, 25포인트 지표의 예
결론
Renko 차트는 초보자와 전문 트레이더에게 흥미롭습니다. 오랜 세월이 흘렀지만 여전히 시장에서 사용되고 있습니다.
이 글에서는 차트에 대한 관심을 끌고 Renko 차트 분석을 개선하고 싶었습니다. Renko 차트 구성의 자세한 방법을 보여 주려고했습니다.
저는 지표에 대한 새로운 아이디어와 개선 사항을 고려하고 아마도 미래에 구현하게 되어 기쁩니다. 표시기 구현에는 여러 가지 방법이 있으며 구현 방법도 찾을 수 있습니다.
관심 가져 주셔서 감사합니다! 성공적인 거래와 새로운 거래 전략 구현을 기원합니다.
MetaQuotes 소프트웨어 사를 통해 러시아어가 번역됨.
원본 기고글: https://www.mql5.com/ru/articles/792
경고: 이 자료들에 대한 모든 권한은 MetaQuotes(MetaQuotes Ltd.)에 있습니다. 이 자료들의 전부 또는 일부에 대한 복제 및 재출력은 금지됩니다.
이 글은 사이트 사용자가 작성했으며 개인의 견해를 반영합니다. Metaquotes Ltd는 제시된 정보의 정확성 또는 설명 된 솔루션, 전략 또는 권장 사항의 사용으로 인한 결과에 대해 책임을 지지 않습니다.
 MQL5 Expert Advisor의 GSM 모뎀 작업
 MQL5 Cookbook - MQL5의 다중 통화 Expert Advisor 및 대기 중인 주문 작업
 MetaTrader 5의 연속 선물 계약
표시기는 완벽하게 작동합니다. 하지만 코드에서 직접 변경해도 레벨의 색상을 없음(clrNONE / -1)으로 변경할 수 없습니다. 제 생각에 이 함수는 다음과 같습니다:
인디케이터셋인티저(인디케이터_레벨컬러,z,레벨컬러)
41번째 줄에서 https://www.mql5.com/ko/docs/constants/objectconstants/webcolors.  링크의 색상 중 하나로 변경하세요 ;
안녕하세요?
인디케이터를 다운로드했지만 잘 작동하지 않는 것 같습니다. 사진에서 무슨 일이 있었는지 알 수 있습니다.
이 지표를 Roboforex의 MT5에서 실행하지만 업로드 한 그림처럼 표시 할 수 없습니다. 즉, 이와 같은 기간의 차트에서 렌코 박스를보고 싶습니다.
이 표시기를 정상적으로 작동시키는 방법을 알려주시겠습니까? 대단히 감사합니다.
아마도 이전 데이터가 어떻게 든 연결되어있을 수 있으므로 차트를 닫고 지표를 열고 추가 할 수 있습니다. 그래도 작동하지 않으면 실행 방법을 작성하세요.
안녕하세요. 지표를 차트 창으로 드래그할 때 렌코 차트가 보이지 않는 분들을 위한 팁입니다. 키보드에서 "R" 키를 눌러 보세요. 저에게는 효과가 있었습니다. 건배!
고마워요, 친구! 여기서는 성공했어요, 고마워요!
Oups :( 방금 표시기가 다시 칠해진다는 것을 깨달았습니다 :(