
The NRTR indicator and trading modules based on NRTR for the MQL5 Wizard

Introduction
In this article we consider an indicator that builds a dynamic price channel. A trading Expert Advisor is created based on this channel. Such systems can perform well in trend periods, but give a lot of false signals in flat movements. Therefore additional trend indicators are required. Choosing an appropriate indicator is not an easy task, and the choice often depends on specific market conditions. Therefore, a good solution is to provide for a possibility to quickly connect any selected indicator to a ready trading system.
That's why we will use the following approach. We will create a special module of trading signals for the MQL5 Wizard. Later on we will be able to create a similar module based on any selected trend indicator to produce Yes/No signals indicating the presence or absence of a trend. A combination of multiple modules can be used when creating a trading system, so we can easily combine various indicators.
The NRTR Indicator
The idea of the NRTR (Nick Rypock Trailing Reverse) indicator was proposed by Konstantin Kopyrkin. Interesting information: the name Nick Rypock is derived from the surname Kopyrkin written backwards.
Let's get back to the indicator. It is a dynamic price channel. The author illustrates its main idea with the following figure:

A trading system based on the NRTR indicator belongs to breakout strategies. A buy signal is generated when price exceeds the previous high registered for a certain period; a sell signal is generated when the price falls below low. During trend change, such systems may use past highs and lows of the previous trend. To avoid this, the calculation period is set dynamically in our system.
The author has defined NRTR as a trend indicator of dynamic price channel breakout.
The indicator operation principle is as follows: in the uptrend, the indicator line (channel) is positioned at a certain level below the high price detected in a specified time interval. The downtrend line is positioned above prices, at a constant distance from the price low registered in a certain time interval.
The period of the price channel used for the indicator calculation is increased dynamically starting with the trend origin. Thus, the price of the previous calculation period does not affect the indicator.
The figure shows that the indicator first follows the trend at a certain distance. Then the indicator is located at a fixed distance from local highs H1 and H2. The local high H3 is lower than the previous one and is not used in calculations.
Then the price breaks the channel at point L3. It is a Sell signal. The value at point L3 is set as a new low. The new period starts at this point, i.e. all previous prices are reset and are not used in further calculations. As the trend develops, the low is updated to L3-L4-L5. The period of the dynamic price channel is extended until the trend changes or the period length reaches the allowed maximum.
The channel width is calculated as a percentage of the extreme value or may depend on price volatility. Both approaches are implemented in this article.
A Buy/Sell signal is generated when the price breaks through the channel line. A Buy signal is formed when the price breaks though the support line. A Sell signal is formed if the resistance line is broken.
Now, we need to translate the description of the indicator operation principles to MQL5. Let's begin.
Writing an Indicator: from Simple to Complex
First of all we need to define the indicator behavior. The indicator will be based on Close prices. Indicator values based on history data are interpreted unambiguously. But what if the price breaks the support/resistance line on an incomplete candlestick? In this version, the trend is not formed and no signal is therefore produced until the candlestick formation completes. On the one hand, we can miss part of the movement. For example, if the movement starts with a huge candlestick that breaks the channel, a position will only be opened at the next candlestick. On the other hand, this is a protection against numerous false breakouts.
NB: the indicator has a lot of variation; the original version proposed by the author is described in this article.
An implementation of the indicator is available in the CodeBase, but its period is only partially dynamic. The period is reset when trend changes, but it can be extended endlessly in theory. I.e. the support line is calculated as MathMax() of the previous value and the current close price. In this case, the support line can only be rising, while the resistance line is always falling. In the original version, all earlier values are considered as obsolete and are therefore ignored. Here max/min are calculated as ArrayMaximum/Minimum(close,i,dynamic_period). In this approach, both support and resistance lines can be rising and falling. Therefore, the support line can drift down deeply in some cases in slow sideways movements, when dynamic periods are short. But such smooth long-term trends are rare, and neither method is ideal. In this article, we stick to the original idea proposed by the indicator author.
The next reservation is connected with timeseries. Price series (close) in MQL5 have the default value ArraySetAsSeries = false. Price series in MQL4 have a timeseries flag, and their Close[0] value is the close price of the rightmost bar (while the leftmost bar is not visible as a rule). Please note that in this article ArraySetAsSeries(close,true).
Let us now proceed to implementing the indicator. We will work with four indicator buffers: two of them will be used for support/resistance lines, and the other two will be used for buy and sell signals.
#property indicator_chart_window
#property indicator_buffers 4
#property indicator_plots   4

//Indicators lines style
#property indicator_type1  DRAW_LINE
#property indicator_color1 Green
#property indicator_style1 STYLE_DASH

#property indicator_type2  DRAW_LINE
#property indicator_color2 Red
#property indicator_style2 STYLE_DASH

#property indicator_type3  DRAW_ARROW
#property indicator_color3 Green

#property indicator_type4  DRAW_ARROW
#property indicator_color4 Red
Let's declare indicator buffers and external parameters of the indicator
input int    period =12;      //dynamic period
input double percent =0.2;    //percent of indent

double Buff_Up[],Buff_Dn[];
double Sign_Up[],Sign_Dn[];
The indicator signals will appear as arrows on the chart. The remaining parameters are set in the OnInit() function. I used DRAW_ARROW with parameter 236,238 from Wingdings font characters. Parameters of the "Up" signal:
   SetIndexBuffer(2,Sign_Up,INDICATOR_DATA);
   PlotIndexSetDouble(2,PLOT_EMPTY_VALUE,0.0);
   PlotIndexSetInteger(2,PLOT_ARROW,236);
   PlotIndexSetInteger(2,PLOT_LINE_WIDTH,1);
   ArraySetAsSeries(Sign_Up,true);
At the beginning of calculations in OnCalculate(), we check the availability of the required data and the first indicator calculation start.
//+------------------------------------------------------------------+
//| Custom indicator iteration function                              |
//+------------------------------------------------------------------+
int OnCalculate(const int rates_total,
                const int prev_calculated,
                const datetime &time[],
                const double &open[],
                const double &high[],
                const double &low[],
                const double &close[],
                const long &tick_volume[],
                const long &volume[],
                const int &spread[])
{

  int start =0;                                           //calculation point

  int trend =0;                                           //trend value, 1 for up and -1 for down
  static int trend_prev =0;

  double value =0;                                        //indicator values
  static double value_prev =0;

  int dyn_period =1;                                     //period values
  static int curr_period =1;


  double maxmin =0;                                       //a technical variable for calculations

  ArraySetAsSeries(close,true);

  if(rates_total<period) return(0);

     if(prev_calculated==0)                              // checking for the first start of the indicator calculation
  {
      start=rates_total-1;                               // starting index for the calculation of all bars
      trend_prev =1;
      value=close[start]*(1-0.01*percent);
  }

  else
     {
      start=rates_total-prev_calculated;                  // starting index for the calculation of new bars
     }

trend =trend_prev;
value =value_prev;
dyn_period =curr_period;
The main variables are also defined here. Two variables are defined for the trend and channel values. One of these variables is static. A static variable will store the value until the next calculation cycle. The variable will only change on a completely formed bar. If the price breaks through the channel on an unformed bar, only local non-static variables are changed. If the price returns to the channel, the previous trend will be preserved.
Now let's write the main calculation loop taking into account the remarks described above.
trend =trend_prev;
value=value_prev;
dyn_period =curr_period;
//-------------------------------------------------------------------+
//                        The main calculation loop
//-------------------------------------------------------------------+
for(int i=start;i>=0;i--)
{
    Buff_Up[i] =0.0;
    Buff_Dn[i] =0.0;
    Sign_Up[i] =0.0;
    Sign_Dn[i] =0.0;

    if(curr_period>period) curr_period=period;
    if(dyn_period>period) dyn_period=period;

 //if trend ascending
    if(trend>0)
    {
    maxmin =close[ArrayMaximum(close,i,dyn_period)];
    value =maxmin*(1-percent*0.01);

    if(close[i]<value)
      {
      maxmin =close[i];
      value =maxmin*(1+percent*0.01);
      trend =-1;
      dyn_period =1;
      }
    }

//  if trend descending
    else
    {
    maxmin =close[ArrayMinimum(close,i,dyn_period)];
    value =maxmin*(1+percent*0.01);
    if(close[i]>value)
      {
      maxmin =close[i];
      value =maxmin*(1-percent*0.01);
      trend =1;
      dyn_period =1;
      }
    }
 // trend changes

      if(trend>0) Buff_Up[i] =value;
      if(trend<0) Buff_Dn[i] =value;

      if(trend_prev<0  &&  trend>0)
      {
      Sign_Up[i] =value;
      Buff_Up[i] =0.0;
      }
      if(trend_prev>0 && trend<0)
      {
      Sign_Dn[i] =value;
      Buff_Dn[i] =0.0;
      }

  dyn_period++;

  if(i)
  {
  trend_prev =trend;
  value_prev =value;
  if(dyn_period==2)curr_period =2;
  else curr_period++;
  }

}
The dynamic period in this loop is limited to a specified value. If the Close price breaks through the channel, new support and resistance values are found and a check is performed whether the trend has changed. The last if() operator checks whether the bar is fully formed. Only if the bar is completely formed, the values of trend_prev and value_prev are updated, and therefore a buy/sell signal can be generated. The dynamic period can also be reset here.
The full indicator code is available in the attached NRTR.mq5 file.
Let's check the indicator operation by launching on one chart two NRTRs with different parameters: the first NRTR has the period of 12 and the width of 0.1%; the second NRTR's period is 120 and the width is 0.2%.
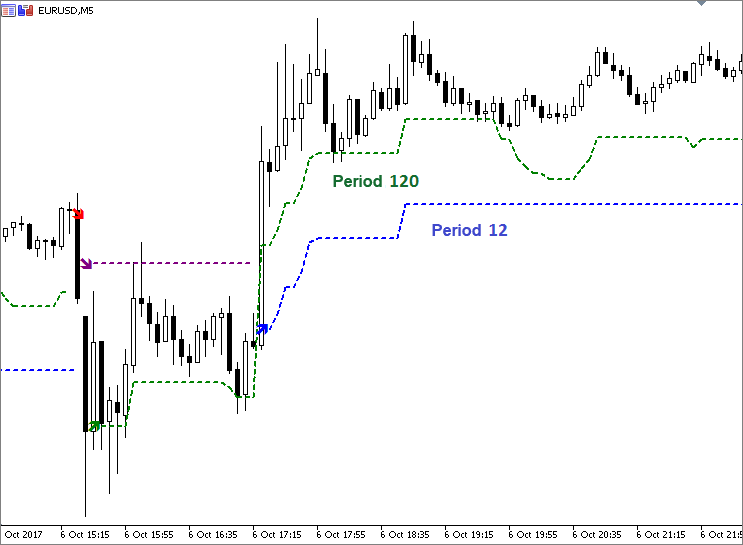
The above figure shows that if a period is small, the support line can be both rising and falling. It is connected with the fact that price values fall beyond the dynamic period. If the period is large, the support line is usually nondecreasing.
Volatility and NRTR
In the previous approach we used a fixed price channel deviation percent. A more logical solution is to expand the channel when volatility increases and to narrow it when volatility falls. ATR (Average True Range) is a popular indicator for determining market volatility. The ATR value can be used for setting the channel width. You can calculate the ATR value yourself or use the standard technical indicator from the terminal.
Let's replace the deviation percentage with the ATR indicator value in order to link the channel width to market volatility. A coefficient will still be used for scaling. Let's set it to 1 by default. We declare an additional indicator buffer for the ATR indicator: double Buff_ATR[]. The percent parameter is replaced with the coefficient K =1. Let's create a pointer to ATR for receiving its values:
handle_atr =iATR(_Symbol,PERIOD_CURRENT,period);
The ATR period can differ from the active dynamic period. A logical solution is to make them equal, so that the number of parameters is not changed.
Here is the code of newly added lines.
#property indicator_buffers 5
#property indicator_plots   4
.............................
input double K =1;            //scale coefficient
double Buff_ATR[];
int handle_atr;
.............................
SetIndexBuffer(4,Buff_ATR,INDICATOR_CALCULATIONS);
ArraySetAsSeries(Buff_ATR,true);

handle_atr =iATR(_Symbol,PERIOD_CURRENT,period);
.....................................................
int OnCalculate(){
.....................................................
  if(CopyBuffer(handle_atr,0,0,start+1,Buff_ATR)==-1)
  {
  return(0);
  Print("Copying data to the ATR buffer failed");
  }
.....................................................

//if trend ascending
  if(trend>=0)
  {
  maxmin =close[ArrayMaximum(close,i,dyn_period)];
  value =maxmin-K*Buff_ATR[i];

  if(close[i]<value)
   {
   maxmin =close[i];
   value =maxmin+K*Buff_ATR[i];
   trend =-1;
   dyn_period =1;
   }
  }

}
The channel line values are calculated using the formula value = maxmin(+-)K*Buff_ATR[i], respectively. The full indicator code is available in the attached NRTRvolatile.mq5 file.
Let's run both indicators with the same parameters on one chart, and compare their behavior.
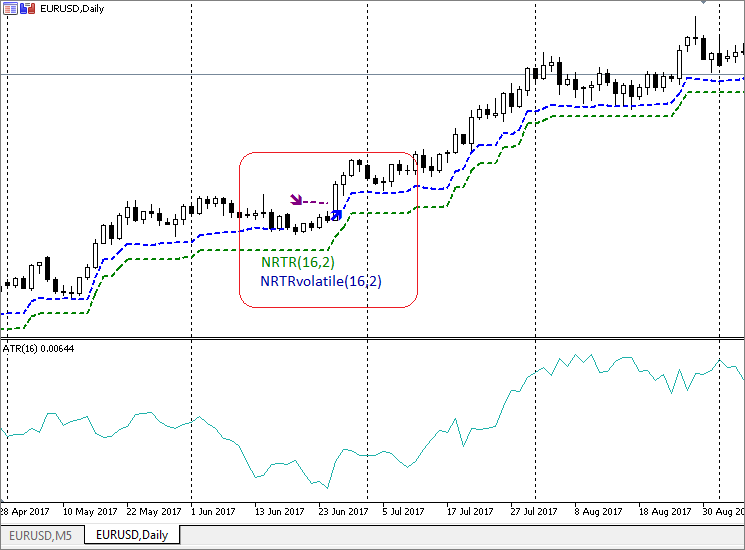
The figure shows that if volatility is low and ATR values are small, the NRTRvolatile line is almost "snapped" to the price charts. Then, the line moves away from the price when volatility increases.
Now let's move on to creating an Expert Advisor based on this indicator. As mentioned above, we will use a module of trading signals.
A Trading Module for the MQL5 Wizard
Sometimes it is more convenient to write such modules based on existing ones using the copy/paste method. But in our case, it's better to start from the very beginning instead of describing all places to be replaced or modified.
Below is the common structure of all modules.
- Module descriptor
- Trading parameters and parameter initialization functions
- Checking input parameters
- Connecting a selected indicator to the module
- Description of the trading strategy
First of all, let's create a separate sub-folder in the signals folder to store our own signals. For example, Include\Expert\MySignals. Right-click the selected folder and select "New File" in the context menu. The MQL5 Wizard opens. Select "New class" from the menu. Call it NRTRsignal. All signals are inherited from the base CExpertSignal class, so let's indicate it in the Wizard.
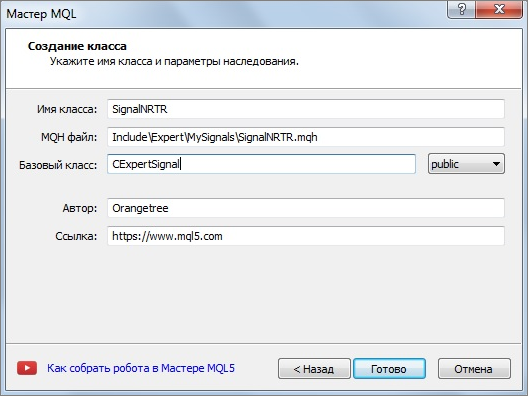
Add the path to the CExpertSignal base class to the code generated by the Wizard: #include "..\ExpertSignal.mqh"
//+------------------------------------------------------------------+
//|                                                   SignalNRTR.mqh |
//|                                                       Orangetree |
//|                                             https://www.mql5.com |
//+------------------------------------------------------------------+
#property copyright "Orangetree"
#property link      "https://www.mql5.com"
#property version   "1.00"

#include "..\ExpertSignal.mqh"              // the CExpertSignal class
//+------------------------------------------------------------------+
//|                                                                  |
//+------------------------------------------------------------------+
class SignalNRTR : public CExpertSignal
  {
private:

public:
                     SignalNRTR();
                    ~SignalNRTR();
  };
//+------------------------------------------------------------------+
//|                                                                  |
//+------------------------------------------------------------------+
SignalNRTR::SignalNRTR()
  {
  }
//+------------------------------------------------------------------+
//|                                                                  |
//+------------------------------------------------------------------+
SignalNRTR::~SignalNRTR()
  {
  }
//+------------------------------------------------------------------+
That was the beginning.
Now we need to create a module descriptor so that the MQL5 Wizard could recognize this code as a module of signals.
// wizard description start
//+------------------------------------------------------------------+
//| Description of the class                                         |
//| Title=Signals of indicator 'NRTR'                                |
//| Type=SignalAdvanced                                              |
//| Name=NRTR                                                        |
//| ShortName=NRTR                                                   |
//| Class=SignalNRTR                                                 |
//| Page=????                                                        |
//| Parameter=PeriodDyn,int,12,Dynamic channel period                |
//| Parameter=PercentDev,double,0.1,Channel width in percent         |
//+------------------------------------------------------------------+
// wizard description end
//+------------------------------------------------------------------+
//| Class SignalNRTR.                                                |
//| Purpose: Class of generator of trade signals based on            |
//|          the 'NRTR' indicator.                                   |
//| Is derived from the CExpertSignal class.                         |
//+------------------------------------------------------------------+
The descriptor starts with "wizard description start" and ends with "wizard description end". The module name and external parameters are contained inside. As soon as we compile this module together with the descriptor, it will be added to the Wizard menu: New file/Expert Advisor (generate)/Common parameters/Signal properties of the Expert Advisor/Add.

Let's add to our class variables for storing external parameters and methods for initializing them.
The names of methods for initializing external parameters must match the names of external parameters written in the descriptor.
class SignalNRTR : public CExpertSignal
  {
protected:
   int m_period_dyn;                                   //Channel period
   double m_percent_dev;           //Channel width as a percentage of the price

public:
                     SignalNRTR();
                    ~SignalNRTR();
   //--- methods of setting adjustable parameters
   void              PeriodDyn(int value)                 { m_period_dyn=value;}
   void              PercentDev(double value)             { m_percent_dev=value;}

  };
//+------------------------------------------------------------------+
//|                                                                  |
//+------------------------------------------------------------------+
SignalNRTR::SignalNRTR() : m_period_dyn(12),
                           m_percent_dev(0.1)
  {
  //--- initialization of protected data
   m_used_series=USE_SERIES_OPEN+USE_SERIES_HIGH+USE_SERIES_LOW+USE_SERIES_CLOSE;
  }
Class members are initialized using the initialization list. The "private" methods that were generated by the Wizard can be replaced with "protected", however it is not necessary.
The virtual bool ValidationSettings() method in the CExpertBase class allows checking the correctness of inputs.
We need to add to our class the method prototype and override it. For example, we will need to verify that the period is greater than one and the deviation percent value is positive.
//+------------------------------------------------------------------+
//| The method checks input parameters                                |
//+------------------------------------------------------------------+
bool SignalNRTR:: ValidationSettings()
  {
   // Call the base class method
   if(!CExpertSignal::ValidationSettings())  return(false);

   // The period must be greater than 1
   if(m_period_dyn<2)
   {
   Print(The period must be greater than 1);
   return false;
   }
   // The channel width value must be positive
   if(m_percent_dev<=0)
   {
   Print("The channel width value must be positive");
   return false;
   }

   return true;
  }
Please note that the base class method is called first.
Next, we use the InitIndicators() method for connecting a selected indicator to our module. Let's create the method prototype in our class: virtual bool InitIndicators(CIndicators *indicators), and then add its description. We will use standard procedures for checking indicator pointers and initialize indicators and timeseries in additional filters.
//+------------------------------------------------------------------+
//| Create indicators.                                               |
//+------------------------------------------------------------------+
bool SignalNRTR::InitIndicators(CIndicators *indicators)
   {
//--- check pointer
   if(indicators==NULL)
      return(false);
//--- initialization of indicators and timeseries of additional filters
   if(!CExpertSignal::InitIndicators(indicators))
      return(false);
//--- create and initialize NRTR indicator
if(!InitNRTR(indicators))
      return(false);
//--- ok
   return(true);
   }
Let's create and initialize the indicator in the InitNRTR(indicators) line. It is also necessary to add the prototype and description of the InitNRTR(indicators) function .
//+------------------------------------------------------------------+
//| Create NRTR indicators.                                          |
//+------------------------------------------------------------------+
bool SignalNRTR::InitNRTR(CIndicators *indicators)
   {
//--- check pointer
   if(indicators==NULL)
      return(false);
//--- add object to collection
   if(!indicators.Add(GetPointer(m_nrtr)))
     {
      printf(__FUNCTION__+": error adding object");
      return(false);
     }
//--- Setting NRTR parameters
   MqlParam parameters[3];
//---
   parameters[0].type=TYPE_STRING;
   parameters[0].string_value="Orangetree\\NRTR.ex5";
   parameters[1].type=TYPE_INT;
   parameters[1].integer_value=m_period_dyn;      // Period
   parameters[2].type=TYPE_DOUBLE;
   parameters[2].double_value=m_percent_dev;      // Channel width
//--- initialize object
   if(!m_nrtr.Create(m_symbol.Name(),m_period,IND_CUSTOM,3,parameters))
     {
      printf(__FUNCTION__+": error initializing object");
      return(false);
     }
//--- ok
   return(true);
   }
The indicator is created using the MqlParam structure and the Create() method.
We have prepared the required code. Now we need to write a trading algorithm. Let's use the LongCondition() and ShortCondition() methods. Let's add methods for receiving indicator signals.
   //--- methods of getting data
   double            UpSignal(int index)                   { return(m_nrtr.GetData(2,index));}
   double            DnSignal(int index)                   { return(m_nrtr.GetData(3,index));}
The GetData() function receives the value of the indicator buffer based on its index and the bar index. The indicator already contains the trend reversal signal. That is why conditions for position opening are simple. We buy if the indicator generates an "up" signal and sell if a "down" signal is generated.
//+------------------------------------------------------------------+
//| "Voting" that price will grow.                                   |
//+------------------------------------------------------------------+
int SignalNRTR::LongCondition(void)
   {
   int idx   =StartIndex();
   if(UpSignal(idx))
      return 100;
   else return 0;
   }
//+------------------------------------------------------------------+
//| "Voting" that price will fall.                                   |
//+------------------------------------------------------------------+
int SignalNRTR::ShortCondition(void)
   {
   int idx   =StartIndex();
   if(DnSignal(idx))
      return 100;
   else return 0;
   }
In addition to defining the trading algorithm, these functions set its behavior characteristics. The StartIndex() function is used.
The description of the virtual int StartIndex() function contains the following statement: "The method returns 0 if the flag to analyze current bar is set to true (analysis from the current bar). If the flag is not set, it returns 1 (analysis from the last completed bar)." Our system only analyzes signals on a completely formed bar. The StartIndex() function returns 1 by default, just in accordance with our strategy. This feature will be reflected in the resulting Expert Advisor as the parameter Expert_EveryTick set to false.
The step of creation of the trading signals module is finished.
Let's use the Strategy Tester to test the EA operation.
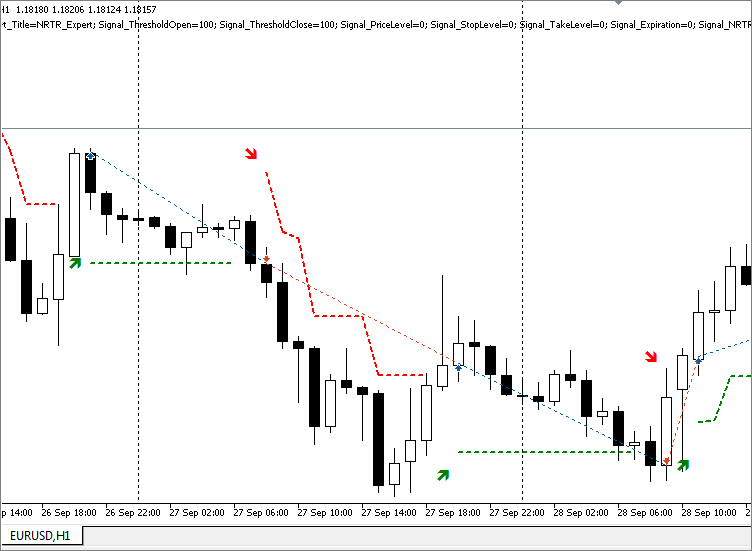
In addition, let's optimize trading parameters. For optimization, we use data for 25.09.17 — 18.10.17 on EURUSD with the H1 timeframe. Only the following indicator parameters are optimized: the period and width of the channel. Stop Loss and Take Profit values are set to 0.
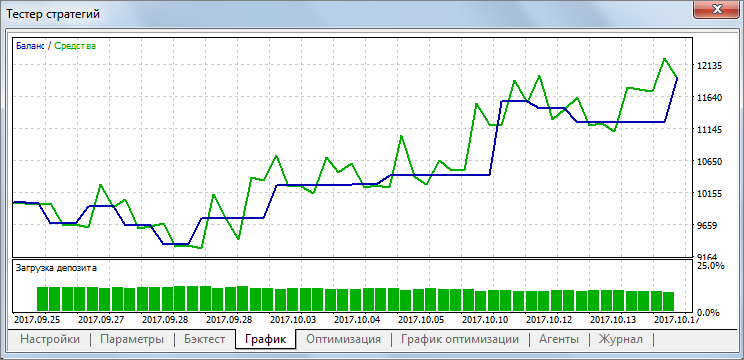
The figure shows the result for the period of 48 with the channel width set to 0.25%.
Combining NRTR with Different Trend Indicators
Suppose, we require the confirmation of our indicator signals. The indicator works well during trend, therefore let's add a trend indicator. In this article we provide ready-to use signals modules from the MQL5 Wizard. So, let's proceed with the same method and add a trend indicator though a signals module.
Identifying a trend is not an easy task. Therefore, we will not discuss which of the trend indicators are better or worse. Let's choose any standard trend indicator from the terminal, because our main goal is to work out a technique for connecting an indicator using a trading module. We are not interested in the trading result at this step.
All steps of module creation were described in the previous section. Hence, it is more convenient to use the "copy/paste" method here and to evaluate its advantages. Let's use a ready module and replace the necessary lines.
Let's choose the ADX technical indicator from the Trend category. The specially reserved CiADX pointer can be used to refer to the indicator, instead of the pointer to a custom indicator CiCustom. Accordingly, there is a slightly different way to create it through the Create method, and it is not necessary to specify a path to it.
protected:
   CiADX m_adx;                                    // object-indicator
   int m_period_adx;                               //ADX Period
....................... other code.....................................

//--- initialize object
   if(!m_adx.Create(m_symbol.Name(),m_period,m_period_adx))
     {
      printf(__FUNCTION__+": error initializing object");
      return(false);
     }
The indicator has only one parameter of period. It should be reflected in the module descriptor and parameter setting functions. We also need to add functions for obtaining the values of ADX buffers.
//| Parameter=PeriodADX,int,14,ADX indicator period
.....................................................

//--- methods of setting adjustable parameters
void              PeriodADX(int value)                { m_period_adx=value;}
.....................................................

//--- methods of getting data
double            MainADX(int index)                   { return(m_adx.Main(index));}
double            ValueIDPlus(int index)               { return(m_adx.Plus(index));}
double            ValueIDMinus(int index)              { return(m_adx.Minus(index));}
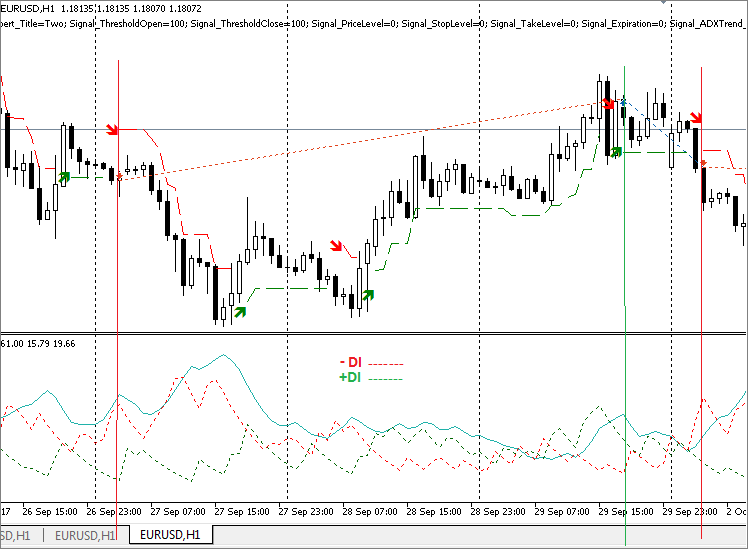
We actually pass through all steps described in the trading module creation section. We replace NRTR with ADX where necessary. Let's use standard trading conditions described in the ADX indicator without checking them. The classical indicator offers the following conditions:
- Buy if +DI >-DI and ADX is growing.
- Sell if +DI <-DI and ADX is growing.
//+------------------------------------------------------------------+
//| "Voting" that trend is "Down".                                   |
//+------------------------------------------------------------------+
int SignalADX::LongCondition(void)
   {
   int idx   =StartIndex();
   if(ValueIDPlus(idx)>ValueIDMinus(idx)&&MainADX(idx)>MainADX(idx+1))
      return (100);
   else
      return (0);
   }
//+------------------------------------------------------------------+
//| "Voting" that trend is "UP".                                    |
//+------------------------------------------------------------------+
int SignalADX::ShortCondition(void)
   {
   int idx   =StartIndex();
   if(ValueIDPlus(idx)<ValueIDMinus(idx)&&MainADX(idx)>MainADX(idx+1))
      return (100);
   else
      return (0);
   }
This is the basic principle. We generate a buy signal, if we think that the indicator shows an uptrend, a sell signal should be generated if the trend is falling. The signal weight is set to 100 for convenience.
Let's open the MQL5 Wizard again. When creating an Expert Advisor, choose two trading signals, including SignalNTRTR and ADXTrendSignal. If multiple signals are used, their average value is calculated. Therefore we assign weight factors equal to one to both signals. The threshold value for opening is set to 100. All other parameters except for the channel with are reset to zero. We launch the Strategy tester to make sure that the Expert Advisor runs correctly.
Conclusion
Let's sum up. We have discussed the trend indicator of dynamic price channel breakout NRTR. Two versions of the indicator have been developed: the one with a fixed percent of trendline deviation from price extremes and the other one with deviations values depending on the market volatility.
Both versions of the indicator are attached below. A module of trading signals has been created based on NRTR, and an Expert Advisor has been generated using the MQL5 Wizard.
The ADX indicator module has been created to visualize an example of a joint use of the NRTR indicator with trend indicators. A test Expert Advisor based on NRTR + ADX has been created in the MQL5 Wizard. The combination of NRTR + a trend indicator has been optimized, because the selection of a trend indicator is up to the user and is not described in this article. The approach is based on a modular and combinational philosophy.
When using the attached files, make sure to correctly specify the path to indicators and trading signals in accordance with their installation folder. For example, for SignalNRTR in my case:
parameters[0].string_value="NRTR.ex5";
Specify the path in accordance with the installation folder of your indicators.
Files:
| # | Name | Type | Description |
|---|---|---|---|
| 1 | NRTR.mq5 | Indicator | The source code of the analyzed indicator |
| 2 | NRTRvolatile.mq5 | Indicator | The source code of the indicator that takes into account price volatility |
| 3 | SignalNRTR.mqh | Trading module | A module of trading signals. It is used for generating Expert Advisors in the MQL5 Wizard |
| 4 | ADXTrendSignal.mqh | Trading module | A test module of the trend indicator |
Files in the MQL5.zip folder are located in accordance with MetaEditor directories.
Translated from Russian by MetaQuotes Ltd.
Original article: https://www.mql5.com/ru/articles/3690
Warning: All rights to these materials are reserved by MetaQuotes Ltd. Copying or reprinting of these materials in whole or in part is prohibited.
This article was written by a user of the site and reflects their personal views. MetaQuotes Ltd is not responsible for the accuracy of the information presented, nor for any consequences resulting from the use of the solutions, strategies or recommendations described.

 Creating a custom news feed for MetaTrader 5
 Momentum Pinball trading strategy
- Free trading apps
- Over 8,000 signals for copying
- Economic news for exploring financial markets
You agree to website policy and terms of use
Is it possible to upgrade NRTRvolatile so that a message box pops up when an arrow is added?
Is it possible to upgrade NRTRvolatile so that a message box pops up when adding an arrow?
Perhaps in the LongCondition and ShortCondition functions.
to add something like Alert"Text". I don't know if it will work. The thing is that I don't have this code on my computer anymore. Everything that I had last year I put away in the past:) So I can't try it. And I still have New Year's Eve ringing in my head :)
In the indicator itself, somewhere around here
The path to the includefiles should be corrected to
#include <Expert\\ExpertSignal.mqh>both variants are possible. Right variant
#include <Expert\ExpertSignal.mqh>you can see it in another modules in folder Include\Expert\Signal