
Testing patterns that arise when trading currency pair baskets. Part II

Introduction
We continue testing the patterns that arise when trading currency pair baskets. In the previous article, we examined the overbought/oversold level breakthrough pattern. The level breakthrough was considered using the combined WPR indicator as an example. This experience can be extended to other combined indicators based on oscillators. We assume, the result will be similar.
The result of the conducted test was an evaluation of the oversold/overbought levels location. For the overbought level, the value ranges from 60 to 70%, while for the oversold level, it varies from -60% to -70%. Testing the pattern operation showed its profitability on H4 for all currency pair baskets. The D1 interval saw a small amount of trades. H1 suffered a significant loss.
In this article, we will try to apply the moving average (MA) to the graphs of the combined indicators and use it in trade. We will continue to rely on both standard technical analysis and our own methods.
Research tools
Our main tool is a well-known combined WPR with the period of 20. Run МА with a period of 10 on its graph. We have selected such a short period value since we are not going to monitor global processes: we are interested in local trends. Therefore, long periods are not considered.
Let's examine the timeframes H1, H4 and D1, just like in the previous article. We remember the results of the first pattern on them. Therefore, it would be reasonable to consider the following one on the same timeframes as well. And, of course, let's not forget that the accumulated experience can be used for research on any other timeframes and currency baskets.
The basic terminology and principles can be found here.
Research pattern
This pattern is well known from the classical technical analysis. We have already described it, so let's recall the main features of trading currency baskets:
- A trader receives an entry signal when the unified indicator graph crosses the moving average.
There are two signals:
- Currency pair buy signal — when МА graph crosses the unified indicator upwards.
- Currency pair sell signal — when МА graph crosses the unified indicator downwards.
- A trader enters the market buying or selling the currency basket, for which the signal has been received.
- The trader exits the market after receiving a signal opposite to the entry one.
Besides, keep in mind that signals from the moving average usually lag behind.
As we remember from applying MA to charts of ordinary currency pairs, there are plenty of entry signals for fast moving averages. We expect that there will be enough signals in this case as well. To check this, we have developed testWPR&MA.mq5 attached below.
//+------------------------------------------------------------------+
//|                                                      testWPR.mq5 |
//|                                        MetaQuotes Software Corp. |
//|                                             https://www.mql5.com |
//+------------------------------------------------------------------+
#property copyright "Copyright 2016, MetaQuotes Software Corp."
#property link      "https://www.mql5.com"
#property version   "1.00"
#property indicator_separate_window
#property indicator_minimum -100
#property indicator_maximum 100


#define LG 7

#property indicator_buffers 2
#property indicator_plots   2

input int WPR       = 20; //Period WPR
input int maperiod  = 10; //Period MA
input color   clr   = clrGreen;
input color   clrMA = clrMagenta;

string pair[]={"EURUSD","GBPUSD","AUDUSD","NZDUSD","USDCAD","USDCHF","USDJPY"};
bool bDirect[]={false,false,false,false,true,true,true};

int h[LG];
double ind[],ma[];

int iUp,iDw;
//+------------------------------------------------------------------+
//| Custom indicator initialization function                         |
//+------------------------------------------------------------------+
int OnInit()
  {
//--- indicator buffers mapping
   for(int i=0; i<LG; i++)
     {
      h[i]=iWPR(pair[i],0,WPR);
     }

   IndicatorSetString(INDICATOR_SHORTNAME,"testWPRusd");
   IndicatorSetInteger(INDICATOR_DIGITS,2);
   IndicatorSetInteger(INDICATOR_LEVELS,2);
   IndicatorSetInteger(INDICATOR_LEVELSTYLE,0,STYLE_SOLID);
   IndicatorSetInteger(INDICATOR_LEVELSTYLE,1,STYLE_SOLID);
   IndicatorSetInteger(INDICATOR_LEVELCOLOR,0,clrRed);
   IndicatorSetInteger(INDICATOR_LEVELCOLOR,1,clrRed);
   IndicatorSetInteger(INDICATOR_LEVELWIDTH,0,1);
   IndicatorSetInteger(INDICATOR_LEVELWIDTH,1,1);
   IndicatorSetDouble(INDICATOR_LEVELVALUE,0,-60);
   IndicatorSetDouble(INDICATOR_LEVELVALUE,1,60);

   ArraySetAsSeries(ind,true);
   SetIndexBuffer(0,ind);
   PlotIndexSetInteger(0,PLOT_DRAW_TYPE,DRAW_LINE);
   PlotIndexSetInteger(0,PLOT_LINE_STYLE,STYLE_SOLID);
   PlotIndexSetInteger(0,PLOT_LINE_WIDTH,2);
   PlotIndexSetInteger(0,PLOT_LINE_COLOR,clr);
   PlotIndexSetString(0,PLOT_LABEL,"_tstWPRusd_");

   ArraySetAsSeries(ma,true);
   SetIndexBuffer(1,ma);
   PlotIndexSetInteger(1,PLOT_DRAW_TYPE,DRAW_LINE);
   PlotIndexSetInteger(1,PLOT_LINE_STYLE,STYLE_SOLID);
   PlotIndexSetInteger(1,PLOT_LINE_WIDTH,1);
   PlotIndexSetInteger(1,PLOT_LINE_COLOR,clrMA);
   PlotIndexSetString(1,PLOT_LABEL,"Middle_Basket_line_MA");

   iUp=iDw=0;
//---
   return(INIT_SUCCEEDED);
  }
//+------------------------------------------------------------------+
//|                                                                  |
//+------------------------------------------------------------------+
double GetValue(int shift)
  {
   double dBuf[1];
   double res=0.0;
   for(int i=0; i<LG; i++)
     {
      CopyBuffer(h[i],0,shift,1,dBuf);
      if(bDirect[i]==true)
         res+=dBuf[0];
      else
         res+=-(dBuf[0]+100);
     }//end for (int i = 0; i < iCount; i++)
   res=res/LG;
   return (NormalizeDouble((res + 50) * 2, _Digits) );
  }
//+------------------------------------------------------------------+
//| Custom indicator iteration function                              |
//+------------------------------------------------------------------+
int OnCalculate(const int rates_total,
                const int prev_calculated,
                const datetime &time[],
                const double &open[],
                const double &high[],
                const double &low[],
                const double &close[],
                const long &tick_volume[],
                const long &volume[],
                const int &spread[])
  {
//---
   if(prev_calculated==0 || rates_total>prev_calculated+1)
     {
      int rt=rates_total-WPR;
      for(int i=1; i<rt; i++)
        {
         ind[i]=GetValue(i);
        }
      rt-=maperiod;
      for(int i=1; i<rt; i++)
        {
         ma[i]=GetMA(ind,i,maperiod,_Digits);
        }
      rt--;
      for(int i=1; i<rt; i++)
        {
         if(ind[i] > ma[i] && ind[i+1] < ma[i+1]) {iUp++; continue;}
         if(ind[i] < ma[i] && ind[i+1] > ma[i+1]) {iDw++; continue;}
        }
      PrintFormat("BUY count: %d SELL count: %d",iUp,iDw);
     }
   else
     {
     }
//--- return value of prev_calculated for next call
   return(rates_total);
  }
//+------------------------------------------------------------------+

void OnDeinit(const int reason)
  {
   for(int i=0; i<LG; i++)
     {
      if(h[i]!=INVALID_HANDLE) IndicatorRelease(h[i]);
     }
   string text;
   switch(reason)
     {
      case REASON_PROGRAM:
         text="Indicator terminated its operation by calling the ExpertRemove() function";break;
      case REASON_INITFAILED:
         text="This value means that OnInit() handler "+__FILE__+" has returned a nonzero value";break;
      case REASON_CLOSE:
         text="Terminal has been closed"; break;
      case REASON_ACCOUNT:
         text="Account was changed";break;
      case REASON_CHARTCHANGE:
         text="Symbol or timeframe was changed";break;
      case REASON_CHARTCLOSE:
         text="Chart was closed";break;
      case REASON_PARAMETERS:
         text="Input-parameter was changed";break;
      case REASON_RECOMPILE:
         text="Program "+__FILE__+" was recompiled";break;
      case REASON_REMOVE:
         text="Program "+__FILE__+" was removed from chart";break;
      case REASON_TEMPLATE:
         text="New template was applied to chart";break;
      default:text="Another reason";
     }
   PrintFormat("%s",text);
  }
//+------------------------------------------------------------------+

double GetMA(const double &arr[],int index,int period,int digit)
  {
   double m=0;
   for(int j=0; j<period; j++) m+=arr[index+j];
   m/=period;
   return (NormalizeDouble(m,digit));
  }
//+------------------------------------------------------------------+
The indicator counts the number of times the unified indicator crosses the moving average within the entire available history. Let's place the indicator on EURUSD and get the data on the USD basket for the timeframes we are interested in:
| Received signals | ||||||
| H1 | H4 | D1 | ||||
| Buy | Sell | Buy | Sell | Buy | Sell | |
| EURUSD | 8992 | 8992 | 2448 | 2449 | 550 | 551 |
| History depth | 2005.09.08 | 2004.10.11 | 2000.02.28 | |||
We see that there are enough signals. Let's assume that the situation is similar on other currency baskets and we do not need to check them.
The screenshot below illustrates the indicator operation:
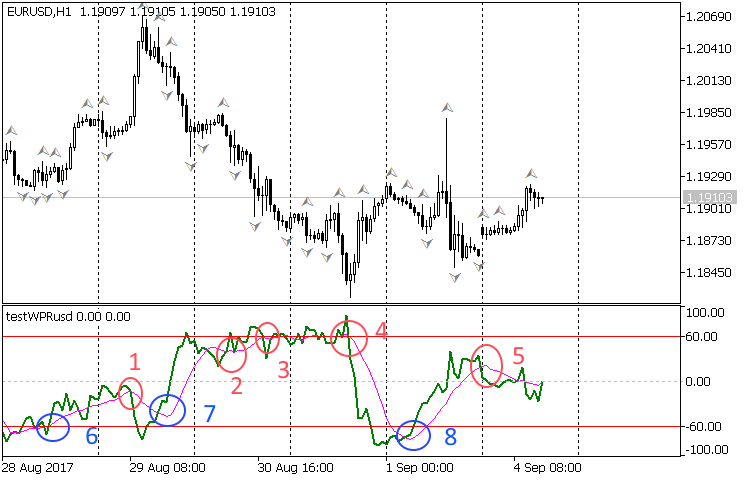
A lot of potential signals immediately catch our eye. Obviously, there are many false ones among them, but it is too early to think about it. We will paint buy signals in blue and sell ones in red.
The operation logic for our studies is as follows:
- Get an entry signal, enter. Exit after getting an opposite signal. Enter the opposite direction. Repeat the sequence by receiving the appropriate signals.
In case there is no any additional filtration, the method implies a constant presence in the market. Most likely, we will need this kind of filtration but we will consider this issue later. In the meantime, the difference in the quality of the signals on the screenshot is evident:
- clear signals at points 7 and 8 (blue);
- good signal at point 5 (red);
- cluster of differently directed signals at points 2, 3 and 4 (red).
Let's introduce the rules for distinguishing "good" signals from "bad" ones. On the two following images, we see the features allowing us to accurately reveal "good" signals:
| "Good" pattern (signal) we are looking for | No pattern, "bad" signal |
|
|
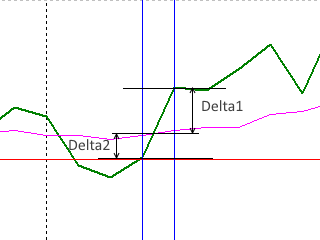
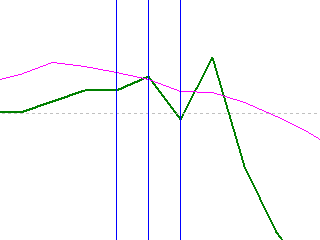
The combined WPR graph for USD is displayed in green, the crimson line represents the moving average, while the vertical blue lines show the pattern borders.
We assume that Delta1 and Delta2 distances values should not be less than 5% for entry patterns.
Nevertheless, we use the "bad" patterns, like in the image to the right, as well. They do not provide exit signals. Instead, they warn of a possible trend change or slowdown. Thus, they can be used for exiting the market or sorting out (this is exactly what we are going to do).
Starting the test
For further work, we need the EA provided in the attached testEAbasket.mq5 file below:
//+------------------------------------------------------------------+
//|                                                 testEAbasket.mq5 |
//|                        Copyright 2017, MetaQuotes Software Corp. |
//|                                             https://www.mql5.com |
//+------------------------------------------------------------------+
#property copyright "Copyright 2017, MetaQuotes Software Corp."
#property link      "https://www.mql5.com"
#property version   "1.00"

#include <Trade\\Trade.mqh>

#define LG 7

enum BSTATE
  {
   BCLOSE = 0,
   BBUY   = 1,
   BSELL  = 2
  };
//+------------------------------------------------------------------+
//| Expert initialization function                                   |
//+------------------------------------------------------------------+
input int wpr = 20;
input int ma  = 10;
input double lt = 0.01; //lot

string pair[]={"EURUSD","GBPUSD","AUDUSD","NZDUSD","USDCAD","USDCHF","USDJPY"};
bool bDirect[]={false,false,false,false,true,true,true};

int h;
ulong  Ticket[LG];

double m[1],ml;
double w[1],wl;

BSTATE g_state;

double g_dMinSize = 5.0;

int OnInit()
  {
   h = iCustom(NULL,0,"testWPR&MA",wpr,ma);
   if (h == INVALID_HANDLE) {
      Print("Error while creating testWPReur");
      return (INIT_FAILED);
   }

   g_state = BCLOSE;

   EventSetTimer(1);
//---
   return(INIT_SUCCEEDED);
  }
//+------------------------------------------------------------------+
//| Expert deinitialization function                                 |
//+------------------------------------------------------------------+
void OnDeinit(const int reason)
  {
   IndicatorRelease(h);
   EventKillTimer();

  }
//+------------------------------------------------------------------+
//| Expert tick function                                             |
//+------------------------------------------------------------------+
void OnTick()
  {
//---

  }
//+------------------------------------------------------------------+
//| Timer function                                                   |
//+------------------------------------------------------------------+
void OnTimer()
  {
   if(IsNewCandle())
     {
         wl = w[0];
         CopyBuffer(h,0,1,1,w);
         ml = m[0];
         CopyBuffer(h,1,1,1,m);
         if ( w[0] > m[0] && wl < ml) {
            if (g_state != BCLOSE) CloseAllPos();
            if ( w[0] - m[0] >= g_dMinSize && ml - wl >= g_dMinSize) {
               EnterBuy(lt);
               g_state = BBUY;
            }
         }
         if ( w[0] < m[0] && wl > ml) {
            if (g_state != BCLOSE) CloseAllPos();
            if ( m[0] - w[0] >= g_dMinSize && wl - ml >= g_dMinSize) {
               EnterSell(lt);
               g_state = BSELL;
            }
         }
     }
  }
//+------------------------------------------------------------------+

void CloseAllPos()
  {

   CTrade Trade;
   Trade.LogLevel(LOG_LEVEL_NO);

   for(int i=0; i<LG; i++)
     {

      Trade.PositionClose(Ticket[i]);
     }

     g_state = BCLOSE;

  }
//+------------------------------------------------------------------+
//|                                                                  |
//+------------------------------------------------------------------+
void EnterBuy(double lot)
  {

   CTrade Trade;
   Trade.LogLevel(LOG_LEVEL_NO);

   for(int i=0; i<LG; i++)
     {
      if(bDirect[i])
        { //send buy
         Trade.Buy(lot,pair[i]);
         Ticket[i]=Trade.ResultDeal();
        }
      else
        { //send sell
         Trade.Sell(lot,pair[i]);
         Ticket[i]=Trade.ResultDeal();
        }
     }
     g_state = BBUY;
  }
//+------------------------------------------------------------------+
//|                                                                  |
//+------------------------------------------------------------------+
void EnterSell(double lot)
  {

   CTrade Trade;
   Trade.LogLevel(LOG_LEVEL_NO);

   for(int i=0; i<LG; i++)
     {
      if(bDirect[i])
        { //send sell
         Trade.Sell(lot,pair[i]);
         Ticket[i]=Trade.ResultDeal();
        }
      else
        { //send buy
         Trade.Buy(lot,pair[i]);
         Ticket[i]=Trade.ResultDeal();
        }
     }
     g_state = BSELL;
  }

bool IsNewCandle()
  {

   static int candle=-1;

   int t1=0;
   switch(_Period)
     {
      case PERIOD_H1:  t1 = Hour();   break;
      case PERIOD_H4:  t1 = Hour4();  break;
      case PERIOD_D1:  t1 = Day();    break;
     }
   if(t1 != candle) {candle=t1; return(true);}
   return (false);
  }
int Hour4(){return((int)Hour()/4);}
//+------------------------------------------------------------------+
//|                                                                  |
//+------------------------------------------------------------------+
int Day()
  {
   MqlDateTime tm;
   TimeCurrent(tm);
   return(tm.day);
  }
//+------------------------------------------------------------------+
//|                                                                  |
//+------------------------------------------------------------------+
int Hour()
  {
   MqlDateTime tm;
   TimeCurrent(tm);
   return(tm.hour);
  }
Let's test it in the strategy tester on the last year's data on H1, H4 and D1 timeframes. We will analyze the USD currency pairs basket.
The analysis results can be found in the attached testEAbasket.zip archive in the form of standard reports. We can immediately say that the test results are negative. With the existing settings, the EA is unprofitable on all three timeframes. This is a negative, but quite expected result. It is difficult to assume that you can get a significant profit with such a large number of trades determined earlier. The following circumstances also affected the result:
- The moving average pattern always lags behind (by definition).
- In the standard technical analysis, the decision to enter the market is not based on the behavior of a single fast moving average.
- The EA provides only a minimal sorting out of signals based on the "quality" of the patterns. This is clearly not enough, especially since the criterion of the pattern "quality" is determined only preliminarily and may be inaccurate.
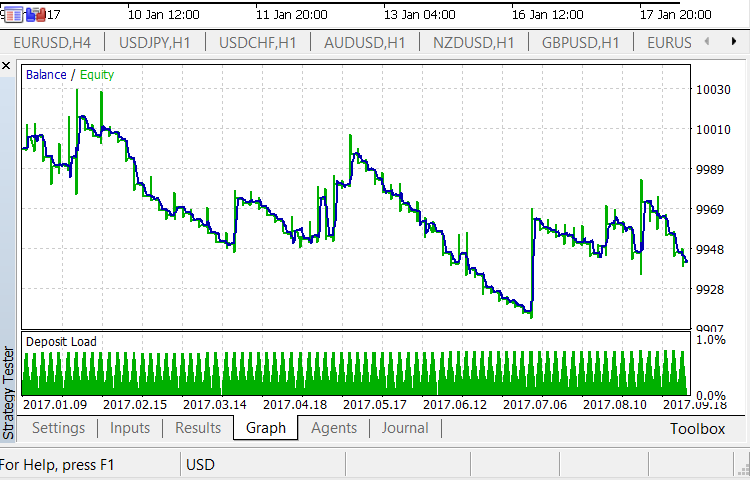
However, despite the generally negative result, there is some glimmer of hope. In the first part of the article, we saw that the pattern in question works well on H4. The pattern we are talking about now shows itself relatively well on H1. The result is negative, but it also showed profit. The decrease in profitability is not so steep:
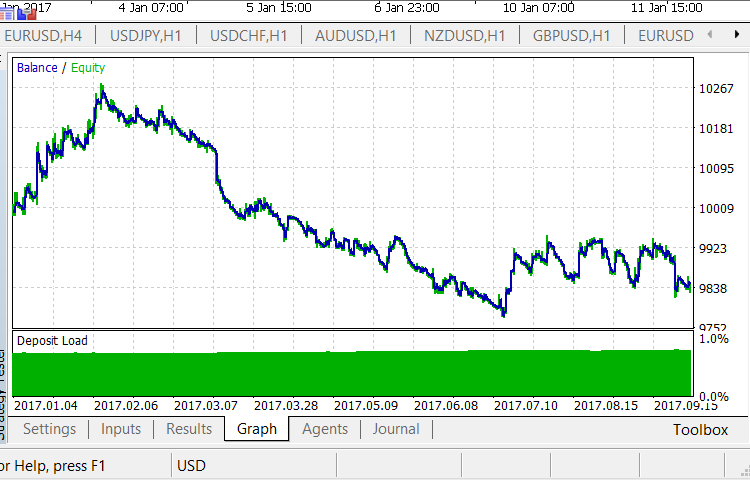
It is possible to assume that if the EA and its settings are changed a bit, we have good prospects. We see that the balance shows profit during the tests. There have been a lot of trades but the curve has quite deep valleys indicating the succession of negative results. But the sequences of positive results are present as well! Let's try to increase the pattern profitability on this timeframe by making changes in the EA code.
Correcting the pattern form
The first thing that comes to mind is changing the pattern form (Delta1 and Delta2 parameters). Initially, we chose 5%. Should we change it? The lesser the value, the more often the EA enters the market. The higher value decreases the amount of entries making the pattern "stronger" and faster, as well as increasing the "trend change impulse".
I strongly believe that we should neither increase nor decrease the value! This does not mean that it is optimal. But if we start optimizing it at this stage, we may get a value that works well on a separate time interval, a certain timeframe and a currency pair. In other words, we cannot be sure that the obtained value is universal.
However, it makes sense to take another step in this direction. We should limit the Delta1 and Delta2 values from "above" by setting their maximum value. This is logically justified since too "big" pattern can completely exhaust the movement by its sheer size causing a flat or a trend reversal instead of further movement. Moreover, a "big" pattern may end near the opposite border of the combined WPR range, which is a bad place for entering the market in the direction of an existing trend.
Thus, let's set the maximum Delta1 and Delta2 value to 10%. In this case, the pattern "size" is Delta1 + Delta2 = 20%. It is not too much. We should make the following changes in the EA:
1. Add the global variable:
double g_dMaxSize = 10.0;
2. Change the timer events processing function:
void OnTimer()
  {
   if(IsNewCandle())
     {
      wl=w[0];
      CopyBuffer(h,0,1,1,w);
      ml=m[0];
      CopyBuffer(h,1,1,1,m);
      double d1 = MathAbs(w[0] - m[0]);
      double d2 = MathAbs(ml - wl);
      if(w[0]>m[0] && wl<ml)
        {
         if(g_state!=BCLOSE) CloseAllPos();
         if(d1 >= g_dMinSize && d2 >= g_dMinSize &&
            d1 <= g_dMaxSize && d2 <= g_dMaxSize)
           {
            EnterBuy(lt);
            g_state=BBUY;
           }
        }
      if(w[0]<m[0] && wl>ml)
        {
         if(g_state!=BCLOSE) CloseAllPos();
         if(d1 >= g_dMinSize && d2 >= g_dMinSize &&
            d1 <= g_dMaxSize && d2 <= g_dMaxSize)
           {
            EnterSell(lt);
            g_state=BSELL;
           }
        }
     }
  }
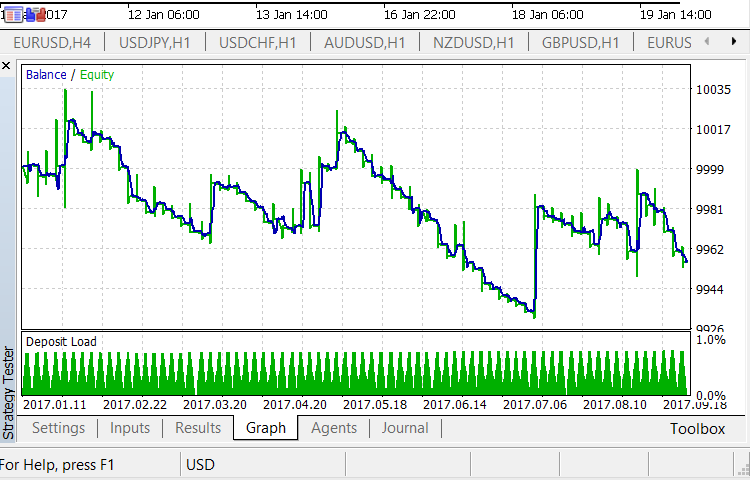
Let's continue the test on H1 using the altered EA. You can find its results in the attached testEAbasket1.zip archive. The appropriate graph is shown below:
The positive changes are obvious. The result is still negative but the loss is much less in absolute terms. The loss-making trend has become more unstable and sideways. There are deep drawdowns followed by recoveries. Of course, this test is insufficient for final conclusions, but applying the filter by Delta1 and Delta2 maximum values turned out to be beneficial. Let's implement these changes in the EA code.
From now on, we will not change the values obtained for Delta1 and Delta2. Again, it does not mean that these values are optimal. But keeping in mind that we should transfer them to other timeframes and baskets, I prefer to stick to them for a while.
The second filter
The next step is obvious:
- We cautiously enter the market in the direction of a trend when the combined WPR (as well as any other oscillator's) graph approaches its borders.
This is a well-known rule for using standard technical indicators, which can be extended to combined indicators as well. In previous articles, we already pointed out that a trend reversal, slowing or a flat are possible in that case. Now, we have to implement these considerations into the EA's second filter.
The combined WPR ranges from -100% to +100%. We cannot rely directly on these figures since the indicator approaches these boundaries but never reaches them. Instead, we have oversold/overbought borders. In the previous article, we examined the breakthrough of these borders, and we know their location. Let's use them.
We need to define the objective more precisely.
- Traders do NOT buy a currency basket if the combined WPR graph touches or breaks through the overbought border upwards.
- Traders do NOT sell a currency basket if the combined WPR graph touches or breaks through the oversold border downwards.
We have set the overbought borders at 60-70%, while oversold ones are set at -60% ... -70%. We will use the lower boundary values (60% and -60%) for the new filter. Let's assume that the combined WPR curve should locate below the filter border for buying the basket and above it — for selling. In other words, we are not going to search for a "full-fledged" moving average crossing pattern. Instead, we confine ourselves by filtration applied in the standard technical analysis:
- We will consider the relative position of the moving average and the indicator graph by "higher — lower" type.
Let's change the code block dealing with market entry conditions to achieve this:
       if(w[0]>m[0] && wl<ml)
        {
         if(g_state!=BCLOSE) CloseAllPos();
         if(d1 >= g_dMinSize && d2 >= g_dMinSize &&
            d1 <= g_dMaxSize && d2 <= g_dMaxSize && w[0] < 60)
           {
            EnterBuy(lt);
            g_state=BBUY;
           }
        }
      if(w[0]<m[0] && wl>ml)
        {
         if(g_state!=BCLOSE) CloseAllPos();
         if(d1 >= g_dMinSize && d2 >= g_dMinSize &&
            d1 <= g_dMaxSize && d2 <= g_dMaxSize && w[0] > -60)
           {
            EnterSell(lt);
            g_state=BSELL;
           }
        }
Let's test the Expert Advisor on the previously selected time interval and H1 timeframe. Here is the result:
Find the full archive in the attached testEAbasket2.zip file. The results do not differ much from the previous ones, although they are slightly better.
What is a possible reason? This may probably happen due to imprecise placing of the overbought/oversold levels, or an insufficient number of filtered trades, or both.
Does the obtained result mean that the applied filter is useless? No, it does not. Definite conclusions are possible only after we apply the filter to all baskets, all selected timeframes and time intervals that are significantly larger than one year. Therefore, let's leave this filter in the EA code, although its relevance remains questionable.
Completing work with the pattern
We fulfilled our plans concerning the USD basket pattern. The final EA version is in the attached testEAbasketFinal.mq5 file. The main conclusion based on conducted tests is as follows:
- This pattern cannot be used as a market entry signal.
Is it worth conducting tests on the remaining baskets? With a very high probability, the result is predictable.
The main consideration allowing us not to conduct tests on other currencies is that patterns based on a breakthough of a single МА are not used as a full-fledged market entry signal in real trading involving standard technical analysis. Therefore, we will try to use the pattern of the combined WPR graph crossing the moving average as a filter. The combined indicator breaking the overbought/oversold levels is to be applied as the main entry signal. Our goal is to find out how such a filter affects profitability.
Using the pattern as a filter
Let's define the initial problem.
- The combined WPR graph breaks through the oversold level upwards. The breakthrough remains at the candle closure. A trader buys the basket only if the moving average is "below" the combined indicator graph.
- In order to sell the basket, the situation should be opposite to the one described in the previous point.
- The combined WPR graph reaching the zone at 0% is used to exit the market.
As you can easily see, the "lite" version of the pattern (the "higher — lower" filter) is used again instead of the "full-fledged" pattern. The filter is applied to the relative position of the moving average and the combined WPR graph.
Let's change the testEAbasket.mq5 EA for testing purposes. We need to add the source data for describing overbought/oversold levels and the conditions of applying the pattern as a filter:
input int SELLPROFIT =   0;
input int SELL1LIMIT =  70;
input int SELL2FROM  =  60;
input int SELL2TO    =  50;

input int BUYPROFIT  =   0;
input int BUY1LIMIT  = -70;
input int BUY2FROM   = -60;
input int BUY2TO     = -50;

//...................................................................

//+------------------------------------------------------------------+
//| Timer function                                                   |
//+------------------------------------------------------------------+
void OnTimer()
  {
   if(IsNewCandle())
     {
      wl=w[0];
      CopyBuffer(h,0,1,1,w);
      ml=m[0];
      CopyBuffer(h,1,1,1,m);

      if(g_state==BBUY && (w[0]>=BUYPROFIT))
        {
         CloseAllPos();
        }
      if(g_state==BSELL && (w[0]<=SELLPROFIT))
        {
         CloseAllPos();
        }
      if(g_state==BCLOSE && w[0]>=BUY2FROM && w[0]<=BUY2TO && wl<=BUY1LIMIT && w[0] > m[0])
        {
            EnterBuy(lt);
            return;
        }


      if(g_state==BCLOSE && w[0]<=SELL2FROM && w[0]>=SELL2TO && wl>=SELL1LIMIT && w[0] < m[0])
        {
            EnterSell(lt);
            return;
        }
    }
  }
Find the full EA code in the attached testEAbasket1.mq5 file.
Use H1 timeframe for testing. The maximum number of trades with a sharply negative result have been detected on it. This result can be found in the previous article. We will not repeat the test here.
We will carry out the test using the pattern from this article as a filter on the annual interval. The result is as follows:
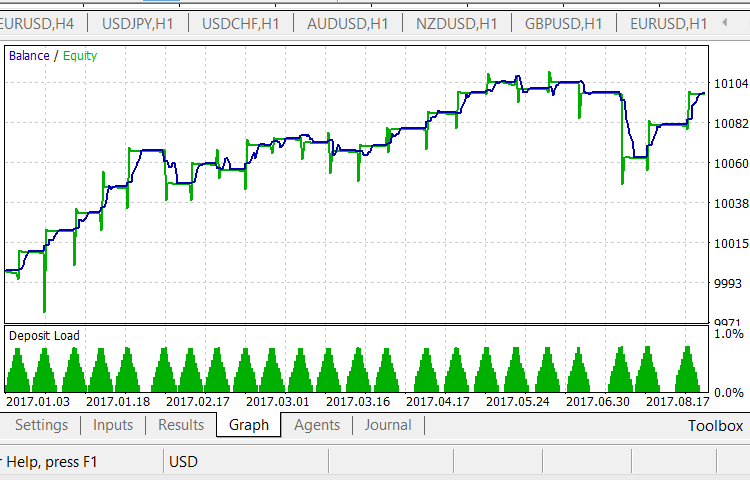
Applying the pattern from this article as a filter yielded positive results! We have obtained a fairly smooth curve having a clear profit increase tendency. Unfortunately, there are not as much trades as we would like it to perform. When applying the EA to larger timeframes, this number will decrease even further.
Find the full test report in the attached Tester_EURUSD_Filter.zip archive.
Conclusion
We have completed the testing of the patterns arising from the use of combined indicators based on oscillators for a certain basket currency. We used the combined WPR as a basis, but the results can be extended to both RSI and Stoch.
However, we have to admit that we still cannot apply the patterns in practice. Accumulated statistics is clearly not sufficient. This also applies to test time intervals as well as to the pattern parameters themselves. Selecting the MA period also remains rather controversial.
At the same time, we have obtained interesting results.
- We have evaluated the location of oversold/overbought levels and the prospects of working with them.
- We have also checked the applicability of the combined indicator graph crossing the moving average.
- We have evaluated the joint application of patterns consisting of the two previous points.
In other words, we have made the first step in putting this method into practice.
Programs used in the article:
| # | Name | Type | Description |
|---|---|---|---|
| 1 | testWPR&MA.mq5 | Indicator | Checking the number of times the combined indicator graph crosses the moving average. |
| 2 | testEAbasket.mq5 | Expert Advisor | Expert Advisor for testing. |
| 3 | testEAbasket.zip | Archive | Standard html reports on the testEABasket.mq5 EA operation with the USD basket. |
| 4 | testEAbasket1.zip | Archive | Standard html report on the testEABasket.mq5 EA operation with the USD basket and the first filter. |
| 5 | testEAbasket2.zip | Expert Advisor | Standard html report on the testEABasket.mq5 EA operation with the USD basket and two filters. |
| 6 | testEAbasketFinal.mq5 | Expert Advisor | Final version of the testEAbasket.mq5 EA. |
| 7 | testEAbasket1.mq5 | Expert Advisor | Expert Advisor for testing. |
| 8 | Tester_EURUSD_Filter.zip | Archive | Archive with reports on testEAbasket1.mq5 EA testing. |
Translated from Russian by MetaQuotes Ltd.
Original article: https://www.mql5.com/ru/articles/3818
Warning: All rights to these materials are reserved by MetaQuotes Ltd. Copying or reprinting of these materials in whole or in part is prohibited.
This article was written by a user of the site and reflects their personal views. MetaQuotes Ltd is not responsible for the accuracy of the information presented, nor for any consequences resulting from the use of the solutions, strategies or recommendations described.

 The NRTR indicator and trading modules based on NRTR for the MQL5 Wizard
 Creating a custom news feed for MetaTrader 5
- Free trading apps
- Over 8,000 signals for copying
- Economic news for exploring financial markets
You agree to website policy and terms of use
Two questions.
- If EURUSD is traded, why is only the USD basket analysed and the EUR basket is left out of brackets.
- It is written under the chart with signals: "Just mark the buy entry signals in blue and sell entry signals in red." There is either something confused or understated here. Since the basket is USD, buying USD means selling EURUSD and vice versa. Either the colour should be changed, or it should be added to the phrase that it means buying and selling USD, not the instrument. The chart clearly shows that the indicator is inversely related to the price.
The whole series of articles is devoted to trading currency baskets. The section, the phrase from which you quote, explains what signals we are talking about - buying/selling of the basket. It makes hardly any sense to repeat in each article what is buying and selling a basket.
And trading is NOT conducted on EURUSD. Trading is done on USD, as an example.